Free Statistics

of Irreproducible Research!

Author's title

Author*Unverified author*
R Software Modulerwasp_autocorrelation.wasp
Title produced by software(Partial) Autocorrelation Function
Date of computationSun, 25 Nov 2007 09:29:47 -0700
Cite this page as followsStatistical Computations at FreeStatistics.org, Office for Research Development and Education, URL https://freestatistics.org/blog/index.php?v=date/2007/Nov/25/t1196007680rsrwrcl9pbn52pz.htm/, Retrieved Sat, 04 May 2024 18:33:09 +0000
Statistical Computations at FreeStatistics.org, Office for Research Development and Education, URL https://freestatistics.org/blog/index.php?pk=6495, Retrieved Sat, 04 May 2024 18:33:09 +0000
QR Codes:

Original text written by user:
IsPrivate?No (this computation is public)
User-defined keywords
Estimated Impact197
Family? (F = Feedback message, R = changed R code, M = changed R Module, P = changed Parameters, D = changed Data)
-       [(Partial) Autocorrelation Function] [Q2 Autocorrelatio...] [2007-11-25 16:29:47] [48e0b7671e607713e2c1c3706de6df4e] [Current]
Feedback Forum

Post a new message
Dataseries X:
105.1
113.3
99.1
100.3
93.5
98.8
106.2
98.3
102.1
117.1
101.5
80.5
105.9
109.5
97.2
114.5
93.5
100.9
121.1
116.5
109.3
118.1
108.3
105.4
116.2
111.2
105.8
122.7
99.5
107.9
124.6
115
110.3
132.7
99.7
96.5
118.7
112.9
130.5
137.9
115
116.8
140.9
120.7
134.2
147.3
112.4
107.1
128.4
137.7
135
151
137.4
132.4
161.3
139.8
146
154.6
142.1
120.5


Summary of compuational transaction
Raw Inputview raw input (R code)
Raw Outputview raw output of R engine
Computing time1 seconds
R Server'Gwilym Jenkins' @ 72.249.127.135

\begin{tabular}{lllllllll}
\hline
Summary of compuational transaction \tabularnewline
Raw Input & view raw input (R code)  \tabularnewline
Raw Output & view raw output of R engine  \tabularnewline
Computing time & 1 seconds \tabularnewline
R Server & 'Gwilym Jenkins' @ 72.249.127.135 \tabularnewline
\hline
\end{tabular}
%Source: https://freestatistics.org/blog/index.php?pk=6495&T=0

[TABLE]
[ROW][C]Summary of compuational transaction[/C][/ROW]
[ROW][C]Raw Input[/C][C]view raw input (R code) [/C][/ROW]
[ROW][C]Raw Output[/C][C]view raw output of R engine [/C][/ROW]
[ROW][C]Computing time[/C][C]1 seconds[/C][/ROW]
[ROW][C]R Server[/C][C]'Gwilym Jenkins' @ 72.249.127.135[/C][/ROW]
[/TABLE]
Source: https://freestatistics.org/blog/index.php?pk=6495&T=0

Globally Unique Identifier (entire table): ba.freestatistics.org/blog/index.php?pk=6495&T=0

As an alternative you can also use a QR Code:  

The GUIDs for individual cells are displayed in the table below:

Summary of compuational transaction
Raw Inputview raw input (R code)
Raw Outputview raw output of R engine
Computing time1 seconds
R Server'Gwilym Jenkins' @ 72.249.127.135


Autocorrelation Function
Time lag kACF(k)T-STATP-value
016.85570
1-0.41033-2.81310.99643
2-0.167141-1.14590.871173
30.0542330.37180.355855
40.0473830.32480.37337
50.0304110.20850.417874
6-0.004065-0.02790.511058
7-0.000191-0.00130.500519
8-0.129492-0.88770.810402
90.1446550.99170.16321
10-0.083704-0.57380.715596
110.1075420.73730.232311
12-0.152392-1.04470.849258
13-0.029969-0.20550.58095
140.1352060.92690.17935
15-0.06552-0.44920.672318
160.1466881.00560.159869
17-0.207457-1.42230.919222
180.0637910.43730.331937
19-0.02071-0.1420.556149
200.02390.16390.435275
210.030350.20810.418038
220.0156920.10760.457394
230.0468990.32150.37462
24-0.212685-1.45810.924268
250.1379210.94550.17461
260.0882510.6050.274039
27-0.088411-0.60610.726323
28-0.094208-0.64590.739244
290.1216660.83410.204222
30-0.014359-0.09840.538998
31-0.001351-0.00930.503674
320.0131430.09010.464295
33-0.085507-0.58620.71973
340.0554980.38050.352653
350.0383460.26290.396895
36-0.022699-0.15560.5615
370.0266470.18270.427917
38-0.084925-0.58220.718397
390.0406560.27870.390839
400.063990.43870.331446
41-0.045004-0.30850.620479
42-0.079929-0.5480.706847
430.1148870.78760.217434
44-0.037663-0.25820.601311
45-0.025008-0.17140.567697
460.0149660.10260.459358
47NANANA
48NANANA
49NANANA
50NANANA
51NANANA
52NANANA
53NANANA
54NANANA
55NANANA
56NANANA
57NANANA
58NANANA
59NANANA

\begin{tabular}{lllllllll}
\hline
Autocorrelation Function \tabularnewline
Time lag k & ACF(k) & T-STAT & P-value \tabularnewline
0 & 1 & 6.8557 & 0 \tabularnewline
1 & -0.41033 & -2.8131 & 0.99643 \tabularnewline
2 & -0.167141 & -1.1459 & 0.871173 \tabularnewline
3 & 0.054233 & 0.3718 & 0.355855 \tabularnewline
4 & 0.047383 & 0.3248 & 0.37337 \tabularnewline
5 & 0.030411 & 0.2085 & 0.417874 \tabularnewline
6 & -0.004065 & -0.0279 & 0.511058 \tabularnewline
7 & -0.000191 & -0.0013 & 0.500519 \tabularnewline
8 & -0.129492 & -0.8877 & 0.810402 \tabularnewline
9 & 0.144655 & 0.9917 & 0.16321 \tabularnewline
10 & -0.083704 & -0.5738 & 0.715596 \tabularnewline
11 & 0.107542 & 0.7373 & 0.232311 \tabularnewline
12 & -0.152392 & -1.0447 & 0.849258 \tabularnewline
13 & -0.029969 & -0.2055 & 0.58095 \tabularnewline
14 & 0.135206 & 0.9269 & 0.17935 \tabularnewline
15 & -0.06552 & -0.4492 & 0.672318 \tabularnewline
16 & 0.146688 & 1.0056 & 0.159869 \tabularnewline
17 & -0.207457 & -1.4223 & 0.919222 \tabularnewline
18 & 0.063791 & 0.4373 & 0.331937 \tabularnewline
19 & -0.02071 & -0.142 & 0.556149 \tabularnewline
20 & 0.0239 & 0.1639 & 0.435275 \tabularnewline
21 & 0.03035 & 0.2081 & 0.418038 \tabularnewline
22 & 0.015692 & 0.1076 & 0.457394 \tabularnewline
23 & 0.046899 & 0.3215 & 0.37462 \tabularnewline
24 & -0.212685 & -1.4581 & 0.924268 \tabularnewline
25 & 0.137921 & 0.9455 & 0.17461 \tabularnewline
26 & 0.088251 & 0.605 & 0.274039 \tabularnewline
27 & -0.088411 & -0.6061 & 0.726323 \tabularnewline
28 & -0.094208 & -0.6459 & 0.739244 \tabularnewline
29 & 0.121666 & 0.8341 & 0.204222 \tabularnewline
30 & -0.014359 & -0.0984 & 0.538998 \tabularnewline
31 & -0.001351 & -0.0093 & 0.503674 \tabularnewline
32 & 0.013143 & 0.0901 & 0.464295 \tabularnewline
33 & -0.085507 & -0.5862 & 0.71973 \tabularnewline
34 & 0.055498 & 0.3805 & 0.352653 \tabularnewline
35 & 0.038346 & 0.2629 & 0.396895 \tabularnewline
36 & -0.022699 & -0.1556 & 0.5615 \tabularnewline
37 & 0.026647 & 0.1827 & 0.427917 \tabularnewline
38 & -0.084925 & -0.5822 & 0.718397 \tabularnewline
39 & 0.040656 & 0.2787 & 0.390839 \tabularnewline
40 & 0.06399 & 0.4387 & 0.331446 \tabularnewline
41 & -0.045004 & -0.3085 & 0.620479 \tabularnewline
42 & -0.079929 & -0.548 & 0.706847 \tabularnewline
43 & 0.114887 & 0.7876 & 0.217434 \tabularnewline
44 & -0.037663 & -0.2582 & 0.601311 \tabularnewline
45 & -0.025008 & -0.1714 & 0.567697 \tabularnewline
46 & 0.014966 & 0.1026 & 0.459358 \tabularnewline
47 & NA & NA & NA \tabularnewline
48 & NA & NA & NA \tabularnewline
49 & NA & NA & NA \tabularnewline
50 & NA & NA & NA \tabularnewline
51 & NA & NA & NA \tabularnewline
52 & NA & NA & NA \tabularnewline
53 & NA & NA & NA \tabularnewline
54 & NA & NA & NA \tabularnewline
55 & NA & NA & NA \tabularnewline
56 & NA & NA & NA \tabularnewline
57 & NA & NA & NA \tabularnewline
58 & NA & NA & NA \tabularnewline
59 & NA & NA & NA \tabularnewline
\hline
\end{tabular}
%Source: https://freestatistics.org/blog/index.php?pk=6495&T=1

[TABLE]
[ROW][C]Autocorrelation Function[/C][/ROW]
[ROW][C]Time lag k[/C][C]ACF(k)[/C][C]T-STAT[/C][C]P-value[/C][/ROW]
[ROW][C]0[/C][C]1[/C][C]6.8557[/C][C]0[/C][/ROW]
[ROW][C]1[/C][C]-0.41033[/C][C]-2.8131[/C][C]0.99643[/C][/ROW]
[ROW][C]2[/C][C]-0.167141[/C][C]-1.1459[/C][C]0.871173[/C][/ROW]
[ROW][C]3[/C][C]0.054233[/C][C]0.3718[/C][C]0.355855[/C][/ROW]
[ROW][C]4[/C][C]0.047383[/C][C]0.3248[/C][C]0.37337[/C][/ROW]
[ROW][C]5[/C][C]0.030411[/C][C]0.2085[/C][C]0.417874[/C][/ROW]
[ROW][C]6[/C][C]-0.004065[/C][C]-0.0279[/C][C]0.511058[/C][/ROW]
[ROW][C]7[/C][C]-0.000191[/C][C]-0.0013[/C][C]0.500519[/C][/ROW]
[ROW][C]8[/C][C]-0.129492[/C][C]-0.8877[/C][C]0.810402[/C][/ROW]
[ROW][C]9[/C][C]0.144655[/C][C]0.9917[/C][C]0.16321[/C][/ROW]
[ROW][C]10[/C][C]-0.083704[/C][C]-0.5738[/C][C]0.715596[/C][/ROW]
[ROW][C]11[/C][C]0.107542[/C][C]0.7373[/C][C]0.232311[/C][/ROW]
[ROW][C]12[/C][C]-0.152392[/C][C]-1.0447[/C][C]0.849258[/C][/ROW]
[ROW][C]13[/C][C]-0.029969[/C][C]-0.2055[/C][C]0.58095[/C][/ROW]
[ROW][C]14[/C][C]0.135206[/C][C]0.9269[/C][C]0.17935[/C][/ROW]
[ROW][C]15[/C][C]-0.06552[/C][C]-0.4492[/C][C]0.672318[/C][/ROW]
[ROW][C]16[/C][C]0.146688[/C][C]1.0056[/C][C]0.159869[/C][/ROW]
[ROW][C]17[/C][C]-0.207457[/C][C]-1.4223[/C][C]0.919222[/C][/ROW]
[ROW][C]18[/C][C]0.063791[/C][C]0.4373[/C][C]0.331937[/C][/ROW]
[ROW][C]19[/C][C]-0.02071[/C][C]-0.142[/C][C]0.556149[/C][/ROW]
[ROW][C]20[/C][C]0.0239[/C][C]0.1639[/C][C]0.435275[/C][/ROW]
[ROW][C]21[/C][C]0.03035[/C][C]0.2081[/C][C]0.418038[/C][/ROW]
[ROW][C]22[/C][C]0.015692[/C][C]0.1076[/C][C]0.457394[/C][/ROW]
[ROW][C]23[/C][C]0.046899[/C][C]0.3215[/C][C]0.37462[/C][/ROW]
[ROW][C]24[/C][C]-0.212685[/C][C]-1.4581[/C][C]0.924268[/C][/ROW]
[ROW][C]25[/C][C]0.137921[/C][C]0.9455[/C][C]0.17461[/C][/ROW]
[ROW][C]26[/C][C]0.088251[/C][C]0.605[/C][C]0.274039[/C][/ROW]
[ROW][C]27[/C][C]-0.088411[/C][C]-0.6061[/C][C]0.726323[/C][/ROW]
[ROW][C]28[/C][C]-0.094208[/C][C]-0.6459[/C][C]0.739244[/C][/ROW]
[ROW][C]29[/C][C]0.121666[/C][C]0.8341[/C][C]0.204222[/C][/ROW]
[ROW][C]30[/C][C]-0.014359[/C][C]-0.0984[/C][C]0.538998[/C][/ROW]
[ROW][C]31[/C][C]-0.001351[/C][C]-0.0093[/C][C]0.503674[/C][/ROW]
[ROW][C]32[/C][C]0.013143[/C][C]0.0901[/C][C]0.464295[/C][/ROW]
[ROW][C]33[/C][C]-0.085507[/C][C]-0.5862[/C][C]0.71973[/C][/ROW]
[ROW][C]34[/C][C]0.055498[/C][C]0.3805[/C][C]0.352653[/C][/ROW]
[ROW][C]35[/C][C]0.038346[/C][C]0.2629[/C][C]0.396895[/C][/ROW]
[ROW][C]36[/C][C]-0.022699[/C][C]-0.1556[/C][C]0.5615[/C][/ROW]
[ROW][C]37[/C][C]0.026647[/C][C]0.1827[/C][C]0.427917[/C][/ROW]
[ROW][C]38[/C][C]-0.084925[/C][C]-0.5822[/C][C]0.718397[/C][/ROW]
[ROW][C]39[/C][C]0.040656[/C][C]0.2787[/C][C]0.390839[/C][/ROW]
[ROW][C]40[/C][C]0.06399[/C][C]0.4387[/C][C]0.331446[/C][/ROW]
[ROW][C]41[/C][C]-0.045004[/C][C]-0.3085[/C][C]0.620479[/C][/ROW]
[ROW][C]42[/C][C]-0.079929[/C][C]-0.548[/C][C]0.706847[/C][/ROW]
[ROW][C]43[/C][C]0.114887[/C][C]0.7876[/C][C]0.217434[/C][/ROW]
[ROW][C]44[/C][C]-0.037663[/C][C]-0.2582[/C][C]0.601311[/C][/ROW]
[ROW][C]45[/C][C]-0.025008[/C][C]-0.1714[/C][C]0.567697[/C][/ROW]
[ROW][C]46[/C][C]0.014966[/C][C]0.1026[/C][C]0.459358[/C][/ROW]
[ROW][C]47[/C][C]NA[/C][C]NA[/C][C]NA[/C][/ROW]
[ROW][C]48[/C][C]NA[/C][C]NA[/C][C]NA[/C][/ROW]
[ROW][C]49[/C][C]NA[/C][C]NA[/C][C]NA[/C][/ROW]
[ROW][C]50[/C][C]NA[/C][C]NA[/C][C]NA[/C][/ROW]
[ROW][C]51[/C][C]NA[/C][C]NA[/C][C]NA[/C][/ROW]
[ROW][C]52[/C][C]NA[/C][C]NA[/C][C]NA[/C][/ROW]
[ROW][C]53[/C][C]NA[/C][C]NA[/C][C]NA[/C][/ROW]
[ROW][C]54[/C][C]NA[/C][C]NA[/C][C]NA[/C][/ROW]
[ROW][C]55[/C][C]NA[/C][C]NA[/C][C]NA[/C][/ROW]
[ROW][C]56[/C][C]NA[/C][C]NA[/C][C]NA[/C][/ROW]
[ROW][C]57[/C][C]NA[/C][C]NA[/C][C]NA[/C][/ROW]
[ROW][C]58[/C][C]NA[/C][C]NA[/C][C]NA[/C][/ROW]
[ROW][C]59[/C][C]NA[/C][C]NA[/C][C]NA[/C][/ROW]
[/TABLE]
Source: https://freestatistics.org/blog/index.php?pk=6495&T=1

Globally Unique Identifier (entire table): ba.freestatistics.org/blog/index.php?pk=6495&T=1

As an alternative you can also use a QR Code:  

The GUIDs for individual cells are displayed in the table below:

Autocorrelation Function
Time lag kACF(k)T-STATP-value
016.85570
1-0.41033-2.81310.99643
2-0.167141-1.14590.871173
30.0542330.37180.355855
40.0473830.32480.37337
50.0304110.20850.417874
6-0.004065-0.02790.511058
7-0.000191-0.00130.500519
8-0.129492-0.88770.810402
90.1446550.99170.16321
10-0.083704-0.57380.715596
110.1075420.73730.232311
12-0.152392-1.04470.849258
13-0.029969-0.20550.58095
140.1352060.92690.17935
15-0.06552-0.44920.672318
160.1466881.00560.159869
17-0.207457-1.42230.919222
180.0637910.43730.331937
19-0.02071-0.1420.556149
200.02390.16390.435275
210.030350.20810.418038
220.0156920.10760.457394
230.0468990.32150.37462
24-0.212685-1.45810.924268
250.1379210.94550.17461
260.0882510.6050.274039
27-0.088411-0.60610.726323
28-0.094208-0.64590.739244
290.1216660.83410.204222
30-0.014359-0.09840.538998
31-0.001351-0.00930.503674
320.0131430.09010.464295
33-0.085507-0.58620.71973
340.0554980.38050.352653
350.0383460.26290.396895
36-0.022699-0.15560.5615
370.0266470.18270.427917
38-0.084925-0.58220.718397
390.0406560.27870.390839
400.063990.43870.331446
41-0.045004-0.30850.620479
42-0.079929-0.5480.706847
430.1148870.78760.217434
44-0.037663-0.25820.601311
45-0.025008-0.17140.567697
460.0149660.10260.459358
47NANANA
48NANANA
49NANANA
50NANANA
51NANANA
52NANANA
53NANANA
54NANANA
55NANANA
56NANANA
57NANANA
58NANANA
59NANANA


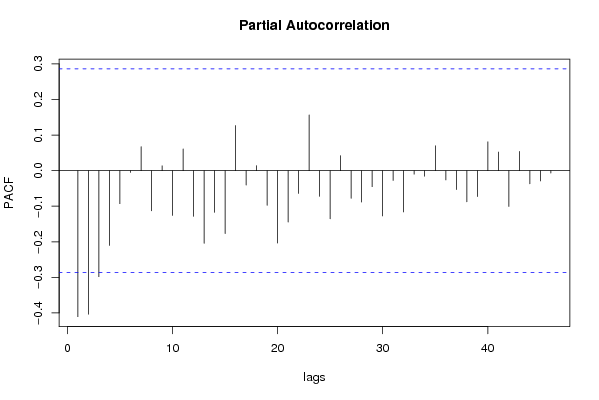
Partial Autocorrelation Function
Time lag kPACF(k)T-STATP-value
0-0.41033-2.81310.99643
1-0.403439-2.76580.995955
2-0.298105-2.04370.976695
3-0.210134-1.44060.921838
4-0.092995-0.63750.736568
5-0.004865-0.03340.513234
60.0675270.46290.322772
7-0.112938-0.77430.778674
80.0137690.09440.462598
9-0.125746-0.86210.803487
100.0612250.41970.338296
11-0.128204-0.87890.808043
12-0.204306-1.40070.916057
13-0.117214-0.80360.787158
14-0.176679-1.21120.884072
150.1266630.86840.194805
16-0.040349-0.27660.608358
170.0139870.09590.462008
18-0.097288-0.6670.745974
19-0.203602-1.39580.915337
20-0.144586-0.99120.836676
21-0.064118-0.43960.668868
220.1567851.07490.143961
23-0.07208-0.49420.68825
24-0.135326-0.92770.82086
250.0422510.28970.386676
26-0.077637-0.53230.701471
27-0.088189-0.60460.72582
28-0.045062-0.30890.62063
29-0.12714-0.87160.806078
30-0.027305-0.18720.573844
31-0.116004-0.79530.784776
32-0.009838-0.06740.526742
33-0.015512-0.10630.542121
340.0698740.4790.317069
35-0.026021-0.17840.570407
36-0.053161-0.36450.641423
37-0.087522-0.60.724314
38-0.072691-0.49830.689717
390.081240.5570.290102
400.0522630.35830.360864
41-0.100679-0.69020.753274
420.0539490.36990.356577
43-0.036939-0.25320.599407
44-0.028972-0.19860.578292
45-0.006596-0.04520.517939
46NANANA
47NANANA
48NANANA
49NANANA
50NANANA
51NANANA
52NANANA
53NANANA
54NANANA
55NANANA
56NANANA
57NANANA
58NANANA
59NANANA

\begin{tabular}{lllllllll}
\hline
Partial Autocorrelation Function \tabularnewline
Time lag k & PACF(k) & T-STAT & P-value \tabularnewline
0 & -0.41033 & -2.8131 & 0.99643 \tabularnewline
1 & -0.403439 & -2.7658 & 0.995955 \tabularnewline
2 & -0.298105 & -2.0437 & 0.976695 \tabularnewline
3 & -0.210134 & -1.4406 & 0.921838 \tabularnewline
4 & -0.092995 & -0.6375 & 0.736568 \tabularnewline
5 & -0.004865 & -0.0334 & 0.513234 \tabularnewline
6 & 0.067527 & 0.4629 & 0.322772 \tabularnewline
7 & -0.112938 & -0.7743 & 0.778674 \tabularnewline
8 & 0.013769 & 0.0944 & 0.462598 \tabularnewline
9 & -0.125746 & -0.8621 & 0.803487 \tabularnewline
10 & 0.061225 & 0.4197 & 0.338296 \tabularnewline
11 & -0.128204 & -0.8789 & 0.808043 \tabularnewline
12 & -0.204306 & -1.4007 & 0.916057 \tabularnewline
13 & -0.117214 & -0.8036 & 0.787158 \tabularnewline
14 & -0.176679 & -1.2112 & 0.884072 \tabularnewline
15 & 0.126663 & 0.8684 & 0.194805 \tabularnewline
16 & -0.040349 & -0.2766 & 0.608358 \tabularnewline
17 & 0.013987 & 0.0959 & 0.462008 \tabularnewline
18 & -0.097288 & -0.667 & 0.745974 \tabularnewline
19 & -0.203602 & -1.3958 & 0.915337 \tabularnewline
20 & -0.144586 & -0.9912 & 0.836676 \tabularnewline
21 & -0.064118 & -0.4396 & 0.668868 \tabularnewline
22 & 0.156785 & 1.0749 & 0.143961 \tabularnewline
23 & -0.07208 & -0.4942 & 0.68825 \tabularnewline
24 & -0.135326 & -0.9277 & 0.82086 \tabularnewline
25 & 0.042251 & 0.2897 & 0.386676 \tabularnewline
26 & -0.077637 & -0.5323 & 0.701471 \tabularnewline
27 & -0.088189 & -0.6046 & 0.72582 \tabularnewline
28 & -0.045062 & -0.3089 & 0.62063 \tabularnewline
29 & -0.12714 & -0.8716 & 0.806078 \tabularnewline
30 & -0.027305 & -0.1872 & 0.573844 \tabularnewline
31 & -0.116004 & -0.7953 & 0.784776 \tabularnewline
32 & -0.009838 & -0.0674 & 0.526742 \tabularnewline
33 & -0.015512 & -0.1063 & 0.542121 \tabularnewline
34 & 0.069874 & 0.479 & 0.317069 \tabularnewline
35 & -0.026021 & -0.1784 & 0.570407 \tabularnewline
36 & -0.053161 & -0.3645 & 0.641423 \tabularnewline
37 & -0.087522 & -0.6 & 0.724314 \tabularnewline
38 & -0.072691 & -0.4983 & 0.689717 \tabularnewline
39 & 0.08124 & 0.557 & 0.290102 \tabularnewline
40 & 0.052263 & 0.3583 & 0.360864 \tabularnewline
41 & -0.100679 & -0.6902 & 0.753274 \tabularnewline
42 & 0.053949 & 0.3699 & 0.356577 \tabularnewline
43 & -0.036939 & -0.2532 & 0.599407 \tabularnewline
44 & -0.028972 & -0.1986 & 0.578292 \tabularnewline
45 & -0.006596 & -0.0452 & 0.517939 \tabularnewline
46 & NA & NA & NA \tabularnewline
47 & NA & NA & NA \tabularnewline
48 & NA & NA & NA \tabularnewline
49 & NA & NA & NA \tabularnewline
50 & NA & NA & NA \tabularnewline
51 & NA & NA & NA \tabularnewline
52 & NA & NA & NA \tabularnewline
53 & NA & NA & NA \tabularnewline
54 & NA & NA & NA \tabularnewline
55 & NA & NA & NA \tabularnewline
56 & NA & NA & NA \tabularnewline
57 & NA & NA & NA \tabularnewline
58 & NA & NA & NA \tabularnewline
59 & NA & NA & NA \tabularnewline
\hline
\end{tabular}
%Source: https://freestatistics.org/blog/index.php?pk=6495&T=2

[TABLE]
[ROW][C]Partial Autocorrelation Function[/C][/ROW]
[ROW][C]Time lag k[/C][C]PACF(k)[/C][C]T-STAT[/C][C]P-value[/C][/ROW]
[ROW][C]0[/C][C]-0.41033[/C][C]-2.8131[/C][C]0.99643[/C][/ROW]
[ROW][C]1[/C][C]-0.403439[/C][C]-2.7658[/C][C]0.995955[/C][/ROW]
[ROW][C]2[/C][C]-0.298105[/C][C]-2.0437[/C][C]0.976695[/C][/ROW]
[ROW][C]3[/C][C]-0.210134[/C][C]-1.4406[/C][C]0.921838[/C][/ROW]
[ROW][C]4[/C][C]-0.092995[/C][C]-0.6375[/C][C]0.736568[/C][/ROW]
[ROW][C]5[/C][C]-0.004865[/C][C]-0.0334[/C][C]0.513234[/C][/ROW]
[ROW][C]6[/C][C]0.067527[/C][C]0.4629[/C][C]0.322772[/C][/ROW]
[ROW][C]7[/C][C]-0.112938[/C][C]-0.7743[/C][C]0.778674[/C][/ROW]
[ROW][C]8[/C][C]0.013769[/C][C]0.0944[/C][C]0.462598[/C][/ROW]
[ROW][C]9[/C][C]-0.125746[/C][C]-0.8621[/C][C]0.803487[/C][/ROW]
[ROW][C]10[/C][C]0.061225[/C][C]0.4197[/C][C]0.338296[/C][/ROW]
[ROW][C]11[/C][C]-0.128204[/C][C]-0.8789[/C][C]0.808043[/C][/ROW]
[ROW][C]12[/C][C]-0.204306[/C][C]-1.4007[/C][C]0.916057[/C][/ROW]
[ROW][C]13[/C][C]-0.117214[/C][C]-0.8036[/C][C]0.787158[/C][/ROW]
[ROW][C]14[/C][C]-0.176679[/C][C]-1.2112[/C][C]0.884072[/C][/ROW]
[ROW][C]15[/C][C]0.126663[/C][C]0.8684[/C][C]0.194805[/C][/ROW]
[ROW][C]16[/C][C]-0.040349[/C][C]-0.2766[/C][C]0.608358[/C][/ROW]
[ROW][C]17[/C][C]0.013987[/C][C]0.0959[/C][C]0.462008[/C][/ROW]
[ROW][C]18[/C][C]-0.097288[/C][C]-0.667[/C][C]0.745974[/C][/ROW]
[ROW][C]19[/C][C]-0.203602[/C][C]-1.3958[/C][C]0.915337[/C][/ROW]
[ROW][C]20[/C][C]-0.144586[/C][C]-0.9912[/C][C]0.836676[/C][/ROW]
[ROW][C]21[/C][C]-0.064118[/C][C]-0.4396[/C][C]0.668868[/C][/ROW]
[ROW][C]22[/C][C]0.156785[/C][C]1.0749[/C][C]0.143961[/C][/ROW]
[ROW][C]23[/C][C]-0.07208[/C][C]-0.4942[/C][C]0.68825[/C][/ROW]
[ROW][C]24[/C][C]-0.135326[/C][C]-0.9277[/C][C]0.82086[/C][/ROW]
[ROW][C]25[/C][C]0.042251[/C][C]0.2897[/C][C]0.386676[/C][/ROW]
[ROW][C]26[/C][C]-0.077637[/C][C]-0.5323[/C][C]0.701471[/C][/ROW]
[ROW][C]27[/C][C]-0.088189[/C][C]-0.6046[/C][C]0.72582[/C][/ROW]
[ROW][C]28[/C][C]-0.045062[/C][C]-0.3089[/C][C]0.62063[/C][/ROW]
[ROW][C]29[/C][C]-0.12714[/C][C]-0.8716[/C][C]0.806078[/C][/ROW]
[ROW][C]30[/C][C]-0.027305[/C][C]-0.1872[/C][C]0.573844[/C][/ROW]
[ROW][C]31[/C][C]-0.116004[/C][C]-0.7953[/C][C]0.784776[/C][/ROW]
[ROW][C]32[/C][C]-0.009838[/C][C]-0.0674[/C][C]0.526742[/C][/ROW]
[ROW][C]33[/C][C]-0.015512[/C][C]-0.1063[/C][C]0.542121[/C][/ROW]
[ROW][C]34[/C][C]0.069874[/C][C]0.479[/C][C]0.317069[/C][/ROW]
[ROW][C]35[/C][C]-0.026021[/C][C]-0.1784[/C][C]0.570407[/C][/ROW]
[ROW][C]36[/C][C]-0.053161[/C][C]-0.3645[/C][C]0.641423[/C][/ROW]
[ROW][C]37[/C][C]-0.087522[/C][C]-0.6[/C][C]0.724314[/C][/ROW]
[ROW][C]38[/C][C]-0.072691[/C][C]-0.4983[/C][C]0.689717[/C][/ROW]
[ROW][C]39[/C][C]0.08124[/C][C]0.557[/C][C]0.290102[/C][/ROW]
[ROW][C]40[/C][C]0.052263[/C][C]0.3583[/C][C]0.360864[/C][/ROW]
[ROW][C]41[/C][C]-0.100679[/C][C]-0.6902[/C][C]0.753274[/C][/ROW]
[ROW][C]42[/C][C]0.053949[/C][C]0.3699[/C][C]0.356577[/C][/ROW]
[ROW][C]43[/C][C]-0.036939[/C][C]-0.2532[/C][C]0.599407[/C][/ROW]
[ROW][C]44[/C][C]-0.028972[/C][C]-0.1986[/C][C]0.578292[/C][/ROW]
[ROW][C]45[/C][C]-0.006596[/C][C]-0.0452[/C][C]0.517939[/C][/ROW]
[ROW][C]46[/C][C]NA[/C][C]NA[/C][C]NA[/C][/ROW]
[ROW][C]47[/C][C]NA[/C][C]NA[/C][C]NA[/C][/ROW]
[ROW][C]48[/C][C]NA[/C][C]NA[/C][C]NA[/C][/ROW]
[ROW][C]49[/C][C]NA[/C][C]NA[/C][C]NA[/C][/ROW]
[ROW][C]50[/C][C]NA[/C][C]NA[/C][C]NA[/C][/ROW]
[ROW][C]51[/C][C]NA[/C][C]NA[/C][C]NA[/C][/ROW]
[ROW][C]52[/C][C]NA[/C][C]NA[/C][C]NA[/C][/ROW]
[ROW][C]53[/C][C]NA[/C][C]NA[/C][C]NA[/C][/ROW]
[ROW][C]54[/C][C]NA[/C][C]NA[/C][C]NA[/C][/ROW]
[ROW][C]55[/C][C]NA[/C][C]NA[/C][C]NA[/C][/ROW]
[ROW][C]56[/C][C]NA[/C][C]NA[/C][C]NA[/C][/ROW]
[ROW][C]57[/C][C]NA[/C][C]NA[/C][C]NA[/C][/ROW]
[ROW][C]58[/C][C]NA[/C][C]NA[/C][C]NA[/C][/ROW]
[ROW][C]59[/C][C]NA[/C][C]NA[/C][C]NA[/C][/ROW]
[/TABLE]
Source: https://freestatistics.org/blog/index.php?pk=6495&T=2

Globally Unique Identifier (entire table): ba.freestatistics.org/blog/index.php?pk=6495&T=2

As an alternative you can also use a QR Code:  

The GUIDs for individual cells are displayed in the table below:

Partial Autocorrelation Function
Time lag kPACF(k)T-STATP-value
0-0.41033-2.81310.99643
1-0.403439-2.76580.995955
2-0.298105-2.04370.976695
3-0.210134-1.44060.921838
4-0.092995-0.63750.736568
5-0.004865-0.03340.513234
60.0675270.46290.322772
7-0.112938-0.77430.778674
80.0137690.09440.462598
9-0.125746-0.86210.803487
100.0612250.41970.338296
11-0.128204-0.87890.808043
12-0.204306-1.40070.916057
13-0.117214-0.80360.787158
14-0.176679-1.21120.884072
150.1266630.86840.194805
16-0.040349-0.27660.608358
170.0139870.09590.462008
18-0.097288-0.6670.745974
19-0.203602-1.39580.915337
20-0.144586-0.99120.836676
21-0.064118-0.43960.668868
220.1567851.07490.143961
23-0.07208-0.49420.68825
24-0.135326-0.92770.82086
250.0422510.28970.386676
26-0.077637-0.53230.701471
27-0.088189-0.60460.72582
28-0.045062-0.30890.62063
29-0.12714-0.87160.806078
30-0.027305-0.18720.573844
31-0.116004-0.79530.784776
32-0.009838-0.06740.526742
33-0.015512-0.10630.542121
340.0698740.4790.317069
35-0.026021-0.17840.570407
36-0.053161-0.36450.641423
37-0.087522-0.60.724314
38-0.072691-0.49830.689717
390.081240.5570.290102
400.0522630.35830.360864
41-0.100679-0.69020.753274
420.0539490.36990.356577
43-0.036939-0.25320.599407
44-0.028972-0.19860.578292
45-0.006596-0.04520.517939
46NANANA
47NANANA
48NANANA
49NANANA
50NANANA
51NANANA
52NANANA
53NANANA
54NANANA
55NANANA
56NANANA
57NANANA
58NANANA
59NANANA


Parameters (Session):
par1 = 60 ; par2 = 1 ; par3 = 1 ; par4 = 1 ; par5 = 12 ;
Parameters (R input):
par1 = 60 ; par2 = 1 ; par3 = 1 ; par4 = 1 ; par5 = 12 ;
R code (references can be found in the software module):
if (par1 == 'Default') {
par1 = 10*log10(length(x))
} else {
par1 <- as.numeric(par1)
}
par2 <- as.numeric(par2)
par3 <- as.numeric(par3)
par4 <- as.numeric(par4)
par5 <- as.numeric(par5)
if (par2 == 0) {
x <- log(x)
} else {
x <- (x ^ par2 - 1) / par2
}
if (par3 > 0) x <- diff(x,lag=1,difference=par3)
if (par4 > 0) x <- diff(x,lag=par5,difference=par4)
bitmap(file='pic1.png')
racf <- acf(x,par1,main='Autocorrelation',xlab='lags',ylab='ACF')
dev.off()
bitmap(file='pic2.png')
rpacf <- pacf(x,par1,main='Partial Autocorrelation',xlab='lags',ylab='PACF')
dev.off()
(myacf <- c(racf$acf))
(mypacf <- c(rpacf$acf))
lengthx <- length(x)
sqrtn <- sqrt(lengthx)
load(file='createtable')
a<-table.start()
a<-table.row.start(a)
a<-table.element(a,'Autocorrelation Function',4,TRUE)
a<-table.row.end(a)
a<-table.row.start(a)
a<-table.element(a,'Time lag k',header=TRUE)
a<-table.element(a,hyperlink('basics.htm','ACF(k)','click here for more information about the Autocorrelation Function'),header=TRUE)
a<-table.element(a,'T-STAT',header=TRUE)
a<-table.element(a,'P-value',header=TRUE)
a<-table.row.end(a)
for (i in 1:par1) {
a<-table.row.start(a)
a<-table.element(a,i-1,header=TRUE)
a<-table.element(a,round(myacf[i],6))
mytstat <- myacf[i]*sqrtn
a<-table.element(a,round(mytstat,4))
a<-table.element(a,round(1-pt(mytstat,lengthx),6))
a<-table.row.end(a)
}
a<-table.end(a)
table.save(a,file='mytable.tab')
a<-table.start()
a<-table.row.start(a)
a<-table.element(a,'Partial Autocorrelation Function',4,TRUE)
a<-table.row.end(a)
a<-table.row.start(a)
a<-table.element(a,'Time lag k',header=TRUE)
a<-table.element(a,hyperlink('basics.htm','PACF(k)','click here for more information about the Partial Autocorrelation Function'),header=TRUE)
a<-table.element(a,'T-STAT',header=TRUE)
a<-table.element(a,'P-value',header=TRUE)
a<-table.row.end(a)
for (i in 1:par1) {
a<-table.row.start(a)
a<-table.element(a,i-1,header=TRUE)
a<-table.element(a,round(mypacf[i],6))
mytstat <- mypacf[i]*sqrtn
a<-table.element(a,round(mytstat,4))
a<-table.element(a,round(1-pt(mytstat,lengthx),6))
a<-table.row.end(a)
}
a<-table.end(a)
table.save(a,file='mytable1.tab')