Free Statistics

of Irreproducible Research!

Author's title

Author*Unverified author*
R Software Modulerwasp_autocorrelation.wasp
Title produced by software(Partial) Autocorrelation Function
Date of computationSun, 25 Nov 2007 05:01:06 -0700
Cite this page as followsStatistical Computations at FreeStatistics.org, Office for Research Development and Education, URL https://freestatistics.org/blog/index.php?v=date/2007/Nov/25/t1195991522v62e6gm9oy60z45.htm/, Retrieved Sat, 04 May 2024 08:37:53 +0000
Statistical Computations at FreeStatistics.org, Office for Research Development and Education, URL https://freestatistics.org/blog/index.php?pk=6413, Retrieved Sat, 04 May 2024 08:37:53 +0000
QR Codes:

Original text written by user:
IsPrivate?No (this computation is public)
User-defined keywords
Estimated Impact255
Family? (F = Feedback message, R = changed R code, M = changed R Module, P = changed Parameters, D = changed Data)
-       [(Partial) Autocorrelation Function] [Autocorrelation f...] [2007-11-25 12:01:06] [9fe578921d87f9af8e79a90d6142ba02] [Current]
Feedback Forum

Post a new message
Dataseries X:
8.1
8.2
8
8.1
8.3
8.2
8.1
7.7
7.6
7.7
8.2
8.4
8.4
8.6
8.4
8.5
8.7
8.7
8.6
7.4
7.3
7.4
9
9.2
9.2
8.5
8.3
8.3
8.6
8.6
8.5
8.1
8.1
8
8.6
8.7
8.7
8.6
8.4
8.4
8.7
8.7
8.5
8.3
8.3
8.3
8.1
8.2
8.1
8.1
7.9
7.7
8.1
8
7.7
7.8
7.6
7.4
7.7
7.9
7.6


Summary of compuational transaction
Raw Inputview raw input (R code)
Raw Outputview raw output of R engine
Computing time2 seconds
R Server'Gwilym Jenkins' @ 72.249.127.135

\begin{tabular}{lllllllll}
\hline
Summary of compuational transaction \tabularnewline
Raw Input & view raw input (R code)  \tabularnewline
Raw Output & view raw output of R engine  \tabularnewline
Computing time & 2 seconds \tabularnewline
R Server & 'Gwilym Jenkins' @ 72.249.127.135 \tabularnewline
\hline
\end{tabular}
%Source: https://freestatistics.org/blog/index.php?pk=6413&T=0

[TABLE]
[ROW][C]Summary of compuational transaction[/C][/ROW]
[ROW][C]Raw Input[/C][C]view raw input (R code) [/C][/ROW]
[ROW][C]Raw Output[/C][C]view raw output of R engine [/C][/ROW]
[ROW][C]Computing time[/C][C]2 seconds[/C][/ROW]
[ROW][C]R Server[/C][C]'Gwilym Jenkins' @ 72.249.127.135[/C][/ROW]
[/TABLE]
Source: https://freestatistics.org/blog/index.php?pk=6413&T=0

Globally Unique Identifier (entire table): ba.freestatistics.org/blog/index.php?pk=6413&T=0

As an alternative you can also use a QR Code:  

The GUIDs for individual cells are displayed in the table below:

Summary of compuational transaction
Raw Inputview raw input (R code)
Raw Outputview raw output of R engine
Computing time2 seconds
R Server'Gwilym Jenkins' @ 72.249.127.135


Autocorrelation Function
Time lag kACF(k)T-STATP-value
017.7460
10.1375911.06580.145397
2-0.1398-1.08290.858404
3-0.577423-4.47270.999982
4-0.19549-1.51430.932395
50.0735310.56960.285549
60.3538062.74060.004034
70.1193780.92470.179415
8-0.167937-1.30080.900856
9-0.326849-2.53180.993007
10-0.075981-0.58850.720813
110.124420.96380.169519
120.4729523.66350.000264
130.1257310.97390.167006
14-0.06876-0.53260.701866
15-0.354744-2.74780.996044
16-0.186534-1.44490.923154

\begin{tabular}{lllllllll}
\hline
Autocorrelation Function \tabularnewline
Time lag k & ACF(k) & T-STAT & P-value \tabularnewline
0 & 1 & 7.746 & 0 \tabularnewline
1 & 0.137591 & 1.0658 & 0.145397 \tabularnewline
2 & -0.1398 & -1.0829 & 0.858404 \tabularnewline
3 & -0.577423 & -4.4727 & 0.999982 \tabularnewline
4 & -0.19549 & -1.5143 & 0.932395 \tabularnewline
5 & 0.073531 & 0.5696 & 0.285549 \tabularnewline
6 & 0.353806 & 2.7406 & 0.004034 \tabularnewline
7 & 0.119378 & 0.9247 & 0.179415 \tabularnewline
8 & -0.167937 & -1.3008 & 0.900856 \tabularnewline
9 & -0.326849 & -2.5318 & 0.993007 \tabularnewline
10 & -0.075981 & -0.5885 & 0.720813 \tabularnewline
11 & 0.12442 & 0.9638 & 0.169519 \tabularnewline
12 & 0.472952 & 3.6635 & 0.000264 \tabularnewline
13 & 0.125731 & 0.9739 & 0.167006 \tabularnewline
14 & -0.06876 & -0.5326 & 0.701866 \tabularnewline
15 & -0.354744 & -2.7478 & 0.996044 \tabularnewline
16 & -0.186534 & -1.4449 & 0.923154 \tabularnewline
\hline
\end{tabular}
%Source: https://freestatistics.org/blog/index.php?pk=6413&T=1

[TABLE]
[ROW][C]Autocorrelation Function[/C][/ROW]
[ROW][C]Time lag k[/C][C]ACF(k)[/C][C]T-STAT[/C][C]P-value[/C][/ROW]
[ROW][C]0[/C][C]1[/C][C]7.746[/C][C]0[/C][/ROW]
[ROW][C]1[/C][C]0.137591[/C][C]1.0658[/C][C]0.145397[/C][/ROW]
[ROW][C]2[/C][C]-0.1398[/C][C]-1.0829[/C][C]0.858404[/C][/ROW]
[ROW][C]3[/C][C]-0.577423[/C][C]-4.4727[/C][C]0.999982[/C][/ROW]
[ROW][C]4[/C][C]-0.19549[/C][C]-1.5143[/C][C]0.932395[/C][/ROW]
[ROW][C]5[/C][C]0.073531[/C][C]0.5696[/C][C]0.285549[/C][/ROW]
[ROW][C]6[/C][C]0.353806[/C][C]2.7406[/C][C]0.004034[/C][/ROW]
[ROW][C]7[/C][C]0.119378[/C][C]0.9247[/C][C]0.179415[/C][/ROW]
[ROW][C]8[/C][C]-0.167937[/C][C]-1.3008[/C][C]0.900856[/C][/ROW]
[ROW][C]9[/C][C]-0.326849[/C][C]-2.5318[/C][C]0.993007[/C][/ROW]
[ROW][C]10[/C][C]-0.075981[/C][C]-0.5885[/C][C]0.720813[/C][/ROW]
[ROW][C]11[/C][C]0.12442[/C][C]0.9638[/C][C]0.169519[/C][/ROW]
[ROW][C]12[/C][C]0.472952[/C][C]3.6635[/C][C]0.000264[/C][/ROW]
[ROW][C]13[/C][C]0.125731[/C][C]0.9739[/C][C]0.167006[/C][/ROW]
[ROW][C]14[/C][C]-0.06876[/C][C]-0.5326[/C][C]0.701866[/C][/ROW]
[ROW][C]15[/C][C]-0.354744[/C][C]-2.7478[/C][C]0.996044[/C][/ROW]
[ROW][C]16[/C][C]-0.186534[/C][C]-1.4449[/C][C]0.923154[/C][/ROW]
[/TABLE]
Source: https://freestatistics.org/blog/index.php?pk=6413&T=1

Globally Unique Identifier (entire table): ba.freestatistics.org/blog/index.php?pk=6413&T=1

As an alternative you can also use a QR Code:  

The GUIDs for individual cells are displayed in the table below:

Autocorrelation Function
Time lag kACF(k)T-STATP-value
017.7460
10.1375911.06580.145397
2-0.1398-1.08290.858404
3-0.577423-4.47270.999982
4-0.19549-1.51430.932395
50.0735310.56960.285549
60.3538062.74060.004034
70.1193780.92470.179415
8-0.167937-1.30080.900856
9-0.326849-2.53180.993007
10-0.075981-0.58850.720813
110.124420.96380.169519
120.4729523.66350.000264
130.1257310.97390.167006
14-0.06876-0.53260.701866
15-0.354744-2.74780.996044
16-0.186534-1.44490.923154


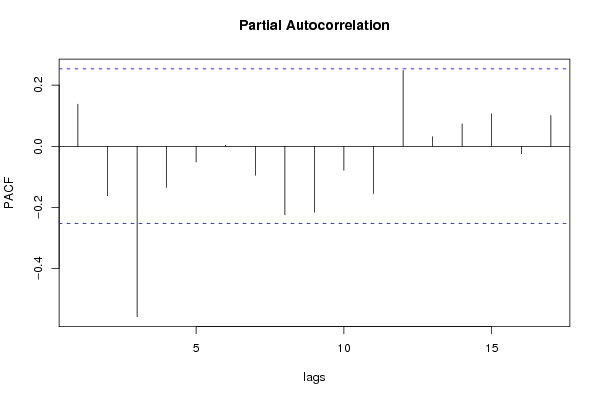
Partial Autocorrelation Function
Time lag kPACF(k)T-STATP-value
00.1375911.06580.145397
1-0.161794-1.25330.892512
2-0.557695-4.31990.99997
3-0.13477-1.04390.849646
4-0.051469-0.39870.654226
50.0034660.02680.489336
6-0.095014-0.7360.767694
7-0.224291-1.73740.956272
8-0.215704-1.67080.950019
9-0.078475-0.60790.727215
10-0.154817-1.19920.882419
110.2481661.92230.029661
120.0311970.24170.404936
130.0729470.5650.287076
140.1061810.82250.207032
15-0.024499-0.18980.574935
160.100530.77870.219608

\begin{tabular}{lllllllll}
\hline
Partial Autocorrelation Function \tabularnewline
Time lag k & PACF(k) & T-STAT & P-value \tabularnewline
0 & 0.137591 & 1.0658 & 0.145397 \tabularnewline
1 & -0.161794 & -1.2533 & 0.892512 \tabularnewline
2 & -0.557695 & -4.3199 & 0.99997 \tabularnewline
3 & -0.13477 & -1.0439 & 0.849646 \tabularnewline
4 & -0.051469 & -0.3987 & 0.654226 \tabularnewline
5 & 0.003466 & 0.0268 & 0.489336 \tabularnewline
6 & -0.095014 & -0.736 & 0.767694 \tabularnewline
7 & -0.224291 & -1.7374 & 0.956272 \tabularnewline
8 & -0.215704 & -1.6708 & 0.950019 \tabularnewline
9 & -0.078475 & -0.6079 & 0.727215 \tabularnewline
10 & -0.154817 & -1.1992 & 0.882419 \tabularnewline
11 & 0.248166 & 1.9223 & 0.029661 \tabularnewline
12 & 0.031197 & 0.2417 & 0.404936 \tabularnewline
13 & 0.072947 & 0.565 & 0.287076 \tabularnewline
14 & 0.106181 & 0.8225 & 0.207032 \tabularnewline
15 & -0.024499 & -0.1898 & 0.574935 \tabularnewline
16 & 0.10053 & 0.7787 & 0.219608 \tabularnewline
\hline
\end{tabular}
%Source: https://freestatistics.org/blog/index.php?pk=6413&T=2

[TABLE]
[ROW][C]Partial Autocorrelation Function[/C][/ROW]
[ROW][C]Time lag k[/C][C]PACF(k)[/C][C]T-STAT[/C][C]P-value[/C][/ROW]
[ROW][C]0[/C][C]0.137591[/C][C]1.0658[/C][C]0.145397[/C][/ROW]
[ROW][C]1[/C][C]-0.161794[/C][C]-1.2533[/C][C]0.892512[/C][/ROW]
[ROW][C]2[/C][C]-0.557695[/C][C]-4.3199[/C][C]0.99997[/C][/ROW]
[ROW][C]3[/C][C]-0.13477[/C][C]-1.0439[/C][C]0.849646[/C][/ROW]
[ROW][C]4[/C][C]-0.051469[/C][C]-0.3987[/C][C]0.654226[/C][/ROW]
[ROW][C]5[/C][C]0.003466[/C][C]0.0268[/C][C]0.489336[/C][/ROW]
[ROW][C]6[/C][C]-0.095014[/C][C]-0.736[/C][C]0.767694[/C][/ROW]
[ROW][C]7[/C][C]-0.224291[/C][C]-1.7374[/C][C]0.956272[/C][/ROW]
[ROW][C]8[/C][C]-0.215704[/C][C]-1.6708[/C][C]0.950019[/C][/ROW]
[ROW][C]9[/C][C]-0.078475[/C][C]-0.6079[/C][C]0.727215[/C][/ROW]
[ROW][C]10[/C][C]-0.154817[/C][C]-1.1992[/C][C]0.882419[/C][/ROW]
[ROW][C]11[/C][C]0.248166[/C][C]1.9223[/C][C]0.029661[/C][/ROW]
[ROW][C]12[/C][C]0.031197[/C][C]0.2417[/C][C]0.404936[/C][/ROW]
[ROW][C]13[/C][C]0.072947[/C][C]0.565[/C][C]0.287076[/C][/ROW]
[ROW][C]14[/C][C]0.106181[/C][C]0.8225[/C][C]0.207032[/C][/ROW]
[ROW][C]15[/C][C]-0.024499[/C][C]-0.1898[/C][C]0.574935[/C][/ROW]
[ROW][C]16[/C][C]0.10053[/C][C]0.7787[/C][C]0.219608[/C][/ROW]
[/TABLE]
Source: https://freestatistics.org/blog/index.php?pk=6413&T=2

Globally Unique Identifier (entire table): ba.freestatistics.org/blog/index.php?pk=6413&T=2

As an alternative you can also use a QR Code:  

The GUIDs for individual cells are displayed in the table below:

Partial Autocorrelation Function
Time lag kPACF(k)T-STATP-value
00.1375911.06580.145397
1-0.161794-1.25330.892512
2-0.557695-4.31990.99997
3-0.13477-1.04390.849646
4-0.051469-0.39870.654226
50.0034660.02680.489336
6-0.095014-0.7360.767694
7-0.224291-1.73740.956272
8-0.215704-1.67080.950019
9-0.078475-0.60790.727215
10-0.154817-1.19920.882419
110.2481661.92230.029661
120.0311970.24170.404936
130.0729470.5650.287076
140.1061810.82250.207032
15-0.024499-0.18980.574935
160.100530.77870.219608


Parameters (Session):
par1 = Default ; par2 = 1 ; par3 = 1 ; par4 = 1 ; par5 = 12 ;
Parameters (R input):
par1 = Default ; par2 = 1 ; par3 = 1 ; par4 = 0 ; par5 = 12 ;
R code (references can be found in the software module):
if (par1 == 'Default') {
par1 = 10*log10(length(x))
} else {
par1 <- as.numeric(par1)
}
par2 <- as.numeric(par2)
par3 <- as.numeric(par3)
par4 <- as.numeric(par4)
par5 <- as.numeric(par5)
if (par2 == 0) {
x <- log(x)
} else {
x <- (x ^ par2 - 1) / par2
}
if (par3 > 0) x <- diff(x,lag=1,difference=par3)
if (par4 > 0) x <- diff(x,lag=par5,difference=par4)
bitmap(file='pic1.png')
racf <- acf(x,par1,main='Autocorrelation',xlab='lags',ylab='ACF')
dev.off()
bitmap(file='pic2.png')
rpacf <- pacf(x,par1,main='Partial Autocorrelation',xlab='lags',ylab='PACF')
dev.off()
(myacf <- c(racf$acf))
(mypacf <- c(rpacf$acf))
lengthx <- length(x)
sqrtn <- sqrt(lengthx)
load(file='createtable')
a<-table.start()
a<-table.row.start(a)
a<-table.element(a,'Autocorrelation Function',4,TRUE)
a<-table.row.end(a)
a<-table.row.start(a)
a<-table.element(a,'Time lag k',header=TRUE)
a<-table.element(a,hyperlink('basics.htm','ACF(k)','click here for more information about the Autocorrelation Function'),header=TRUE)
a<-table.element(a,'T-STAT',header=TRUE)
a<-table.element(a,'P-value',header=TRUE)
a<-table.row.end(a)
for (i in 1:par1) {
a<-table.row.start(a)
a<-table.element(a,i-1,header=TRUE)
a<-table.element(a,round(myacf[i],6))
mytstat <- myacf[i]*sqrtn
a<-table.element(a,round(mytstat,4))
a<-table.element(a,round(1-pt(mytstat,lengthx),6))
a<-table.row.end(a)
}
a<-table.end(a)
table.save(a,file='mytable.tab')
a<-table.start()
a<-table.row.start(a)
a<-table.element(a,'Partial Autocorrelation Function',4,TRUE)
a<-table.row.end(a)
a<-table.row.start(a)
a<-table.element(a,'Time lag k',header=TRUE)
a<-table.element(a,hyperlink('basics.htm','PACF(k)','click here for more information about the Partial Autocorrelation Function'),header=TRUE)
a<-table.element(a,'T-STAT',header=TRUE)
a<-table.element(a,'P-value',header=TRUE)
a<-table.row.end(a)
for (i in 1:par1) {
a<-table.row.start(a)
a<-table.element(a,i-1,header=TRUE)
a<-table.element(a,round(mypacf[i],6))
mytstat <- mypacf[i]*sqrtn
a<-table.element(a,round(mytstat,4))
a<-table.element(a,round(1-pt(mytstat,lengthx),6))
a<-table.row.end(a)
}
a<-table.end(a)
table.save(a,file='mytable1.tab')