Free Statistics

of Irreproducible Research!

Author's title

Author*Unverified author*
R Software Modulerwasp_autocorrelation.wasp
Title produced by software(Partial) Autocorrelation Function
Date of computationFri, 23 Nov 2007 09:45:33 -0700
Cite this page as followsStatistical Computations at FreeStatistics.org, Office for Research Development and Education, URL https://freestatistics.org/blog/index.php?v=date/2007/Nov/23/t1195835846awxcivti1ppqzqm.htm/, Retrieved Mon, 29 Apr 2024 06:44:54 +0000
Statistical Computations at FreeStatistics.org, Office for Research Development and Education, URL https://freestatistics.org/blog/index.php?pk=6228, Retrieved Mon, 29 Apr 2024 06:44:54 +0000
QR Codes:

Original text written by user:
IsPrivate?No (this computation is public)
User-defined keywords
Estimated Impact168
Family? (F = Feedback message, R = changed R code, M = changed R Module, P = changed Parameters, D = changed Data)
-       [(Partial) Autocorrelation Function] [autocorrelatie we...] [2007-11-23 16:45:33] [bd02e85be52eb1cb060a2c60779eb820] [Current]
Feedback Forum

Post a new message
Dataseries X:
467037
460070
447988
442867
436087
431328
484015
509673
512927
502831
470984
471067
476049
474605
470439
461251
454724
455626
516847
525192
522975
518585
509239
512238
519164
517009
509933
509127
500857
506971
569323
579714
577992
565464
547344
554788
562325
560854
555332
543599
536662
542722
593530
610763
612613
611324
594167
595454
590865
589379
584428
573100
567456
569028
620735
628884
628232
612117
595404
597141
593408
590072
579799
574205
572775
572942
619567
625809
619916
587625
565742
557274


Summary of compuational transaction
Raw Inputview raw input (R code)
Raw Outputview raw output of R engine
Computing time1 seconds
R Server'Gwilym Jenkins' @ 72.249.127.135

\begin{tabular}{lllllllll}
\hline
Summary of compuational transaction \tabularnewline
Raw Input & view raw input (R code)  \tabularnewline
Raw Output & view raw output of R engine  \tabularnewline
Computing time & 1 seconds \tabularnewline
R Server & 'Gwilym Jenkins' @ 72.249.127.135 \tabularnewline
\hline
\end{tabular}
%Source: https://freestatistics.org/blog/index.php?pk=6228&T=0

[TABLE]
[ROW][C]Summary of compuational transaction[/C][/ROW]
[ROW][C]Raw Input[/C][C]view raw input (R code) [/C][/ROW]
[ROW][C]Raw Output[/C][C]view raw output of R engine [/C][/ROW]
[ROW][C]Computing time[/C][C]1 seconds[/C][/ROW]
[ROW][C]R Server[/C][C]'Gwilym Jenkins' @ 72.249.127.135[/C][/ROW]
[/TABLE]
Source: https://freestatistics.org/blog/index.php?pk=6228&T=0

Globally Unique Identifier (entire table): ba.freestatistics.org/blog/index.php?pk=6228&T=0

As an alternative you can also use a QR Code:  

The GUIDs for individual cells are displayed in the table below:

Summary of compuational transaction
Raw Inputview raw input (R code)
Raw Outputview raw output of R engine
Computing time1 seconds
R Server'Gwilym Jenkins' @ 72.249.127.135


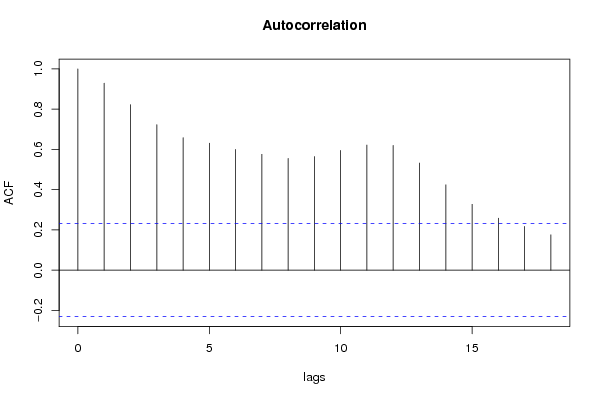
Autocorrelation Function
Time lag kACF(k)T-STATP-value
018.48530
10.9291257.88390
20.8223126.97760
30.7228146.13330
40.6584885.58750
50.6310275.35440
60.6002775.09351e-06
70.576114.88853e-06
80.5551754.71086e-06
90.5646384.79114e-06
100.5948925.04782e-06
110.622065.27841e-06
120.6198985.261e-06
130.5324184.51771.2e-05
140.4244753.60180.000289
150.3272172.77650.003499
160.2584872.19330.015757
170.2174571.84520.034561

\begin{tabular}{lllllllll}
\hline
Autocorrelation Function \tabularnewline
Time lag k & ACF(k) & T-STAT & P-value \tabularnewline
0 & 1 & 8.4853 & 0 \tabularnewline
1 & 0.929125 & 7.8839 & 0 \tabularnewline
2 & 0.822312 & 6.9776 & 0 \tabularnewline
3 & 0.722814 & 6.1333 & 0 \tabularnewline
4 & 0.658488 & 5.5875 & 0 \tabularnewline
5 & 0.631027 & 5.3544 & 0 \tabularnewline
6 & 0.600277 & 5.0935 & 1e-06 \tabularnewline
7 & 0.57611 & 4.8885 & 3e-06 \tabularnewline
8 & 0.555175 & 4.7108 & 6e-06 \tabularnewline
9 & 0.564638 & 4.7911 & 4e-06 \tabularnewline
10 & 0.594892 & 5.0478 & 2e-06 \tabularnewline
11 & 0.62206 & 5.2784 & 1e-06 \tabularnewline
12 & 0.619898 & 5.26 & 1e-06 \tabularnewline
13 & 0.532418 & 4.5177 & 1.2e-05 \tabularnewline
14 & 0.424475 & 3.6018 & 0.000289 \tabularnewline
15 & 0.327217 & 2.7765 & 0.003499 \tabularnewline
16 & 0.258487 & 2.1933 & 0.015757 \tabularnewline
17 & 0.217457 & 1.8452 & 0.034561 \tabularnewline
\hline
\end{tabular}
%Source: https://freestatistics.org/blog/index.php?pk=6228&T=1

[TABLE]
[ROW][C]Autocorrelation Function[/C][/ROW]
[ROW][C]Time lag k[/C][C]ACF(k)[/C][C]T-STAT[/C][C]P-value[/C][/ROW]
[ROW][C]0[/C][C]1[/C][C]8.4853[/C][C]0[/C][/ROW]
[ROW][C]1[/C][C]0.929125[/C][C]7.8839[/C][C]0[/C][/ROW]
[ROW][C]2[/C][C]0.822312[/C][C]6.9776[/C][C]0[/C][/ROW]
[ROW][C]3[/C][C]0.722814[/C][C]6.1333[/C][C]0[/C][/ROW]
[ROW][C]4[/C][C]0.658488[/C][C]5.5875[/C][C]0[/C][/ROW]
[ROW][C]5[/C][C]0.631027[/C][C]5.3544[/C][C]0[/C][/ROW]
[ROW][C]6[/C][C]0.600277[/C][C]5.0935[/C][C]1e-06[/C][/ROW]
[ROW][C]7[/C][C]0.57611[/C][C]4.8885[/C][C]3e-06[/C][/ROW]
[ROW][C]8[/C][C]0.555175[/C][C]4.7108[/C][C]6e-06[/C][/ROW]
[ROW][C]9[/C][C]0.564638[/C][C]4.7911[/C][C]4e-06[/C][/ROW]
[ROW][C]10[/C][C]0.594892[/C][C]5.0478[/C][C]2e-06[/C][/ROW]
[ROW][C]11[/C][C]0.62206[/C][C]5.2784[/C][C]1e-06[/C][/ROW]
[ROW][C]12[/C][C]0.619898[/C][C]5.26[/C][C]1e-06[/C][/ROW]
[ROW][C]13[/C][C]0.532418[/C][C]4.5177[/C][C]1.2e-05[/C][/ROW]
[ROW][C]14[/C][C]0.424475[/C][C]3.6018[/C][C]0.000289[/C][/ROW]
[ROW][C]15[/C][C]0.327217[/C][C]2.7765[/C][C]0.003499[/C][/ROW]
[ROW][C]16[/C][C]0.258487[/C][C]2.1933[/C][C]0.015757[/C][/ROW]
[ROW][C]17[/C][C]0.217457[/C][C]1.8452[/C][C]0.034561[/C][/ROW]
[/TABLE]
Source: https://freestatistics.org/blog/index.php?pk=6228&T=1

Globally Unique Identifier (entire table): ba.freestatistics.org/blog/index.php?pk=6228&T=1

As an alternative you can also use a QR Code:  

The GUIDs for individual cells are displayed in the table below:

Autocorrelation Function
Time lag kACF(k)T-STATP-value
018.48530
10.9291257.88390
20.8223126.97760
30.7228146.13330
40.6584885.58750
50.6310275.35440
60.6002775.09351e-06
70.576114.88853e-06
80.5551754.71086e-06
90.5646384.79114e-06
100.5948925.04782e-06
110.622065.27841e-06
120.6198985.261e-06
130.5324184.51771.2e-05
140.4244753.60180.000289
150.3272172.77650.003499
160.2584872.19330.015757
170.2174571.84520.034561


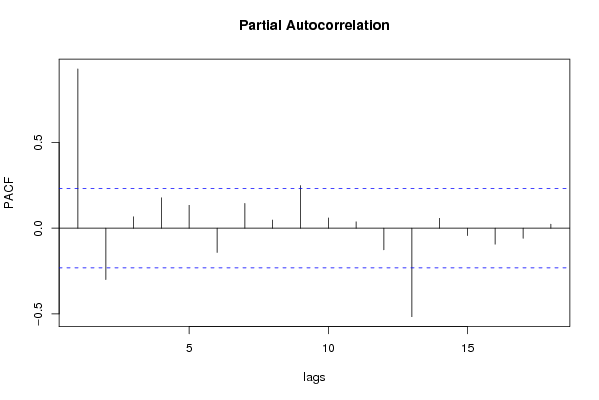
Partial Autocorrelation Function
Time lag kPACF(k)T-STATP-value
00.9291257.88390
1-0.299591-2.54210.993415
20.0662340.5620.287926
30.177091.50270.06865
40.1338531.13580.129907
5-0.141375-1.19960.882887
60.1443331.22470.112339
70.0475320.40330.343953
80.2490872.11360.019009
90.0600250.50930.306041
100.0375960.3190.375322
11-0.126236-1.07110.85616
12-0.515954-4.3780.99998
130.0580240.49240.311984
14-0.042816-0.36330.641278
15-0.093334-0.7920.784509
16-0.059197-0.50230.691507
170.023220.1970.422181

\begin{tabular}{lllllllll}
\hline
Partial Autocorrelation Function \tabularnewline
Time lag k & PACF(k) & T-STAT & P-value \tabularnewline
0 & 0.929125 & 7.8839 & 0 \tabularnewline
1 & -0.299591 & -2.5421 & 0.993415 \tabularnewline
2 & 0.066234 & 0.562 & 0.287926 \tabularnewline
3 & 0.17709 & 1.5027 & 0.06865 \tabularnewline
4 & 0.133853 & 1.1358 & 0.129907 \tabularnewline
5 & -0.141375 & -1.1996 & 0.882887 \tabularnewline
6 & 0.144333 & 1.2247 & 0.112339 \tabularnewline
7 & 0.047532 & 0.4033 & 0.343953 \tabularnewline
8 & 0.249087 & 2.1136 & 0.019009 \tabularnewline
9 & 0.060025 & 0.5093 & 0.306041 \tabularnewline
10 & 0.037596 & 0.319 & 0.375322 \tabularnewline
11 & -0.126236 & -1.0711 & 0.85616 \tabularnewline
12 & -0.515954 & -4.378 & 0.99998 \tabularnewline
13 & 0.058024 & 0.4924 & 0.311984 \tabularnewline
14 & -0.042816 & -0.3633 & 0.641278 \tabularnewline
15 & -0.093334 & -0.792 & 0.784509 \tabularnewline
16 & -0.059197 & -0.5023 & 0.691507 \tabularnewline
17 & 0.02322 & 0.197 & 0.422181 \tabularnewline
\hline
\end{tabular}
%Source: https://freestatistics.org/blog/index.php?pk=6228&T=2

[TABLE]
[ROW][C]Partial Autocorrelation Function[/C][/ROW]
[ROW][C]Time lag k[/C][C]PACF(k)[/C][C]T-STAT[/C][C]P-value[/C][/ROW]
[ROW][C]0[/C][C]0.929125[/C][C]7.8839[/C][C]0[/C][/ROW]
[ROW][C]1[/C][C]-0.299591[/C][C]-2.5421[/C][C]0.993415[/C][/ROW]
[ROW][C]2[/C][C]0.066234[/C][C]0.562[/C][C]0.287926[/C][/ROW]
[ROW][C]3[/C][C]0.17709[/C][C]1.5027[/C][C]0.06865[/C][/ROW]
[ROW][C]4[/C][C]0.133853[/C][C]1.1358[/C][C]0.129907[/C][/ROW]
[ROW][C]5[/C][C]-0.141375[/C][C]-1.1996[/C][C]0.882887[/C][/ROW]
[ROW][C]6[/C][C]0.144333[/C][C]1.2247[/C][C]0.112339[/C][/ROW]
[ROW][C]7[/C][C]0.047532[/C][C]0.4033[/C][C]0.343953[/C][/ROW]
[ROW][C]8[/C][C]0.249087[/C][C]2.1136[/C][C]0.019009[/C][/ROW]
[ROW][C]9[/C][C]0.060025[/C][C]0.5093[/C][C]0.306041[/C][/ROW]
[ROW][C]10[/C][C]0.037596[/C][C]0.319[/C][C]0.375322[/C][/ROW]
[ROW][C]11[/C][C]-0.126236[/C][C]-1.0711[/C][C]0.85616[/C][/ROW]
[ROW][C]12[/C][C]-0.515954[/C][C]-4.378[/C][C]0.99998[/C][/ROW]
[ROW][C]13[/C][C]0.058024[/C][C]0.4924[/C][C]0.311984[/C][/ROW]
[ROW][C]14[/C][C]-0.042816[/C][C]-0.3633[/C][C]0.641278[/C][/ROW]
[ROW][C]15[/C][C]-0.093334[/C][C]-0.792[/C][C]0.784509[/C][/ROW]
[ROW][C]16[/C][C]-0.059197[/C][C]-0.5023[/C][C]0.691507[/C][/ROW]
[ROW][C]17[/C][C]0.02322[/C][C]0.197[/C][C]0.422181[/C][/ROW]
[/TABLE]
Source: https://freestatistics.org/blog/index.php?pk=6228&T=2

Globally Unique Identifier (entire table): ba.freestatistics.org/blog/index.php?pk=6228&T=2

As an alternative you can also use a QR Code:  

The GUIDs for individual cells are displayed in the table below:

Partial Autocorrelation Function
Time lag kPACF(k)T-STATP-value
00.9291257.88390
1-0.299591-2.54210.993415
20.0662340.5620.287926
30.177091.50270.06865
40.1338531.13580.129907
5-0.141375-1.19960.882887
60.1443331.22470.112339
70.0475320.40330.343953
80.2490872.11360.019009
90.0600250.50930.306041
100.0375960.3190.375322
11-0.126236-1.07110.85616
12-0.515954-4.3780.99998
130.0580240.49240.311984
14-0.042816-0.36330.641278
15-0.093334-0.7920.784509
16-0.059197-0.50230.691507
170.023220.1970.422181


Parameters (Session):
par1 = Default ; par2 = 1 ; par3 = 0 ; par4 = 0 ; par5 = 12 ;
Parameters (R input):
par1 = Default ; par2 = 1 ; par3 = 0 ; par4 = 0 ; par5 = 12 ;
R code (references can be found in the software module):
if (par1 == 'Default') {
par1 = 10*log10(length(x))
} else {
par1 <- as.numeric(par1)
}
par2 <- as.numeric(par2)
par3 <- as.numeric(par3)
par4 <- as.numeric(par4)
par5 <- as.numeric(par5)
if (par2 == 0) {
x <- log(x)
} else {
x <- (x ^ par2 - 1) / par2
}
if (par3 > 0) x <- diff(x,lag=1,difference=par3)
if (par4 > 0) x <- diff(x,lag=par5,difference=par4)
bitmap(file='pic1.png')
racf <- acf(x,par1,main='Autocorrelation',xlab='lags',ylab='ACF')
dev.off()
bitmap(file='pic2.png')
rpacf <- pacf(x,par1,main='Partial Autocorrelation',xlab='lags',ylab='PACF')
dev.off()
(myacf <- c(racf$acf))
(mypacf <- c(rpacf$acf))
lengthx <- length(x)
sqrtn <- sqrt(lengthx)
load(file='createtable')
a<-table.start()
a<-table.row.start(a)
a<-table.element(a,'Autocorrelation Function',4,TRUE)
a<-table.row.end(a)
a<-table.row.start(a)
a<-table.element(a,'Time lag k',header=TRUE)
a<-table.element(a,hyperlink('basics.htm','ACF(k)','click here for more information about the Autocorrelation Function'),header=TRUE)
a<-table.element(a,'T-STAT',header=TRUE)
a<-table.element(a,'P-value',header=TRUE)
a<-table.row.end(a)
for (i in 1:par1) {
a<-table.row.start(a)
a<-table.element(a,i-1,header=TRUE)
a<-table.element(a,round(myacf[i],6))
mytstat <- myacf[i]*sqrtn
a<-table.element(a,round(mytstat,4))
a<-table.element(a,round(1-pt(mytstat,lengthx),6))
a<-table.row.end(a)
}
a<-table.end(a)
table.save(a,file='mytable.tab')
a<-table.start()
a<-table.row.start(a)
a<-table.element(a,'Partial Autocorrelation Function',4,TRUE)
a<-table.row.end(a)
a<-table.row.start(a)
a<-table.element(a,'Time lag k',header=TRUE)
a<-table.element(a,hyperlink('basics.htm','PACF(k)','click here for more information about the Partial Autocorrelation Function'),header=TRUE)
a<-table.element(a,'T-STAT',header=TRUE)
a<-table.element(a,'P-value',header=TRUE)
a<-table.row.end(a)
for (i in 1:par1) {
a<-table.row.start(a)
a<-table.element(a,i-1,header=TRUE)
a<-table.element(a,round(mypacf[i],6))
mytstat <- mypacf[i]*sqrtn
a<-table.element(a,round(mytstat,4))
a<-table.element(a,round(1-pt(mytstat,lengthx),6))
a<-table.row.end(a)
}
a<-table.end(a)
table.save(a,file='mytable1.tab')