Free Statistics

of Irreproducible Research!

Author's title

Author*Unverified author*
R Software Modulerwasp_autocorrelation.wasp
Title produced by software(Partial) Autocorrelation Function
Date of computationFri, 23 Nov 2007 09:43:04 -0700
Cite this page as followsStatistical Computations at FreeStatistics.org, Office for Research Development and Education, URL https://freestatistics.org/blog/index.php?v=date/2007/Nov/23/t1195835689z31hpidc15eycia.htm/, Retrieved Mon, 29 Apr 2024 02:32:11 +0000
Statistical Computations at FreeStatistics.org, Office for Research Development and Education, URL https://freestatistics.org/blog/index.php?pk=6227, Retrieved Mon, 29 Apr 2024 02:32:11 +0000
QR Codes:

Original text written by user:
IsPrivate?No (this computation is public)
User-defined keywords
Estimated Impact164
Family? (F = Feedback message, R = changed R code, M = changed R Module, P = changed Parameters, D = changed Data)
-       [(Partial) Autocorrelation Function] [autocorr spaarver...] [2007-11-23 16:43:04] [bd02e85be52eb1cb060a2c60779eb820] [Current]
Feedback Forum

Post a new message
Dataseries X:
13
17
17
13
14
13
17
17
15
9
10
9
14
18
18
12
16
12
19
13
12
13
11
10
16
12
6
8
6
8
8
9
13
8
11
8
10
15
12
13
12
15
13
13
16
14
12
15
14
19
16
16
11
13
12
11
6
9
6
15
17
13
12
13
10
14
13
10
11
12
7
11


Summary of compuational transaction
Raw Inputview raw input (R code)
Raw Outputview raw output of R engine
Computing time2 seconds
R Server'Gwilym Jenkins' @ 72.249.127.135

\begin{tabular}{lllllllll}
\hline
Summary of compuational transaction \tabularnewline
Raw Input & view raw input (R code)  \tabularnewline
Raw Output & view raw output of R engine  \tabularnewline
Computing time & 2 seconds \tabularnewline
R Server & 'Gwilym Jenkins' @ 72.249.127.135 \tabularnewline
\hline
\end{tabular}
%Source: https://freestatistics.org/blog/index.php?pk=6227&T=0

[TABLE]
[ROW][C]Summary of compuational transaction[/C][/ROW]
[ROW][C]Raw Input[/C][C]view raw input (R code) [/C][/ROW]
[ROW][C]Raw Output[/C][C]view raw output of R engine [/C][/ROW]
[ROW][C]Computing time[/C][C]2 seconds[/C][/ROW]
[ROW][C]R Server[/C][C]'Gwilym Jenkins' @ 72.249.127.135[/C][/ROW]
[/TABLE]
Source: https://freestatistics.org/blog/index.php?pk=6227&T=0

Globally Unique Identifier (entire table): ba.freestatistics.org/blog/index.php?pk=6227&T=0

As an alternative you can also use a QR Code:  

The GUIDs for individual cells are displayed in the table below:

Summary of compuational transaction
Raw Inputview raw input (R code)
Raw Outputview raw output of R engine
Computing time2 seconds
R Server'Gwilym Jenkins' @ 72.249.127.135


Autocorrelation Function
Time lag kACF(k)T-STATP-value
017.68110
1-0.389102-2.98880.997961
2-0.00923-0.07090.528141
30.0979650.75250.227377
4-0.192469-1.47840.927688
50.1070090.8220.207206
60.0505090.3880.349717
7-0.138571-1.06440.854253
80.0833910.64050.262152
9-0.109455-0.84070.798057
100.1662661.27710.103283
110.0741540.56960.285561
12-0.33308-2.55840.993449
130.1405491.07960.142361
14-0.088608-0.68060.75061
15-0.074647-0.57340.715714
160.1205380.92590.179143
17-0.058944-0.45280.673807

\begin{tabular}{lllllllll}
\hline
Autocorrelation Function \tabularnewline
Time lag k & ACF(k) & T-STAT & P-value \tabularnewline
0 & 1 & 7.6811 & 0 \tabularnewline
1 & -0.389102 & -2.9888 & 0.997961 \tabularnewline
2 & -0.00923 & -0.0709 & 0.528141 \tabularnewline
3 & 0.097965 & 0.7525 & 0.227377 \tabularnewline
4 & -0.192469 & -1.4784 & 0.927688 \tabularnewline
5 & 0.107009 & 0.822 & 0.207206 \tabularnewline
6 & 0.050509 & 0.388 & 0.349717 \tabularnewline
7 & -0.138571 & -1.0644 & 0.854253 \tabularnewline
8 & 0.083391 & 0.6405 & 0.262152 \tabularnewline
9 & -0.109455 & -0.8407 & 0.798057 \tabularnewline
10 & 0.166266 & 1.2771 & 0.103283 \tabularnewline
11 & 0.074154 & 0.5696 & 0.285561 \tabularnewline
12 & -0.33308 & -2.5584 & 0.993449 \tabularnewline
13 & 0.140549 & 1.0796 & 0.142361 \tabularnewline
14 & -0.088608 & -0.6806 & 0.75061 \tabularnewline
15 & -0.074647 & -0.5734 & 0.715714 \tabularnewline
16 & 0.120538 & 0.9259 & 0.179143 \tabularnewline
17 & -0.058944 & -0.4528 & 0.673807 \tabularnewline
\hline
\end{tabular}
%Source: https://freestatistics.org/blog/index.php?pk=6227&T=1

[TABLE]
[ROW][C]Autocorrelation Function[/C][/ROW]
[ROW][C]Time lag k[/C][C]ACF(k)[/C][C]T-STAT[/C][C]P-value[/C][/ROW]
[ROW][C]0[/C][C]1[/C][C]7.6811[/C][C]0[/C][/ROW]
[ROW][C]1[/C][C]-0.389102[/C][C]-2.9888[/C][C]0.997961[/C][/ROW]
[ROW][C]2[/C][C]-0.00923[/C][C]-0.0709[/C][C]0.528141[/C][/ROW]
[ROW][C]3[/C][C]0.097965[/C][C]0.7525[/C][C]0.227377[/C][/ROW]
[ROW][C]4[/C][C]-0.192469[/C][C]-1.4784[/C][C]0.927688[/C][/ROW]
[ROW][C]5[/C][C]0.107009[/C][C]0.822[/C][C]0.207206[/C][/ROW]
[ROW][C]6[/C][C]0.050509[/C][C]0.388[/C][C]0.349717[/C][/ROW]
[ROW][C]7[/C][C]-0.138571[/C][C]-1.0644[/C][C]0.854253[/C][/ROW]
[ROW][C]8[/C][C]0.083391[/C][C]0.6405[/C][C]0.262152[/C][/ROW]
[ROW][C]9[/C][C]-0.109455[/C][C]-0.8407[/C][C]0.798057[/C][/ROW]
[ROW][C]10[/C][C]0.166266[/C][C]1.2771[/C][C]0.103283[/C][/ROW]
[ROW][C]11[/C][C]0.074154[/C][C]0.5696[/C][C]0.285561[/C][/ROW]
[ROW][C]12[/C][C]-0.33308[/C][C]-2.5584[/C][C]0.993449[/C][/ROW]
[ROW][C]13[/C][C]0.140549[/C][C]1.0796[/C][C]0.142361[/C][/ROW]
[ROW][C]14[/C][C]-0.088608[/C][C]-0.6806[/C][C]0.75061[/C][/ROW]
[ROW][C]15[/C][C]-0.074647[/C][C]-0.5734[/C][C]0.715714[/C][/ROW]
[ROW][C]16[/C][C]0.120538[/C][C]0.9259[/C][C]0.179143[/C][/ROW]
[ROW][C]17[/C][C]-0.058944[/C][C]-0.4528[/C][C]0.673807[/C][/ROW]
[/TABLE]
Source: https://freestatistics.org/blog/index.php?pk=6227&T=1

Globally Unique Identifier (entire table): ba.freestatistics.org/blog/index.php?pk=6227&T=1

As an alternative you can also use a QR Code:  

The GUIDs for individual cells are displayed in the table below:

Autocorrelation Function
Time lag kACF(k)T-STATP-value
017.68110
1-0.389102-2.98880.997961
2-0.00923-0.07090.528141
30.0979650.75250.227377
4-0.192469-1.47840.927688
50.1070090.8220.207206
60.0505090.3880.349717
7-0.138571-1.06440.854253
80.0833910.64050.262152
9-0.109455-0.84070.798057
100.1662661.27710.103283
110.0741540.56960.285561
12-0.33308-2.55840.993449
130.1405491.07960.142361
14-0.088608-0.68060.75061
15-0.074647-0.57340.715714
160.1205380.92590.179143
17-0.058944-0.45280.673807


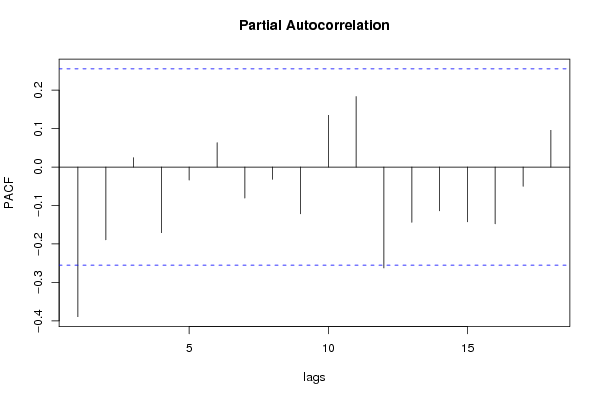
Partial Autocorrelation Function
Time lag kPACF(k)T-STATP-value
0-0.389102-2.98880.997961
1-0.189289-1.4540.924372
20.0244940.18810.425707
3-0.170846-1.31230.902749
4-0.033912-0.26050.6023
50.0634330.48720.313949
6-0.080561-0.61880.730785
7-0.031754-0.24390.595925
8-0.121664-0.93450.823078
90.134551.03350.152794
100.1833961.40870.082087
11-0.262532-2.01650.975849
12-0.143865-1.10510.863188
13-0.113882-0.87470.807369
14-0.142409-1.09390.860769
15-0.147761-1.1350.869511
16-0.050053-0.38450.648992
170.0954670.73330.233141

\begin{tabular}{lllllllll}
\hline
Partial Autocorrelation Function \tabularnewline
Time lag k & PACF(k) & T-STAT & P-value \tabularnewline
0 & -0.389102 & -2.9888 & 0.997961 \tabularnewline
1 & -0.189289 & -1.454 & 0.924372 \tabularnewline
2 & 0.024494 & 0.1881 & 0.425707 \tabularnewline
3 & -0.170846 & -1.3123 & 0.902749 \tabularnewline
4 & -0.033912 & -0.2605 & 0.6023 \tabularnewline
5 & 0.063433 & 0.4872 & 0.313949 \tabularnewline
6 & -0.080561 & -0.6188 & 0.730785 \tabularnewline
7 & -0.031754 & -0.2439 & 0.595925 \tabularnewline
8 & -0.121664 & -0.9345 & 0.823078 \tabularnewline
9 & 0.13455 & 1.0335 & 0.152794 \tabularnewline
10 & 0.183396 & 1.4087 & 0.082087 \tabularnewline
11 & -0.262532 & -2.0165 & 0.975849 \tabularnewline
12 & -0.143865 & -1.1051 & 0.863188 \tabularnewline
13 & -0.113882 & -0.8747 & 0.807369 \tabularnewline
14 & -0.142409 & -1.0939 & 0.860769 \tabularnewline
15 & -0.147761 & -1.135 & 0.869511 \tabularnewline
16 & -0.050053 & -0.3845 & 0.648992 \tabularnewline
17 & 0.095467 & 0.7333 & 0.233141 \tabularnewline
\hline
\end{tabular}
%Source: https://freestatistics.org/blog/index.php?pk=6227&T=2

[TABLE]
[ROW][C]Partial Autocorrelation Function[/C][/ROW]
[ROW][C]Time lag k[/C][C]PACF(k)[/C][C]T-STAT[/C][C]P-value[/C][/ROW]
[ROW][C]0[/C][C]-0.389102[/C][C]-2.9888[/C][C]0.997961[/C][/ROW]
[ROW][C]1[/C][C]-0.189289[/C][C]-1.454[/C][C]0.924372[/C][/ROW]
[ROW][C]2[/C][C]0.024494[/C][C]0.1881[/C][C]0.425707[/C][/ROW]
[ROW][C]3[/C][C]-0.170846[/C][C]-1.3123[/C][C]0.902749[/C][/ROW]
[ROW][C]4[/C][C]-0.033912[/C][C]-0.2605[/C][C]0.6023[/C][/ROW]
[ROW][C]5[/C][C]0.063433[/C][C]0.4872[/C][C]0.313949[/C][/ROW]
[ROW][C]6[/C][C]-0.080561[/C][C]-0.6188[/C][C]0.730785[/C][/ROW]
[ROW][C]7[/C][C]-0.031754[/C][C]-0.2439[/C][C]0.595925[/C][/ROW]
[ROW][C]8[/C][C]-0.121664[/C][C]-0.9345[/C][C]0.823078[/C][/ROW]
[ROW][C]9[/C][C]0.13455[/C][C]1.0335[/C][C]0.152794[/C][/ROW]
[ROW][C]10[/C][C]0.183396[/C][C]1.4087[/C][C]0.082087[/C][/ROW]
[ROW][C]11[/C][C]-0.262532[/C][C]-2.0165[/C][C]0.975849[/C][/ROW]
[ROW][C]12[/C][C]-0.143865[/C][C]-1.1051[/C][C]0.863188[/C][/ROW]
[ROW][C]13[/C][C]-0.113882[/C][C]-0.8747[/C][C]0.807369[/C][/ROW]
[ROW][C]14[/C][C]-0.142409[/C][C]-1.0939[/C][C]0.860769[/C][/ROW]
[ROW][C]15[/C][C]-0.147761[/C][C]-1.135[/C][C]0.869511[/C][/ROW]
[ROW][C]16[/C][C]-0.050053[/C][C]-0.3845[/C][C]0.648992[/C][/ROW]
[ROW][C]17[/C][C]0.095467[/C][C]0.7333[/C][C]0.233141[/C][/ROW]
[/TABLE]
Source: https://freestatistics.org/blog/index.php?pk=6227&T=2

Globally Unique Identifier (entire table): ba.freestatistics.org/blog/index.php?pk=6227&T=2

As an alternative you can also use a QR Code:  

The GUIDs for individual cells are displayed in the table below:

Partial Autocorrelation Function
Time lag kPACF(k)T-STATP-value
0-0.389102-2.98880.997961
1-0.189289-1.4540.924372
20.0244940.18810.425707
3-0.170846-1.31230.902749
4-0.033912-0.26050.6023
50.0634330.48720.313949
6-0.080561-0.61880.730785
7-0.031754-0.24390.595925
8-0.121664-0.93450.823078
90.134551.03350.152794
100.1833961.40870.082087
11-0.262532-2.01650.975849
12-0.143865-1.10510.863188
13-0.113882-0.87470.807369
14-0.142409-1.09390.860769
15-0.147761-1.1350.869511
16-0.050053-0.38450.648992
170.0954670.73330.233141


Parameters (Session):
par1 = Default ; par2 = 1 ; par3 = 1 ; par4 = 1 ; par5 = 12 ;
Parameters (R input):
par1 = Default ; par2 = 1 ; par3 = 1 ; par4 = 1 ; par5 = 12 ;
R code (references can be found in the software module):
if (par1 == 'Default') {
par1 = 10*log10(length(x))
} else {
par1 <- as.numeric(par1)
}
par2 <- as.numeric(par2)
par3 <- as.numeric(par3)
par4 <- as.numeric(par4)
par5 <- as.numeric(par5)
if (par2 == 0) {
x <- log(x)
} else {
x <- (x ^ par2 - 1) / par2
}
if (par3 > 0) x <- diff(x,lag=1,difference=par3)
if (par4 > 0) x <- diff(x,lag=par5,difference=par4)
bitmap(file='pic1.png')
racf <- acf(x,par1,main='Autocorrelation',xlab='lags',ylab='ACF')
dev.off()
bitmap(file='pic2.png')
rpacf <- pacf(x,par1,main='Partial Autocorrelation',xlab='lags',ylab='PACF')
dev.off()
(myacf <- c(racf$acf))
(mypacf <- c(rpacf$acf))
lengthx <- length(x)
sqrtn <- sqrt(lengthx)
load(file='createtable')
a<-table.start()
a<-table.row.start(a)
a<-table.element(a,'Autocorrelation Function',4,TRUE)
a<-table.row.end(a)
a<-table.row.start(a)
a<-table.element(a,'Time lag k',header=TRUE)
a<-table.element(a,hyperlink('basics.htm','ACF(k)','click here for more information about the Autocorrelation Function'),header=TRUE)
a<-table.element(a,'T-STAT',header=TRUE)
a<-table.element(a,'P-value',header=TRUE)
a<-table.row.end(a)
for (i in 1:par1) {
a<-table.row.start(a)
a<-table.element(a,i-1,header=TRUE)
a<-table.element(a,round(myacf[i],6))
mytstat <- myacf[i]*sqrtn
a<-table.element(a,round(mytstat,4))
a<-table.element(a,round(1-pt(mytstat,lengthx),6))
a<-table.row.end(a)
}
a<-table.end(a)
table.save(a,file='mytable.tab')
a<-table.start()
a<-table.row.start(a)
a<-table.element(a,'Partial Autocorrelation Function',4,TRUE)
a<-table.row.end(a)
a<-table.row.start(a)
a<-table.element(a,'Time lag k',header=TRUE)
a<-table.element(a,hyperlink('basics.htm','PACF(k)','click here for more information about the Partial Autocorrelation Function'),header=TRUE)
a<-table.element(a,'T-STAT',header=TRUE)
a<-table.element(a,'P-value',header=TRUE)
a<-table.row.end(a)
for (i in 1:par1) {
a<-table.row.start(a)
a<-table.element(a,i-1,header=TRUE)
a<-table.element(a,round(mypacf[i],6))
mytstat <- mypacf[i]*sqrtn
a<-table.element(a,round(mytstat,4))
a<-table.element(a,round(1-pt(mytstat,lengthx),6))
a<-table.row.end(a)
}
a<-table.end(a)
table.save(a,file='mytable1.tab')