Free Statistics

of Irreproducible Research!

Author's title

Author*Unverified author*
R Software Modulerwasp_autocorrelation.wasp
Title produced by software(Partial) Autocorrelation Function
Date of computationFri, 23 Nov 2007 08:55:49 -0700
Cite this page as followsStatistical Computations at FreeStatistics.org, Office for Research Development and Education, URL https://freestatistics.org/blog/index.php?v=date/2007/Nov/23/t1195833024m559x38anhmdcz3.htm/, Retrieved Sun, 28 Apr 2024 20:03:36 +0000
Statistical Computations at FreeStatistics.org, Office for Research Development and Education, URL https://freestatistics.org/blog/index.php?pk=6210, Retrieved Sun, 28 Apr 2024 20:03:36 +0000
QR Codes:

Original text written by user:
IsPrivate?No (this computation is public)
User-defined keywords
Estimated Impact183
Family? (F = Feedback message, R = changed R code, M = changed R Module, P = changed Parameters, D = changed Data)
-       [(Partial) Autocorrelation Function] [] [2007-11-23 15:55:49] [2467046df5c61f7ccf2ce4e184abae94] [Current]
Feedback Forum

Post a new message
Dataseries X:
99,7
99
98,1
97
98,5
103,8
114,4
124,5
134,2
131,8
125,6
119,9
114,9
115,5
112,5
111,4
115,3
110,8
103,7
111,1
113
111,2
117,6
121,7
127,3
129,8
137,1
141,4
137,4
130,7
117,2
110,8
111,4
108,2
108,8
110,2
109,5
109,5
116
111,2
112,1
114
119,1
114,1
115,1
115,4
110,8
116
119,2
126,5
127,8
131,3
140,3
137,3
143
134,5
139,9
159,3
170,4
175


Summary of compuational transaction
Raw Inputview raw input (R code)
Raw Outputview raw output of R engine
Computing time1 seconds
R Server'Gwilym Jenkins' @ 72.249.127.135

\begin{tabular}{lllllllll}
\hline
Summary of compuational transaction \tabularnewline
Raw Input & view raw input (R code)  \tabularnewline
Raw Output & view raw output of R engine  \tabularnewline
Computing time & 1 seconds \tabularnewline
R Server & 'Gwilym Jenkins' @ 72.249.127.135 \tabularnewline
\hline
\end{tabular}
%Source: https://freestatistics.org/blog/index.php?pk=6210&T=0

[TABLE]
[ROW][C]Summary of compuational transaction[/C][/ROW]
[ROW][C]Raw Input[/C][C]view raw input (R code) [/C][/ROW]
[ROW][C]Raw Output[/C][C]view raw output of R engine [/C][/ROW]
[ROW][C]Computing time[/C][C]1 seconds[/C][/ROW]
[ROW][C]R Server[/C][C]'Gwilym Jenkins' @ 72.249.127.135[/C][/ROW]
[/TABLE]
Source: https://freestatistics.org/blog/index.php?pk=6210&T=0

Globally Unique Identifier (entire table): ba.freestatistics.org/blog/index.php?pk=6210&T=0

As an alternative you can also use a QR Code:  

The GUIDs for individual cells are displayed in the table below:

Summary of compuational transaction
Raw Inputview raw input (R code)
Raw Outputview raw output of R engine
Computing time1 seconds
R Server'Gwilym Jenkins' @ 72.249.127.135


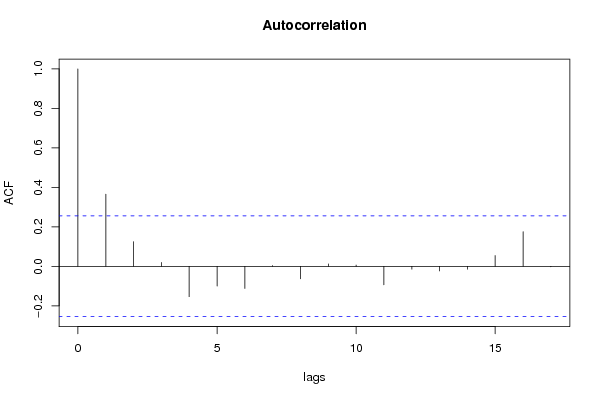
Autocorrelation Function
Time lag kACF(k)T-STATP-value
017.68110
10.3655482.80780.003376
20.1244790.95610.17145
30.0197640.15180.439928
4-0.154303-1.18520.87966
5-0.100021-0.76830.777307
6-0.112304-0.86260.804081
70.0040340.0310.487694
8-0.063704-0.48930.686785
90.0120530.09260.463274
100.0065820.05060.479924
11-0.093766-0.72020.762888
12-0.014559-0.11180.54433
13-0.023335-0.17920.570818
14-0.014857-0.11410.545234
150.0547090.42020.337922
160.1755491.34840.091339

\begin{tabular}{lllllllll}
\hline
Autocorrelation Function \tabularnewline
Time lag k & ACF(k) & T-STAT & P-value \tabularnewline
0 & 1 & 7.6811 & 0 \tabularnewline
1 & 0.365548 & 2.8078 & 0.003376 \tabularnewline
2 & 0.124479 & 0.9561 & 0.17145 \tabularnewline
3 & 0.019764 & 0.1518 & 0.439928 \tabularnewline
4 & -0.154303 & -1.1852 & 0.87966 \tabularnewline
5 & -0.100021 & -0.7683 & 0.777307 \tabularnewline
6 & -0.112304 & -0.8626 & 0.804081 \tabularnewline
7 & 0.004034 & 0.031 & 0.487694 \tabularnewline
8 & -0.063704 & -0.4893 & 0.686785 \tabularnewline
9 & 0.012053 & 0.0926 & 0.463274 \tabularnewline
10 & 0.006582 & 0.0506 & 0.479924 \tabularnewline
11 & -0.093766 & -0.7202 & 0.762888 \tabularnewline
12 & -0.014559 & -0.1118 & 0.54433 \tabularnewline
13 & -0.023335 & -0.1792 & 0.570818 \tabularnewline
14 & -0.014857 & -0.1141 & 0.545234 \tabularnewline
15 & 0.054709 & 0.4202 & 0.337922 \tabularnewline
16 & 0.175549 & 1.3484 & 0.091339 \tabularnewline
\hline
\end{tabular}
%Source: https://freestatistics.org/blog/index.php?pk=6210&T=1

[TABLE]
[ROW][C]Autocorrelation Function[/C][/ROW]
[ROW][C]Time lag k[/C][C]ACF(k)[/C][C]T-STAT[/C][C]P-value[/C][/ROW]
[ROW][C]0[/C][C]1[/C][C]7.6811[/C][C]0[/C][/ROW]
[ROW][C]1[/C][C]0.365548[/C][C]2.8078[/C][C]0.003376[/C][/ROW]
[ROW][C]2[/C][C]0.124479[/C][C]0.9561[/C][C]0.17145[/C][/ROW]
[ROW][C]3[/C][C]0.019764[/C][C]0.1518[/C][C]0.439928[/C][/ROW]
[ROW][C]4[/C][C]-0.154303[/C][C]-1.1852[/C][C]0.87966[/C][/ROW]
[ROW][C]5[/C][C]-0.100021[/C][C]-0.7683[/C][C]0.777307[/C][/ROW]
[ROW][C]6[/C][C]-0.112304[/C][C]-0.8626[/C][C]0.804081[/C][/ROW]
[ROW][C]7[/C][C]0.004034[/C][C]0.031[/C][C]0.487694[/C][/ROW]
[ROW][C]8[/C][C]-0.063704[/C][C]-0.4893[/C][C]0.686785[/C][/ROW]
[ROW][C]9[/C][C]0.012053[/C][C]0.0926[/C][C]0.463274[/C][/ROW]
[ROW][C]10[/C][C]0.006582[/C][C]0.0506[/C][C]0.479924[/C][/ROW]
[ROW][C]11[/C][C]-0.093766[/C][C]-0.7202[/C][C]0.762888[/C][/ROW]
[ROW][C]12[/C][C]-0.014559[/C][C]-0.1118[/C][C]0.54433[/C][/ROW]
[ROW][C]13[/C][C]-0.023335[/C][C]-0.1792[/C][C]0.570818[/C][/ROW]
[ROW][C]14[/C][C]-0.014857[/C][C]-0.1141[/C][C]0.545234[/C][/ROW]
[ROW][C]15[/C][C]0.054709[/C][C]0.4202[/C][C]0.337922[/C][/ROW]
[ROW][C]16[/C][C]0.175549[/C][C]1.3484[/C][C]0.091339[/C][/ROW]
[/TABLE]
Source: https://freestatistics.org/blog/index.php?pk=6210&T=1

Globally Unique Identifier (entire table): ba.freestatistics.org/blog/index.php?pk=6210&T=1

As an alternative you can also use a QR Code:  

The GUIDs for individual cells are displayed in the table below:

Autocorrelation Function
Time lag kACF(k)T-STATP-value
017.68110
10.3655482.80780.003376
20.1244790.95610.17145
30.0197640.15180.439928
4-0.154303-1.18520.87966
5-0.100021-0.76830.777307
6-0.112304-0.86260.804081
70.0040340.0310.487694
8-0.063704-0.48930.686785
90.0120530.09260.463274
100.0065820.05060.479924
11-0.093766-0.72020.762888
12-0.014559-0.11180.54433
13-0.023335-0.17920.570818
14-0.014857-0.11410.545234
150.0547090.42020.337922
160.1755491.34840.091339


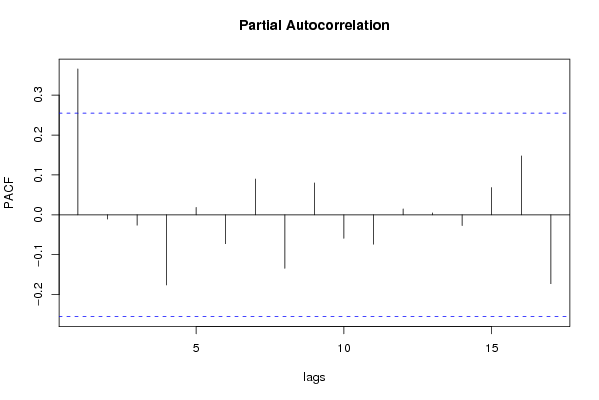
Partial Autocorrelation Function
Time lag kPACF(k)T-STATP-value
00.3655482.80780.003376
1-0.010557-0.08110.532176
2-0.025812-0.19830.578242
3-0.175622-1.3490.908751
40.0185980.14290.443447
5-0.072339-0.55560.709723
60.0897360.68930.246677
7-0.133987-1.02920.846201
80.0800570.61490.270484
9-0.058755-0.45130.673288
10-0.073552-0.5650.712881
110.0146610.11260.45536
120.0047420.03640.485533
13-0.026788-0.20580.581159
140.0683780.52520.300698
150.1476661.13420.130641
16-0.172527-1.32520.904894

\begin{tabular}{lllllllll}
\hline
Partial Autocorrelation Function \tabularnewline
Time lag k & PACF(k) & T-STAT & P-value \tabularnewline
0 & 0.365548 & 2.8078 & 0.003376 \tabularnewline
1 & -0.010557 & -0.0811 & 0.532176 \tabularnewline
2 & -0.025812 & -0.1983 & 0.578242 \tabularnewline
3 & -0.175622 & -1.349 & 0.908751 \tabularnewline
4 & 0.018598 & 0.1429 & 0.443447 \tabularnewline
5 & -0.072339 & -0.5556 & 0.709723 \tabularnewline
6 & 0.089736 & 0.6893 & 0.246677 \tabularnewline
7 & -0.133987 & -1.0292 & 0.846201 \tabularnewline
8 & 0.080057 & 0.6149 & 0.270484 \tabularnewline
9 & -0.058755 & -0.4513 & 0.673288 \tabularnewline
10 & -0.073552 & -0.565 & 0.712881 \tabularnewline
11 & 0.014661 & 0.1126 & 0.45536 \tabularnewline
12 & 0.004742 & 0.0364 & 0.485533 \tabularnewline
13 & -0.026788 & -0.2058 & 0.581159 \tabularnewline
14 & 0.068378 & 0.5252 & 0.300698 \tabularnewline
15 & 0.147666 & 1.1342 & 0.130641 \tabularnewline
16 & -0.172527 & -1.3252 & 0.904894 \tabularnewline
\hline
\end{tabular}
%Source: https://freestatistics.org/blog/index.php?pk=6210&T=2

[TABLE]
[ROW][C]Partial Autocorrelation Function[/C][/ROW]
[ROW][C]Time lag k[/C][C]PACF(k)[/C][C]T-STAT[/C][C]P-value[/C][/ROW]
[ROW][C]0[/C][C]0.365548[/C][C]2.8078[/C][C]0.003376[/C][/ROW]
[ROW][C]1[/C][C]-0.010557[/C][C]-0.0811[/C][C]0.532176[/C][/ROW]
[ROW][C]2[/C][C]-0.025812[/C][C]-0.1983[/C][C]0.578242[/C][/ROW]
[ROW][C]3[/C][C]-0.175622[/C][C]-1.349[/C][C]0.908751[/C][/ROW]
[ROW][C]4[/C][C]0.018598[/C][C]0.1429[/C][C]0.443447[/C][/ROW]
[ROW][C]5[/C][C]-0.072339[/C][C]-0.5556[/C][C]0.709723[/C][/ROW]
[ROW][C]6[/C][C]0.089736[/C][C]0.6893[/C][C]0.246677[/C][/ROW]
[ROW][C]7[/C][C]-0.133987[/C][C]-1.0292[/C][C]0.846201[/C][/ROW]
[ROW][C]8[/C][C]0.080057[/C][C]0.6149[/C][C]0.270484[/C][/ROW]
[ROW][C]9[/C][C]-0.058755[/C][C]-0.4513[/C][C]0.673288[/C][/ROW]
[ROW][C]10[/C][C]-0.073552[/C][C]-0.565[/C][C]0.712881[/C][/ROW]
[ROW][C]11[/C][C]0.014661[/C][C]0.1126[/C][C]0.45536[/C][/ROW]
[ROW][C]12[/C][C]0.004742[/C][C]0.0364[/C][C]0.485533[/C][/ROW]
[ROW][C]13[/C][C]-0.026788[/C][C]-0.2058[/C][C]0.581159[/C][/ROW]
[ROW][C]14[/C][C]0.068378[/C][C]0.5252[/C][C]0.300698[/C][/ROW]
[ROW][C]15[/C][C]0.147666[/C][C]1.1342[/C][C]0.130641[/C][/ROW]
[ROW][C]16[/C][C]-0.172527[/C][C]-1.3252[/C][C]0.904894[/C][/ROW]
[/TABLE]
Source: https://freestatistics.org/blog/index.php?pk=6210&T=2

Globally Unique Identifier (entire table): ba.freestatistics.org/blog/index.php?pk=6210&T=2

As an alternative you can also use a QR Code:  

The GUIDs for individual cells are displayed in the table below:

Partial Autocorrelation Function
Time lag kPACF(k)T-STATP-value
00.3655482.80780.003376
1-0.010557-0.08110.532176
2-0.025812-0.19830.578242
3-0.175622-1.3490.908751
40.0185980.14290.443447
5-0.072339-0.55560.709723
60.0897360.68930.246677
7-0.133987-1.02920.846201
80.0800570.61490.270484
9-0.058755-0.45130.673288
10-0.073552-0.5650.712881
110.0146610.11260.45536
120.0047420.03640.485533
13-0.026788-0.20580.581159
140.0683780.52520.300698
150.1476661.13420.130641
16-0.172527-1.32520.904894


Parameters (Session):
par1 = Default ; par2 = 1 ; par3 = 1 ; par4 = 0 ; par5 = 12 ;
Parameters (R input):
par1 = Default ; par2 = 1 ; par3 = 1 ; par4 = 0 ; par5 = 12 ;
R code (references can be found in the software module):
if (par1 == 'Default') {
par1 = 10*log10(length(x))
} else {
par1 <- as.numeric(par1)
}
par2 <- as.numeric(par2)
par3 <- as.numeric(par3)
par4 <- as.numeric(par4)
par5 <- as.numeric(par5)
if (par2 == 0) {
x <- log(x)
} else {
x <- (x ^ par2 - 1) / par2
}
if (par3 > 0) x <- diff(x,lag=1,difference=par3)
if (par4 > 0) x <- diff(x,lag=par5,difference=par4)
bitmap(file='pic1.png')
racf <- acf(x,par1,main='Autocorrelation',xlab='lags',ylab='ACF')
dev.off()
bitmap(file='pic2.png')
rpacf <- pacf(x,par1,main='Partial Autocorrelation',xlab='lags',ylab='PACF')
dev.off()
(myacf <- c(racf$acf))
(mypacf <- c(rpacf$acf))
lengthx <- length(x)
sqrtn <- sqrt(lengthx)
load(file='createtable')
a<-table.start()
a<-table.row.start(a)
a<-table.element(a,'Autocorrelation Function',4,TRUE)
a<-table.row.end(a)
a<-table.row.start(a)
a<-table.element(a,'Time lag k',header=TRUE)
a<-table.element(a,hyperlink('basics.htm','ACF(k)','click here for more information about the Autocorrelation Function'),header=TRUE)
a<-table.element(a,'T-STAT',header=TRUE)
a<-table.element(a,'P-value',header=TRUE)
a<-table.row.end(a)
for (i in 1:par1) {
a<-table.row.start(a)
a<-table.element(a,i-1,header=TRUE)
a<-table.element(a,round(myacf[i],6))
mytstat <- myacf[i]*sqrtn
a<-table.element(a,round(mytstat,4))
a<-table.element(a,round(1-pt(mytstat,lengthx),6))
a<-table.row.end(a)
}
a<-table.end(a)
table.save(a,file='mytable.tab')
a<-table.start()
a<-table.row.start(a)
a<-table.element(a,'Partial Autocorrelation Function',4,TRUE)
a<-table.row.end(a)
a<-table.row.start(a)
a<-table.element(a,'Time lag k',header=TRUE)
a<-table.element(a,hyperlink('basics.htm','PACF(k)','click here for more information about the Partial Autocorrelation Function'),header=TRUE)
a<-table.element(a,'T-STAT',header=TRUE)
a<-table.element(a,'P-value',header=TRUE)
a<-table.row.end(a)
for (i in 1:par1) {
a<-table.row.start(a)
a<-table.element(a,i-1,header=TRUE)
a<-table.element(a,round(mypacf[i],6))
mytstat <- mypacf[i]*sqrtn
a<-table.element(a,round(mytstat,4))
a<-table.element(a,round(1-pt(mytstat,lengthx),6))
a<-table.row.end(a)
}
a<-table.end(a)
table.save(a,file='mytable1.tab')