Free Statistics

of Irreproducible Research!

Author's title

Author*Unverified author*
R Software Modulerwasp_autocorrelation.wasp
Title produced by software(Partial) Autocorrelation Function
Date of computationFri, 23 Nov 2007 08:45:32 -0700
Cite this page as followsStatistical Computations at FreeStatistics.org, Office for Research Development and Education, URL https://freestatistics.org/blog/index.php?v=date/2007/Nov/23/t1195832208ulkd36n1mxqbd9c.htm/, Retrieved Mon, 29 Apr 2024 04:57:27 +0000
Statistical Computations at FreeStatistics.org, Office for Research Development and Education, URL https://freestatistics.org/blog/index.php?pk=6200, Retrieved Mon, 29 Apr 2024 04:57:27 +0000
QR Codes:

Original text written by user:
IsPrivate?No (this computation is public)
User-defined keywords
Estimated Impact199
Family? (F = Feedback message, R = changed R code, M = changed R Module, P = changed Parameters, D = changed Data)
-       [(Partial) Autocorrelation Function] [] [2007-11-23 15:45:32] [a1fadf46580e43815db2830b4560d35f] [Current]
Feedback Forum

Post a new message
Dataseries X:
92,4
92
95,6
95,8
96,4
99
107
109,7
116,2
115,9
113,8
112,6
113,7
115,9
110,3
111,3
113,4
108,2
104,8
106
110,9
115
118,4
121,4
128,8
131,7
141,7
142,9
139,4
134,7
125
113,6
111,5
108,5
112,3
116,6
115,5
120,1
132,9
128,1
129,3
132,5
131
124,9
120,8
122
122,1
127,4
135,2
137,3
135
136
138,4
134,7
138,4
133,9
133,6
141,2
151,8
155,4


Summary of compuational transaction
Raw Inputview raw input (R code)
Raw Outputview raw output of R engine
Computing time3 seconds
R Server'Herman Ole Andreas Wold' @ 193.190.124.10:1001

\begin{tabular}{lllllllll}
\hline
Summary of compuational transaction \tabularnewline
Raw Input & view raw input (R code)  \tabularnewline
Raw Output & view raw output of R engine  \tabularnewline
Computing time & 3 seconds \tabularnewline
R Server & 'Herman Ole Andreas Wold' @ 193.190.124.10:1001 \tabularnewline
\hline
\end{tabular}
%Source: https://freestatistics.org/blog/index.php?pk=6200&T=0

[TABLE]
[ROW][C]Summary of compuational transaction[/C][/ROW]
[ROW][C]Raw Input[/C][C]view raw input (R code) [/C][/ROW]
[ROW][C]Raw Output[/C][C]view raw output of R engine [/C][/ROW]
[ROW][C]Computing time[/C][C]3 seconds[/C][/ROW]
[ROW][C]R Server[/C][C]'Herman Ole Andreas Wold' @ 193.190.124.10:1001[/C][/ROW]
[/TABLE]
Source: https://freestatistics.org/blog/index.php?pk=6200&T=0

Globally Unique Identifier (entire table): ba.freestatistics.org/blog/index.php?pk=6200&T=0

As an alternative you can also use a QR Code:  

The GUIDs for individual cells are displayed in the table below:

Summary of compuational transaction
Raw Inputview raw input (R code)
Raw Outputview raw output of R engine
Computing time3 seconds
R Server'Herman Ole Andreas Wold' @ 193.190.124.10:1001


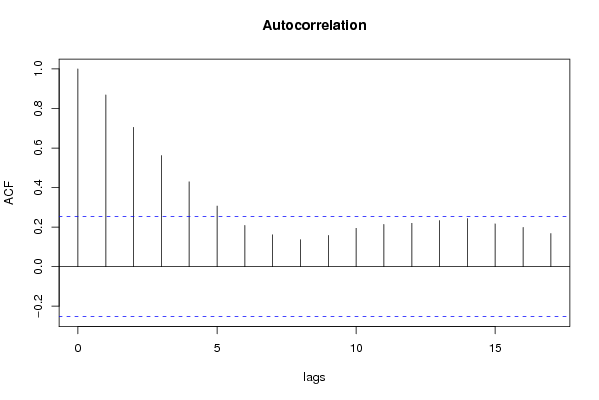
Autocorrelation Function
Time lag kACF(k)T-STATP-value
017.7460
10.8686246.72830
20.7044815.45690
30.5621124.35412.6e-05
40.4288883.32220.000762
50.3066962.37570.010364
60.2085921.61570.055698
70.160941.24660.108689
80.1364621.0570.147368
90.1578531.22270.113107
100.1937171.50050.069362
110.2131971.65140.05194
120.2191061.69720.047421
130.2331861.80630.037948
140.2432951.88460.032168
150.2162961.67540.049528
160.1983241.53620.064872

\begin{tabular}{lllllllll}
\hline
Autocorrelation Function \tabularnewline
Time lag k & ACF(k) & T-STAT & P-value \tabularnewline
0 & 1 & 7.746 & 0 \tabularnewline
1 & 0.868624 & 6.7283 & 0 \tabularnewline
2 & 0.704481 & 5.4569 & 0 \tabularnewline
3 & 0.562112 & 4.3541 & 2.6e-05 \tabularnewline
4 & 0.428888 & 3.3222 & 0.000762 \tabularnewline
5 & 0.306696 & 2.3757 & 0.010364 \tabularnewline
6 & 0.208592 & 1.6157 & 0.055698 \tabularnewline
7 & 0.16094 & 1.2466 & 0.108689 \tabularnewline
8 & 0.136462 & 1.057 & 0.147368 \tabularnewline
9 & 0.157853 & 1.2227 & 0.113107 \tabularnewline
10 & 0.193717 & 1.5005 & 0.069362 \tabularnewline
11 & 0.213197 & 1.6514 & 0.05194 \tabularnewline
12 & 0.219106 & 1.6972 & 0.047421 \tabularnewline
13 & 0.233186 & 1.8063 & 0.037948 \tabularnewline
14 & 0.243295 & 1.8846 & 0.032168 \tabularnewline
15 & 0.216296 & 1.6754 & 0.049528 \tabularnewline
16 & 0.198324 & 1.5362 & 0.064872 \tabularnewline
\hline
\end{tabular}
%Source: https://freestatistics.org/blog/index.php?pk=6200&T=1

[TABLE]
[ROW][C]Autocorrelation Function[/C][/ROW]
[ROW][C]Time lag k[/C][C]ACF(k)[/C][C]T-STAT[/C][C]P-value[/C][/ROW]
[ROW][C]0[/C][C]1[/C][C]7.746[/C][C]0[/C][/ROW]
[ROW][C]1[/C][C]0.868624[/C][C]6.7283[/C][C]0[/C][/ROW]
[ROW][C]2[/C][C]0.704481[/C][C]5.4569[/C][C]0[/C][/ROW]
[ROW][C]3[/C][C]0.562112[/C][C]4.3541[/C][C]2.6e-05[/C][/ROW]
[ROW][C]4[/C][C]0.428888[/C][C]3.3222[/C][C]0.000762[/C][/ROW]
[ROW][C]5[/C][C]0.306696[/C][C]2.3757[/C][C]0.010364[/C][/ROW]
[ROW][C]6[/C][C]0.208592[/C][C]1.6157[/C][C]0.055698[/C][/ROW]
[ROW][C]7[/C][C]0.16094[/C][C]1.2466[/C][C]0.108689[/C][/ROW]
[ROW][C]8[/C][C]0.136462[/C][C]1.057[/C][C]0.147368[/C][/ROW]
[ROW][C]9[/C][C]0.157853[/C][C]1.2227[/C][C]0.113107[/C][/ROW]
[ROW][C]10[/C][C]0.193717[/C][C]1.5005[/C][C]0.069362[/C][/ROW]
[ROW][C]11[/C][C]0.213197[/C][C]1.6514[/C][C]0.05194[/C][/ROW]
[ROW][C]12[/C][C]0.219106[/C][C]1.6972[/C][C]0.047421[/C][/ROW]
[ROW][C]13[/C][C]0.233186[/C][C]1.8063[/C][C]0.037948[/C][/ROW]
[ROW][C]14[/C][C]0.243295[/C][C]1.8846[/C][C]0.032168[/C][/ROW]
[ROW][C]15[/C][C]0.216296[/C][C]1.6754[/C][C]0.049528[/C][/ROW]
[ROW][C]16[/C][C]0.198324[/C][C]1.5362[/C][C]0.064872[/C][/ROW]
[/TABLE]
Source: https://freestatistics.org/blog/index.php?pk=6200&T=1

Globally Unique Identifier (entire table): ba.freestatistics.org/blog/index.php?pk=6200&T=1

As an alternative you can also use a QR Code:  

The GUIDs for individual cells are displayed in the table below:

Autocorrelation Function
Time lag kACF(k)T-STATP-value
017.7460
10.8686246.72830
20.7044815.45690
30.5621124.35412.6e-05
40.4288883.32220.000762
50.3066962.37570.010364
60.2085921.61570.055698
70.160941.24660.108689
80.1364621.0570.147368
90.1578531.22270.113107
100.1937171.50050.069362
110.2131971.65140.05194
120.2191061.69720.047421
130.2331861.80630.037948
140.2432951.88460.032168
150.2162961.67540.049528
160.1983241.53620.064872


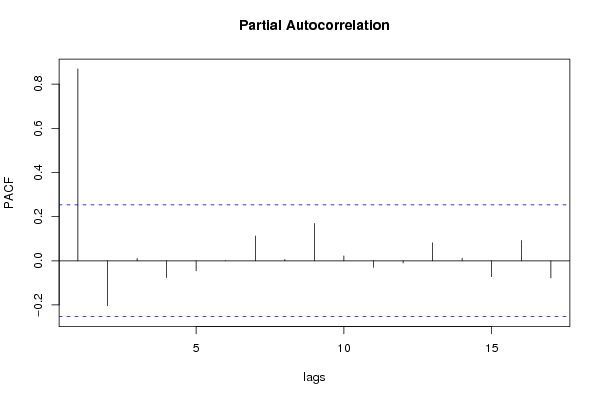
Partial Autocorrelation Function
Time lag kPACF(k)T-STATP-value
00.8686246.72830
1-0.20378-1.57850.940143
20.010590.0820.467448
3-0.076192-0.59020.721358
4-0.045234-0.35040.63636
50.0002840.00220.499127
60.1124910.87140.193517
70.005940.0460.481729
80.1691951.31060.097497
90.0216940.1680.433559
10-0.030346-0.23510.59252
11-0.009886-0.07660.530394
120.0813250.62990.265563
130.0114830.08890.46471
14-0.072131-0.55870.710785
150.092140.71370.239086
16-0.077745-0.60220.72535

\begin{tabular}{lllllllll}
\hline
Partial Autocorrelation Function \tabularnewline
Time lag k & PACF(k) & T-STAT & P-value \tabularnewline
0 & 0.868624 & 6.7283 & 0 \tabularnewline
1 & -0.20378 & -1.5785 & 0.940143 \tabularnewline
2 & 0.01059 & 0.082 & 0.467448 \tabularnewline
3 & -0.076192 & -0.5902 & 0.721358 \tabularnewline
4 & -0.045234 & -0.3504 & 0.63636 \tabularnewline
5 & 0.000284 & 0.0022 & 0.499127 \tabularnewline
6 & 0.112491 & 0.8714 & 0.193517 \tabularnewline
7 & 0.00594 & 0.046 & 0.481729 \tabularnewline
8 & 0.169195 & 1.3106 & 0.097497 \tabularnewline
9 & 0.021694 & 0.168 & 0.433559 \tabularnewline
10 & -0.030346 & -0.2351 & 0.59252 \tabularnewline
11 & -0.009886 & -0.0766 & 0.530394 \tabularnewline
12 & 0.081325 & 0.6299 & 0.265563 \tabularnewline
13 & 0.011483 & 0.0889 & 0.46471 \tabularnewline
14 & -0.072131 & -0.5587 & 0.710785 \tabularnewline
15 & 0.09214 & 0.7137 & 0.239086 \tabularnewline
16 & -0.077745 & -0.6022 & 0.72535 \tabularnewline
\hline
\end{tabular}
%Source: https://freestatistics.org/blog/index.php?pk=6200&T=2

[TABLE]
[ROW][C]Partial Autocorrelation Function[/C][/ROW]
[ROW][C]Time lag k[/C][C]PACF(k)[/C][C]T-STAT[/C][C]P-value[/C][/ROW]
[ROW][C]0[/C][C]0.868624[/C][C]6.7283[/C][C]0[/C][/ROW]
[ROW][C]1[/C][C]-0.20378[/C][C]-1.5785[/C][C]0.940143[/C][/ROW]
[ROW][C]2[/C][C]0.01059[/C][C]0.082[/C][C]0.467448[/C][/ROW]
[ROW][C]3[/C][C]-0.076192[/C][C]-0.5902[/C][C]0.721358[/C][/ROW]
[ROW][C]4[/C][C]-0.045234[/C][C]-0.3504[/C][C]0.63636[/C][/ROW]
[ROW][C]5[/C][C]0.000284[/C][C]0.0022[/C][C]0.499127[/C][/ROW]
[ROW][C]6[/C][C]0.112491[/C][C]0.8714[/C][C]0.193517[/C][/ROW]
[ROW][C]7[/C][C]0.00594[/C][C]0.046[/C][C]0.481729[/C][/ROW]
[ROW][C]8[/C][C]0.169195[/C][C]1.3106[/C][C]0.097497[/C][/ROW]
[ROW][C]9[/C][C]0.021694[/C][C]0.168[/C][C]0.433559[/C][/ROW]
[ROW][C]10[/C][C]-0.030346[/C][C]-0.2351[/C][C]0.59252[/C][/ROW]
[ROW][C]11[/C][C]-0.009886[/C][C]-0.0766[/C][C]0.530394[/C][/ROW]
[ROW][C]12[/C][C]0.081325[/C][C]0.6299[/C][C]0.265563[/C][/ROW]
[ROW][C]13[/C][C]0.011483[/C][C]0.0889[/C][C]0.46471[/C][/ROW]
[ROW][C]14[/C][C]-0.072131[/C][C]-0.5587[/C][C]0.710785[/C][/ROW]
[ROW][C]15[/C][C]0.09214[/C][C]0.7137[/C][C]0.239086[/C][/ROW]
[ROW][C]16[/C][C]-0.077745[/C][C]-0.6022[/C][C]0.72535[/C][/ROW]
[/TABLE]
Source: https://freestatistics.org/blog/index.php?pk=6200&T=2

Globally Unique Identifier (entire table): ba.freestatistics.org/blog/index.php?pk=6200&T=2

As an alternative you can also use a QR Code:  

The GUIDs for individual cells are displayed in the table below:

Partial Autocorrelation Function
Time lag kPACF(k)T-STATP-value
00.8686246.72830
1-0.20378-1.57850.940143
20.010590.0820.467448
3-0.076192-0.59020.721358
4-0.045234-0.35040.63636
50.0002840.00220.499127
60.1124910.87140.193517
70.005940.0460.481729
80.1691951.31060.097497
90.0216940.1680.433559
10-0.030346-0.23510.59252
11-0.009886-0.07660.530394
120.0813250.62990.265563
130.0114830.08890.46471
14-0.072131-0.55870.710785
150.092140.71370.239086
16-0.077745-0.60220.72535


Parameters (Session):
par1 = Default ; par2 = 1 ; par3 = 0 ; par4 = 0 ; par5 = 12 ;
Parameters (R input):
par1 = Default ; par2 = 1 ; par3 = 0 ; par4 = 0 ; par5 = 12 ;
R code (references can be found in the software module):
if (par1 == 'Default') {
par1 = 10*log10(length(x))
} else {
par1 <- as.numeric(par1)
}
par2 <- as.numeric(par2)
par3 <- as.numeric(par3)
par4 <- as.numeric(par4)
par5 <- as.numeric(par5)
if (par2 == 0) {
x <- log(x)
} else {
x <- (x ^ par2 - 1) / par2
}
if (par3 > 0) x <- diff(x,lag=1,difference=par3)
if (par4 > 0) x <- diff(x,lag=par5,difference=par4)
bitmap(file='pic1.png')
racf <- acf(x,par1,main='Autocorrelation',xlab='lags',ylab='ACF')
dev.off()
bitmap(file='pic2.png')
rpacf <- pacf(x,par1,main='Partial Autocorrelation',xlab='lags',ylab='PACF')
dev.off()
(myacf <- c(racf$acf))
(mypacf <- c(rpacf$acf))
lengthx <- length(x)
sqrtn <- sqrt(lengthx)
load(file='createtable')
a<-table.start()
a<-table.row.start(a)
a<-table.element(a,'Autocorrelation Function',4,TRUE)
a<-table.row.end(a)
a<-table.row.start(a)
a<-table.element(a,'Time lag k',header=TRUE)
a<-table.element(a,hyperlink('basics.htm','ACF(k)','click here for more information about the Autocorrelation Function'),header=TRUE)
a<-table.element(a,'T-STAT',header=TRUE)
a<-table.element(a,'P-value',header=TRUE)
a<-table.row.end(a)
for (i in 1:par1) {
a<-table.row.start(a)
a<-table.element(a,i-1,header=TRUE)
a<-table.element(a,round(myacf[i],6))
mytstat <- myacf[i]*sqrtn
a<-table.element(a,round(mytstat,4))
a<-table.element(a,round(1-pt(mytstat,lengthx),6))
a<-table.row.end(a)
}
a<-table.end(a)
table.save(a,file='mytable.tab')
a<-table.start()
a<-table.row.start(a)
a<-table.element(a,'Partial Autocorrelation Function',4,TRUE)
a<-table.row.end(a)
a<-table.row.start(a)
a<-table.element(a,'Time lag k',header=TRUE)
a<-table.element(a,hyperlink('basics.htm','PACF(k)','click here for more information about the Partial Autocorrelation Function'),header=TRUE)
a<-table.element(a,'T-STAT',header=TRUE)
a<-table.element(a,'P-value',header=TRUE)
a<-table.row.end(a)
for (i in 1:par1) {
a<-table.row.start(a)
a<-table.element(a,i-1,header=TRUE)
a<-table.element(a,round(mypacf[i],6))
mytstat <- mypacf[i]*sqrtn
a<-table.element(a,round(mytstat,4))
a<-table.element(a,round(1-pt(mytstat,lengthx),6))
a<-table.row.end(a)
}
a<-table.end(a)
table.save(a,file='mytable1.tab')