Free Statistics

of Irreproducible Research!

Author's title

Author*Unverified author*
R Software Modulerwasp_autocorrelation.wasp
Title produced by software(Partial) Autocorrelation Function
Date of computationFri, 23 Nov 2007 06:37:14 -0700
Cite this page as followsStatistical Computations at FreeStatistics.org, Office for Research Development and Education, URL https://freestatistics.org/blog/index.php?v=date/2007/Nov/23/t11958246339cgy55voxuofgph.htm/, Retrieved Sun, 28 Apr 2024 23:13:54 +0000
Statistical Computations at FreeStatistics.org, Office for Research Development and Education, URL https://freestatistics.org/blog/index.php?pk=6168, Retrieved Sun, 28 Apr 2024 23:13:54 +0000
QR Codes:

Original text written by user:
IsPrivate?No (this computation is public)
User-defined keywords
Estimated Impact223
Family? (F = Feedback message, R = changed R code, M = changed R Module, P = changed Parameters, D = changed Data)
-     [(Partial) Autocorrelation Function] [Partiel Autocorre...] [2007-11-22 13:00:02] [ced1562ed3c62c3bc1f3b66b8f83b537]
-   PD    [(Partial) Autocorrelation Function] [WS 9] [2007-11-23 13:37:14] [d41d8cd98f00b204e9800998ecf8427e] [Current]
Feedback Forum

Post a new message
Dataseries X:
373
371
354
357
363
364
363
358
357
357
380
378
376
380
379
384
392
394
392
396
392
396
419
421
420
418
410
418
426
428
430
424
423
427
441
449
452
462
455
461
461
463
462
456
455
456
472
472
471
465
459
465
468
467
463
460
462
461
476
476
471
453
443
442
444
438
427
424
416
406
431
434
418


Summary of compuational transaction
Raw Inputview raw input (R code)
Raw Outputview raw output of R engine
Computing time3 seconds
R Server'Herman Ole Andreas Wold' @ 193.190.124.10:1001

\begin{tabular}{lllllllll}
\hline
Summary of compuational transaction \tabularnewline
Raw Input & view raw input (R code)  \tabularnewline
Raw Output & view raw output of R engine  \tabularnewline
Computing time & 3 seconds \tabularnewline
R Server & 'Herman Ole Andreas Wold' @ 193.190.124.10:1001 \tabularnewline
\hline
\end{tabular}
%Source: https://freestatistics.org/blog/index.php?pk=6168&T=0

[TABLE]
[ROW][C]Summary of compuational transaction[/C][/ROW]
[ROW][C]Raw Input[/C][C]view raw input (R code) [/C][/ROW]
[ROW][C]Raw Output[/C][C]view raw output of R engine [/C][/ROW]
[ROW][C]Computing time[/C][C]3 seconds[/C][/ROW]
[ROW][C]R Server[/C][C]'Herman Ole Andreas Wold' @ 193.190.124.10:1001[/C][/ROW]
[/TABLE]
Source: https://freestatistics.org/blog/index.php?pk=6168&T=0

Globally Unique Identifier (entire table): ba.freestatistics.org/blog/index.php?pk=6168&T=0

As an alternative you can also use a QR Code:  

The GUIDs for individual cells are displayed in the table below:

Summary of compuational transaction
Raw Inputview raw input (R code)
Raw Outputview raw output of R engine
Computing time3 seconds
R Server'Herman Ole Andreas Wold' @ 193.190.124.10:1001


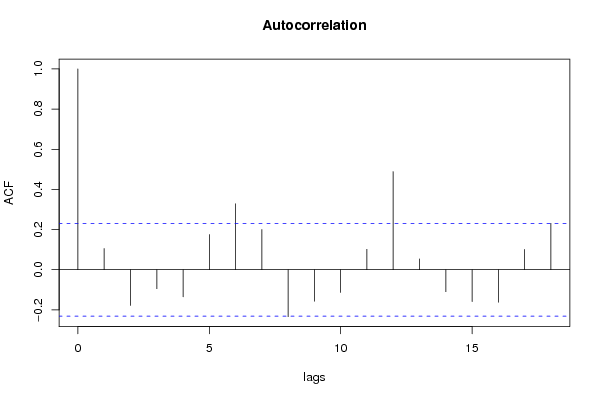
Autocorrelation Function
Time lag kACF(k)T-STATP-value
018.48530
10.1054760.8950.186887
2-0.177777-1.50850.932097
3-0.094147-0.79890.786503
4-0.134954-1.14510.872026
50.1751071.48580.070845
60.3285152.78750.003394
70.199891.69610.047091
8-0.233642-1.98250.974381
9-0.156548-1.32840.905872
10-0.112831-0.95740.829216
110.1017150.86310.195479
120.4886584.14644.6e-05
130.0537760.45630.324773
14-0.109118-0.92590.821204
15-0.158783-1.34730.908948
16-0.161594-1.37120.91271
170.1011280.85810.196842

\begin{tabular}{lllllllll}
\hline
Autocorrelation Function \tabularnewline
Time lag k & ACF(k) & T-STAT & P-value \tabularnewline
0 & 1 & 8.4853 & 0 \tabularnewline
1 & 0.105476 & 0.895 & 0.186887 \tabularnewline
2 & -0.177777 & -1.5085 & 0.932097 \tabularnewline
3 & -0.094147 & -0.7989 & 0.786503 \tabularnewline
4 & -0.134954 & -1.1451 & 0.872026 \tabularnewline
5 & 0.175107 & 1.4858 & 0.070845 \tabularnewline
6 & 0.328515 & 2.7875 & 0.003394 \tabularnewline
7 & 0.19989 & 1.6961 & 0.047091 \tabularnewline
8 & -0.233642 & -1.9825 & 0.974381 \tabularnewline
9 & -0.156548 & -1.3284 & 0.905872 \tabularnewline
10 & -0.112831 & -0.9574 & 0.829216 \tabularnewline
11 & 0.101715 & 0.8631 & 0.195479 \tabularnewline
12 & 0.488658 & 4.1464 & 4.6e-05 \tabularnewline
13 & 0.053776 & 0.4563 & 0.324773 \tabularnewline
14 & -0.109118 & -0.9259 & 0.821204 \tabularnewline
15 & -0.158783 & -1.3473 & 0.908948 \tabularnewline
16 & -0.161594 & -1.3712 & 0.91271 \tabularnewline
17 & 0.101128 & 0.8581 & 0.196842 \tabularnewline
\hline
\end{tabular}
%Source: https://freestatistics.org/blog/index.php?pk=6168&T=1

[TABLE]
[ROW][C]Autocorrelation Function[/C][/ROW]
[ROW][C]Time lag k[/C][C]ACF(k)[/C][C]T-STAT[/C][C]P-value[/C][/ROW]
[ROW][C]0[/C][C]1[/C][C]8.4853[/C][C]0[/C][/ROW]
[ROW][C]1[/C][C]0.105476[/C][C]0.895[/C][C]0.186887[/C][/ROW]
[ROW][C]2[/C][C]-0.177777[/C][C]-1.5085[/C][C]0.932097[/C][/ROW]
[ROW][C]3[/C][C]-0.094147[/C][C]-0.7989[/C][C]0.786503[/C][/ROW]
[ROW][C]4[/C][C]-0.134954[/C][C]-1.1451[/C][C]0.872026[/C][/ROW]
[ROW][C]5[/C][C]0.175107[/C][C]1.4858[/C][C]0.070845[/C][/ROW]
[ROW][C]6[/C][C]0.328515[/C][C]2.7875[/C][C]0.003394[/C][/ROW]
[ROW][C]7[/C][C]0.19989[/C][C]1.6961[/C][C]0.047091[/C][/ROW]
[ROW][C]8[/C][C]-0.233642[/C][C]-1.9825[/C][C]0.974381[/C][/ROW]
[ROW][C]9[/C][C]-0.156548[/C][C]-1.3284[/C][C]0.905872[/C][/ROW]
[ROW][C]10[/C][C]-0.112831[/C][C]-0.9574[/C][C]0.829216[/C][/ROW]
[ROW][C]11[/C][C]0.101715[/C][C]0.8631[/C][C]0.195479[/C][/ROW]
[ROW][C]12[/C][C]0.488658[/C][C]4.1464[/C][C]4.6e-05[/C][/ROW]
[ROW][C]13[/C][C]0.053776[/C][C]0.4563[/C][C]0.324773[/C][/ROW]
[ROW][C]14[/C][C]-0.109118[/C][C]-0.9259[/C][C]0.821204[/C][/ROW]
[ROW][C]15[/C][C]-0.158783[/C][C]-1.3473[/C][C]0.908948[/C][/ROW]
[ROW][C]16[/C][C]-0.161594[/C][C]-1.3712[/C][C]0.91271[/C][/ROW]
[ROW][C]17[/C][C]0.101128[/C][C]0.8581[/C][C]0.196842[/C][/ROW]
[/TABLE]
Source: https://freestatistics.org/blog/index.php?pk=6168&T=1

Globally Unique Identifier (entire table): ba.freestatistics.org/blog/index.php?pk=6168&T=1

As an alternative you can also use a QR Code:  

The GUIDs for individual cells are displayed in the table below:

Autocorrelation Function
Time lag kACF(k)T-STATP-value
018.48530
10.1054760.8950.186887
2-0.177777-1.50850.932097
3-0.094147-0.79890.786503
4-0.134954-1.14510.872026
50.1751071.48580.070845
60.3285152.78750.003394
70.199891.69610.047091
8-0.233642-1.98250.974381
9-0.156548-1.32840.905872
10-0.112831-0.95740.829216
110.1017150.86310.195479
120.4886584.14644.6e-05
130.0537760.45630.324773
14-0.109118-0.92590.821204
15-0.158783-1.34730.908948
16-0.161594-1.37120.91271
170.1011280.85810.196842


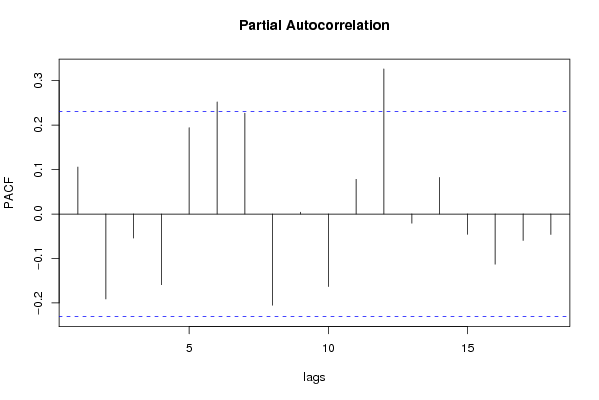
Partial Autocorrelation Function
Time lag kPACF(k)T-STATP-value
00.1054760.8950.186887
1-0.191027-1.62090.945297
2-0.054226-0.46010.676592
3-0.159088-1.34990.909363
40.1941751.64760.051893
50.252112.13920.017905
60.22691.92530.029071
7-0.205262-1.74170.957085
80.0042090.03570.485805
9-0.163321-1.38580.914962
100.0780640.66240.254916
110.326382.76940.003569
12-0.020583-0.17470.56908
130.0822850.69820.243647
14-0.045595-0.38690.650011
15-0.112857-0.95760.829272
16-0.059392-0.5040.692085
17-0.046117-0.39130.651641

\begin{tabular}{lllllllll}
\hline
Partial Autocorrelation Function \tabularnewline
Time lag k & PACF(k) & T-STAT & P-value \tabularnewline
0 & 0.105476 & 0.895 & 0.186887 \tabularnewline
1 & -0.191027 & -1.6209 & 0.945297 \tabularnewline
2 & -0.054226 & -0.4601 & 0.676592 \tabularnewline
3 & -0.159088 & -1.3499 & 0.909363 \tabularnewline
4 & 0.194175 & 1.6476 & 0.051893 \tabularnewline
5 & 0.25211 & 2.1392 & 0.017905 \tabularnewline
6 & 0.2269 & 1.9253 & 0.029071 \tabularnewline
7 & -0.205262 & -1.7417 & 0.957085 \tabularnewline
8 & 0.004209 & 0.0357 & 0.485805 \tabularnewline
9 & -0.163321 & -1.3858 & 0.914962 \tabularnewline
10 & 0.078064 & 0.6624 & 0.254916 \tabularnewline
11 & 0.32638 & 2.7694 & 0.003569 \tabularnewline
12 & -0.020583 & -0.1747 & 0.56908 \tabularnewline
13 & 0.082285 & 0.6982 & 0.243647 \tabularnewline
14 & -0.045595 & -0.3869 & 0.650011 \tabularnewline
15 & -0.112857 & -0.9576 & 0.829272 \tabularnewline
16 & -0.059392 & -0.504 & 0.692085 \tabularnewline
17 & -0.046117 & -0.3913 & 0.651641 \tabularnewline
\hline
\end{tabular}
%Source: https://freestatistics.org/blog/index.php?pk=6168&T=2

[TABLE]
[ROW][C]Partial Autocorrelation Function[/C][/ROW]
[ROW][C]Time lag k[/C][C]PACF(k)[/C][C]T-STAT[/C][C]P-value[/C][/ROW]
[ROW][C]0[/C][C]0.105476[/C][C]0.895[/C][C]0.186887[/C][/ROW]
[ROW][C]1[/C][C]-0.191027[/C][C]-1.6209[/C][C]0.945297[/C][/ROW]
[ROW][C]2[/C][C]-0.054226[/C][C]-0.4601[/C][C]0.676592[/C][/ROW]
[ROW][C]3[/C][C]-0.159088[/C][C]-1.3499[/C][C]0.909363[/C][/ROW]
[ROW][C]4[/C][C]0.194175[/C][C]1.6476[/C][C]0.051893[/C][/ROW]
[ROW][C]5[/C][C]0.25211[/C][C]2.1392[/C][C]0.017905[/C][/ROW]
[ROW][C]6[/C][C]0.2269[/C][C]1.9253[/C][C]0.029071[/C][/ROW]
[ROW][C]7[/C][C]-0.205262[/C][C]-1.7417[/C][C]0.957085[/C][/ROW]
[ROW][C]8[/C][C]0.004209[/C][C]0.0357[/C][C]0.485805[/C][/ROW]
[ROW][C]9[/C][C]-0.163321[/C][C]-1.3858[/C][C]0.914962[/C][/ROW]
[ROW][C]10[/C][C]0.078064[/C][C]0.6624[/C][C]0.254916[/C][/ROW]
[ROW][C]11[/C][C]0.32638[/C][C]2.7694[/C][C]0.003569[/C][/ROW]
[ROW][C]12[/C][C]-0.020583[/C][C]-0.1747[/C][C]0.56908[/C][/ROW]
[ROW][C]13[/C][C]0.082285[/C][C]0.6982[/C][C]0.243647[/C][/ROW]
[ROW][C]14[/C][C]-0.045595[/C][C]-0.3869[/C][C]0.650011[/C][/ROW]
[ROW][C]15[/C][C]-0.112857[/C][C]-0.9576[/C][C]0.829272[/C][/ROW]
[ROW][C]16[/C][C]-0.059392[/C][C]-0.504[/C][C]0.692085[/C][/ROW]
[ROW][C]17[/C][C]-0.046117[/C][C]-0.3913[/C][C]0.651641[/C][/ROW]
[/TABLE]
Source: https://freestatistics.org/blog/index.php?pk=6168&T=2

Globally Unique Identifier (entire table): ba.freestatistics.org/blog/index.php?pk=6168&T=2

As an alternative you can also use a QR Code:  

The GUIDs for individual cells are displayed in the table below:

Partial Autocorrelation Function
Time lag kPACF(k)T-STATP-value
00.1054760.8950.186887
1-0.191027-1.62090.945297
2-0.054226-0.46010.676592
3-0.159088-1.34990.909363
40.1941751.64760.051893
50.252112.13920.017905
60.22691.92530.029071
7-0.205262-1.74170.957085
80.0042090.03570.485805
9-0.163321-1.38580.914962
100.0780640.66240.254916
110.326382.76940.003569
12-0.020583-0.17470.56908
130.0822850.69820.243647
14-0.045595-0.38690.650011
15-0.112857-0.95760.829272
16-0.059392-0.5040.692085
17-0.046117-0.39130.651641


Parameters (Session):
par1 = Default ; par2 = 1 ; par3 = 1 ; par4 = 0 ; par5 = 12 ;
Parameters (R input):
par1 = Default ; par2 = 1 ; par3 = 1 ; par4 = 0 ; par5 = 12 ;
R code (references can be found in the software module):
if (par1 == 'Default') {
par1 = 10*log10(length(x))
} else {
par1 <- as.numeric(par1)
}
par2 <- as.numeric(par2)
par3 <- as.numeric(par3)
par4 <- as.numeric(par4)
par5 <- as.numeric(par5)
if (par2 == 0) {
x <- log(x)
} else {
x <- (x ^ par2 - 1) / par2
}
if (par3 > 0) x <- diff(x,lag=1,difference=par3)
if (par4 > 0) x <- diff(x,lag=par5,difference=par4)
bitmap(file='pic1.png')
racf <- acf(x,par1,main='Autocorrelation',xlab='lags',ylab='ACF')
dev.off()
bitmap(file='pic2.png')
rpacf <- pacf(x,par1,main='Partial Autocorrelation',xlab='lags',ylab='PACF')
dev.off()
(myacf <- c(racf$acf))
(mypacf <- c(rpacf$acf))
lengthx <- length(x)
sqrtn <- sqrt(lengthx)
load(file='createtable')
a<-table.start()
a<-table.row.start(a)
a<-table.element(a,'Autocorrelation Function',4,TRUE)
a<-table.row.end(a)
a<-table.row.start(a)
a<-table.element(a,'Time lag k',header=TRUE)
a<-table.element(a,hyperlink('basics.htm','ACF(k)','click here for more information about the Autocorrelation Function'),header=TRUE)
a<-table.element(a,'T-STAT',header=TRUE)
a<-table.element(a,'P-value',header=TRUE)
a<-table.row.end(a)
for (i in 1:par1) {
a<-table.row.start(a)
a<-table.element(a,i-1,header=TRUE)
a<-table.element(a,round(myacf[i],6))
mytstat <- myacf[i]*sqrtn
a<-table.element(a,round(mytstat,4))
a<-table.element(a,round(1-pt(mytstat,lengthx),6))
a<-table.row.end(a)
}
a<-table.end(a)
table.save(a,file='mytable.tab')
a<-table.start()
a<-table.row.start(a)
a<-table.element(a,'Partial Autocorrelation Function',4,TRUE)
a<-table.row.end(a)
a<-table.row.start(a)
a<-table.element(a,'Time lag k',header=TRUE)
a<-table.element(a,hyperlink('basics.htm','PACF(k)','click here for more information about the Partial Autocorrelation Function'),header=TRUE)
a<-table.element(a,'T-STAT',header=TRUE)
a<-table.element(a,'P-value',header=TRUE)
a<-table.row.end(a)
for (i in 1:par1) {
a<-table.row.start(a)
a<-table.element(a,i-1,header=TRUE)
a<-table.element(a,round(mypacf[i],6))
mytstat <- mypacf[i]*sqrtn
a<-table.element(a,round(mytstat,4))
a<-table.element(a,round(1-pt(mytstat,lengthx),6))
a<-table.row.end(a)
}
a<-table.end(a)
table.save(a,file='mytable1.tab')