Free Statistics

of Irreproducible Research!

Author's title

Author*Unverified author*
R Software Modulerwasp_centraltendency.wasp
Title produced by softwareCentral Tendency
Date of computationFri, 23 Nov 2007 02:36:09 -0700
Cite this page as followsStatistical Computations at FreeStatistics.org, Office for Research Development and Education, URL https://freestatistics.org/blog/index.php?v=date/2007/Nov/23/t119581007123t1ozrbkq6h6w7.htm/, Retrieved Sun, 28 Apr 2024 22:11:10 +0000
Statistical Computations at FreeStatistics.org, Office for Research Development and Education, URL https://freestatistics.org/blog/index.php?pk=6120, Retrieved Sun, 28 Apr 2024 22:11:10 +0000
QR Codes:

Original text written by user:
IsPrivate?No (this computation is public)
User-defined keywordscentral tendency - totale werkloosheid
Estimated Impact227
Family? (F = Feedback message, R = changed R code, M = changed R Module, P = changed Parameters, D = changed Data)
-       [Central Tendency] [investigating ass...] [2007-11-23 09:36:09] [ac6f409873aab27747ac7f3d36ded223] [Current]
Feedback Forum

Post a new message
Dataseries X:
513
503
471
471
476
475
470
461
455
456
517
525
523
519
509
512
519
517
510
509
501
507
569
580
578
565
547
555
562
561
555
544
537
543
594
611
613
611
594
595
591
589
584
573
567
569
621
629
628
612
595
597
593
590
580
574
573
573
620
626
620
588
566
557
561
549
532
526
511
499
555
565
542


Summary of compuational transaction
Raw Inputview raw input (R code)
Raw Outputview raw output of R engine
Computing time1 seconds
R Server'Gwilym Jenkins' @ 72.249.127.135

\begin{tabular}{lllllllll}
\hline
Summary of compuational transaction \tabularnewline
Raw Input & view raw input (R code)  \tabularnewline
Raw Output & view raw output of R engine  \tabularnewline
Computing time & 1 seconds \tabularnewline
R Server & 'Gwilym Jenkins' @ 72.249.127.135 \tabularnewline
\hline
\end{tabular}
%Source: https://freestatistics.org/blog/index.php?pk=6120&T=0

[TABLE]
[ROW][C]Summary of compuational transaction[/C][/ROW]
[ROW][C]Raw Input[/C][C]view raw input (R code) [/C][/ROW]
[ROW][C]Raw Output[/C][C]view raw output of R engine [/C][/ROW]
[ROW][C]Computing time[/C][C]1 seconds[/C][/ROW]
[ROW][C]R Server[/C][C]'Gwilym Jenkins' @ 72.249.127.135[/C][/ROW]
[/TABLE]
Source: https://freestatistics.org/blog/index.php?pk=6120&T=0

Globally Unique Identifier (entire table): ba.freestatistics.org/blog/index.php?pk=6120&T=0

As an alternative you can also use a QR Code:  

The GUIDs for individual cells are displayed in the table below:

Summary of compuational transaction
Raw Inputview raw input (R code)
Raw Outputview raw output of R engine
Computing time1 seconds
R Server'Gwilym Jenkins' @ 72.249.127.135


Central Tendency - Ungrouped Data
MeasureValueS.E.Value/S.E.
Arithmetic Mean551.8904109589045.43214548616753101.597133648987
Geometric Mean549.919974939706
Harmonic Mean547.905173014011
Quadratic Mean553.811896259331
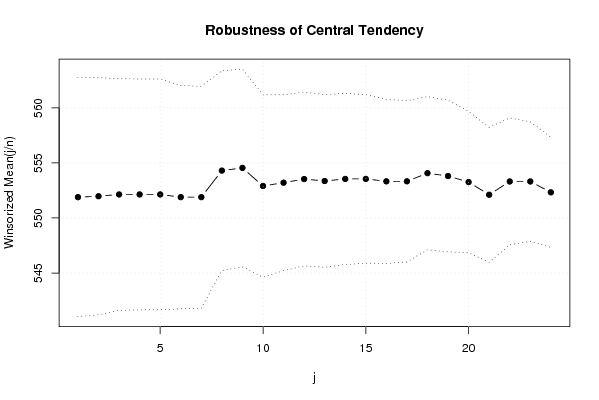
Winsorized Mean ( 1 / 24 )551.8904109589045.42608284628349101.710649577883
Winsorized Mean ( 2 / 24 )551.9726027397265.38261946589102102.547208889186
Winsorized Mean ( 3 / 24 )552.136986301375.26075455218458104.953953054527
Winsorized Mean ( 4 / 24 )552.136986301375.23901020766782105.389561084126
Winsorized Mean ( 5 / 24 )552.136986301375.23901020766782105.389561084126
Winsorized Mean ( 6 / 24 )551.8904109589045.06902738967335108.875010634825
Winsorized Mean ( 7 / 24 )551.8904109589045.03290397197378109.656455603397
Winsorized Mean ( 8 / 24 )554.3013698630144.53427186646554122.247052269297
Winsorized Mean ( 9 / 24 )554.547945205484.49297782456958123.425480128784
Winsorized Mean ( 10 / 24 )552.9041095890414.13702536092924133.647744780769
Winsorized Mean ( 11 / 24 )553.2054794520553.99385748422543138.514076087355
Winsorized Mean ( 12 / 24 )553.5342465753423.94164444816837140.432312922735
Winsorized Mean ( 13 / 24 )553.3561643835623.91579801224272141.313766096590
Winsorized Mean ( 14 / 24 )553.547945205483.88578572571865142.454572711444
Winsorized Mean ( 15 / 24 )553.547945205483.82434130458584144.743343001763
Winsorized Mean ( 16 / 24 )553.3287671232883.72836502796883148.410566822835
Winsorized Mean ( 17 / 24 )553.3287671232883.66007371124345151.179678546775
Winsorized Mean ( 18 / 24 )554.0684931506853.47716670114487159.344817425134
Winsorized Mean ( 19 / 24 )553.8082191780823.44104829509785160.941716501638
Winsorized Mean ( 20 / 24 )553.2602739726033.21117646054426172.292080728205
Winsorized Mean ( 21 / 24 )552.1095890410963.06180387011557180.321670643214
Winsorized Mean ( 22 / 24 )553.3150684931512.88318200518298191.911252046690
Winsorized Mean ( 23 / 24 )553.3150684931512.71109372585749204.092932389544
Winsorized Mean ( 24 / 24 )552.3287671232882.50076508799052220.863914717839
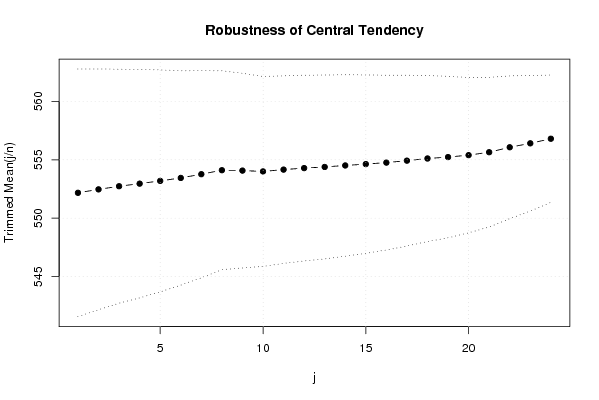
Trimmed Mean ( 1 / 24 )552.1690140845075.30282131033028104.127403465178
Trimmed Mean ( 2 / 24 )552.4637681159425.1563607459556107.142187161608
Trimmed Mean ( 3 / 24 )552.7313432835825.00956038001978110.335299178767
Trimmed Mean ( 4 / 24 )552.9538461538464.88976711973148113.083881627518
Trimmed Mean ( 5 / 24 )553.1904761904764.75324866096906116.381556204488
Trimmed Mean ( 6 / 24 )553.442622950824.58755292640299120.640051859797
Trimmed Mean ( 7 / 24 )553.7627118644074.43541476524058124.850265685214
Trimmed Mean ( 8 / 24 )554.1052631578954.25809594587647130.129820981251
Trimmed Mean ( 9 / 24 )554.0727272727274.16825057130949132.926924088122
Trimmed Mean ( 10 / 24 )5544.0651444167671136.280521231908
Trimmed Mean ( 11 / 24 )554.1568627450984.01432460063098138.044856327262
Trimmed Mean ( 12 / 24 )554.2857142857143.97697454487859139.373714372777
Trimmed Mean ( 13 / 24 )554.3829787234043.93583517338011140.855232575021
Trimmed Mean ( 14 / 24 )554.5111111111113.88348253351335142.787074829316
Trimmed Mean ( 15 / 24 )554.6279069767443.8175475327492145.283824816539
Trimmed Mean ( 16 / 24 )554.7560975609763.74031766092669148.317909827886
Trimmed Mean ( 17 / 24 )554.9230769230773.65524868315984151.815409846031
Trimmed Mean ( 18 / 24 )555.1081081081083.55264647448185156.251997516603
Trimmed Mean ( 19 / 24 )555.2285714285713.45562158347978160.674008428163
Trimmed Mean ( 20 / 24 )555.3939393939393.32487735987638167.041932462312
Trimmed Mean ( 21 / 24 )555.6451612903233.20099056815424173.585379106793
Trimmed Mean ( 22 / 24 )556.0689655172413.05690328934379181.905972444621
Trimmed Mean ( 23 / 24 )556.4074074074072.90360776630861191.626229225435
Trimmed Mean ( 24 / 24 )556.82.72702524129621204.178528151555
Median561
Midrange542
Midmean - Weighted Average at Xnp554.166666666667
Midmean - Weighted Average at X(n+1)p555.108108108108
Midmean - Empirical Distribution Function555.108108108108
Midmean - Empirical Distribution Function - Averaging555.108108108108
Midmean - Empirical Distribution Function - Interpolation555.108108108108
Midmean - Closest Observation554
Midmean - True Basic - Statistics Graphics Toolkit555.108108108108
Midmean - MS Excel (old versions)555.108108108108
Number of observations73

\begin{tabular}{lllllllll}
\hline
Central Tendency - Ungrouped Data \tabularnewline
Measure & Value & S.E. & Value/S.E. \tabularnewline
Arithmetic Mean & 551.890410958904 & 5.43214548616753 & 101.597133648987 \tabularnewline
Geometric Mean & 549.919974939706 &  &  \tabularnewline
Harmonic Mean & 547.905173014011 &  &  \tabularnewline
Quadratic Mean & 553.811896259331 &  &  \tabularnewline
Winsorized Mean ( 1 / 24 ) & 551.890410958904 & 5.42608284628349 & 101.710649577883 \tabularnewline
Winsorized Mean ( 2 / 24 ) & 551.972602739726 & 5.38261946589102 & 102.547208889186 \tabularnewline
Winsorized Mean ( 3 / 24 ) & 552.13698630137 & 5.26075455218458 & 104.953953054527 \tabularnewline
Winsorized Mean ( 4 / 24 ) & 552.13698630137 & 5.23901020766782 & 105.389561084126 \tabularnewline
Winsorized Mean ( 5 / 24 ) & 552.13698630137 & 5.23901020766782 & 105.389561084126 \tabularnewline
Winsorized Mean ( 6 / 24 ) & 551.890410958904 & 5.06902738967335 & 108.875010634825 \tabularnewline
Winsorized Mean ( 7 / 24 ) & 551.890410958904 & 5.03290397197378 & 109.656455603397 \tabularnewline
Winsorized Mean ( 8 / 24 ) & 554.301369863014 & 4.53427186646554 & 122.247052269297 \tabularnewline
Winsorized Mean ( 9 / 24 ) & 554.54794520548 & 4.49297782456958 & 123.425480128784 \tabularnewline
Winsorized Mean ( 10 / 24 ) & 552.904109589041 & 4.13702536092924 & 133.647744780769 \tabularnewline
Winsorized Mean ( 11 / 24 ) & 553.205479452055 & 3.99385748422543 & 138.514076087355 \tabularnewline
Winsorized Mean ( 12 / 24 ) & 553.534246575342 & 3.94164444816837 & 140.432312922735 \tabularnewline
Winsorized Mean ( 13 / 24 ) & 553.356164383562 & 3.91579801224272 & 141.313766096590 \tabularnewline
Winsorized Mean ( 14 / 24 ) & 553.54794520548 & 3.88578572571865 & 142.454572711444 \tabularnewline
Winsorized Mean ( 15 / 24 ) & 553.54794520548 & 3.82434130458584 & 144.743343001763 \tabularnewline
Winsorized Mean ( 16 / 24 ) & 553.328767123288 & 3.72836502796883 & 148.410566822835 \tabularnewline
Winsorized Mean ( 17 / 24 ) & 553.328767123288 & 3.66007371124345 & 151.179678546775 \tabularnewline
Winsorized Mean ( 18 / 24 ) & 554.068493150685 & 3.47716670114487 & 159.344817425134 \tabularnewline
Winsorized Mean ( 19 / 24 ) & 553.808219178082 & 3.44104829509785 & 160.941716501638 \tabularnewline
Winsorized Mean ( 20 / 24 ) & 553.260273972603 & 3.21117646054426 & 172.292080728205 \tabularnewline
Winsorized Mean ( 21 / 24 ) & 552.109589041096 & 3.06180387011557 & 180.321670643214 \tabularnewline
Winsorized Mean ( 22 / 24 ) & 553.315068493151 & 2.88318200518298 & 191.911252046690 \tabularnewline
Winsorized Mean ( 23 / 24 ) & 553.315068493151 & 2.71109372585749 & 204.092932389544 \tabularnewline
Winsorized Mean ( 24 / 24 ) & 552.328767123288 & 2.50076508799052 & 220.863914717839 \tabularnewline
Trimmed Mean ( 1 / 24 ) & 552.169014084507 & 5.30282131033028 & 104.127403465178 \tabularnewline
Trimmed Mean ( 2 / 24 ) & 552.463768115942 & 5.1563607459556 & 107.142187161608 \tabularnewline
Trimmed Mean ( 3 / 24 ) & 552.731343283582 & 5.00956038001978 & 110.335299178767 \tabularnewline
Trimmed Mean ( 4 / 24 ) & 552.953846153846 & 4.88976711973148 & 113.083881627518 \tabularnewline
Trimmed Mean ( 5 / 24 ) & 553.190476190476 & 4.75324866096906 & 116.381556204488 \tabularnewline
Trimmed Mean ( 6 / 24 ) & 553.44262295082 & 4.58755292640299 & 120.640051859797 \tabularnewline
Trimmed Mean ( 7 / 24 ) & 553.762711864407 & 4.43541476524058 & 124.850265685214 \tabularnewline
Trimmed Mean ( 8 / 24 ) & 554.105263157895 & 4.25809594587647 & 130.129820981251 \tabularnewline
Trimmed Mean ( 9 / 24 ) & 554.072727272727 & 4.16825057130949 & 132.926924088122 \tabularnewline
Trimmed Mean ( 10 / 24 ) & 554 & 4.0651444167671 & 136.280521231908 \tabularnewline
Trimmed Mean ( 11 / 24 ) & 554.156862745098 & 4.01432460063098 & 138.044856327262 \tabularnewline
Trimmed Mean ( 12 / 24 ) & 554.285714285714 & 3.97697454487859 & 139.373714372777 \tabularnewline
Trimmed Mean ( 13 / 24 ) & 554.382978723404 & 3.93583517338011 & 140.855232575021 \tabularnewline
Trimmed Mean ( 14 / 24 ) & 554.511111111111 & 3.88348253351335 & 142.787074829316 \tabularnewline
Trimmed Mean ( 15 / 24 ) & 554.627906976744 & 3.8175475327492 & 145.283824816539 \tabularnewline
Trimmed Mean ( 16 / 24 ) & 554.756097560976 & 3.74031766092669 & 148.317909827886 \tabularnewline
Trimmed Mean ( 17 / 24 ) & 554.923076923077 & 3.65524868315984 & 151.815409846031 \tabularnewline
Trimmed Mean ( 18 / 24 ) & 555.108108108108 & 3.55264647448185 & 156.251997516603 \tabularnewline
Trimmed Mean ( 19 / 24 ) & 555.228571428571 & 3.45562158347978 & 160.674008428163 \tabularnewline
Trimmed Mean ( 20 / 24 ) & 555.393939393939 & 3.32487735987638 & 167.041932462312 \tabularnewline
Trimmed Mean ( 21 / 24 ) & 555.645161290323 & 3.20099056815424 & 173.585379106793 \tabularnewline
Trimmed Mean ( 22 / 24 ) & 556.068965517241 & 3.05690328934379 & 181.905972444621 \tabularnewline
Trimmed Mean ( 23 / 24 ) & 556.407407407407 & 2.90360776630861 & 191.626229225435 \tabularnewline
Trimmed Mean ( 24 / 24 ) & 556.8 & 2.72702524129621 & 204.178528151555 \tabularnewline
Median & 561 &  &  \tabularnewline
Midrange & 542 &  &  \tabularnewline
Midmean - Weighted Average at Xnp & 554.166666666667 &  &  \tabularnewline
Midmean - Weighted Average at X(n+1)p & 555.108108108108 &  &  \tabularnewline
Midmean - Empirical Distribution Function & 555.108108108108 &  &  \tabularnewline
Midmean - Empirical Distribution Function - Averaging & 555.108108108108 &  &  \tabularnewline
Midmean - Empirical Distribution Function - Interpolation & 555.108108108108 &  &  \tabularnewline
Midmean - Closest Observation & 554 &  &  \tabularnewline
Midmean - True Basic - Statistics Graphics Toolkit & 555.108108108108 &  &  \tabularnewline
Midmean - MS Excel (old versions) & 555.108108108108 &  &  \tabularnewline
Number of observations & 73 &  &  \tabularnewline
\hline
\end{tabular}
%Source: https://freestatistics.org/blog/index.php?pk=6120&T=1

[TABLE]
[ROW][C]Central Tendency - Ungrouped Data[/C][/ROW]
[ROW][C]Measure[/C][C]Value[/C][C]S.E.[/C][C]Value/S.E.[/C][/ROW]
[ROW][C]Arithmetic Mean[/C][C]551.890410958904[/C][C]5.43214548616753[/C][C]101.597133648987[/C][/ROW]
[ROW][C]Geometric Mean[/C][C]549.919974939706[/C][C][/C][C][/C][/ROW]
[ROW][C]Harmonic Mean[/C][C]547.905173014011[/C][C][/C][C][/C][/ROW]
[ROW][C]Quadratic Mean[/C][C]553.811896259331[/C][C][/C][C][/C][/ROW]
[ROW][C]Winsorized Mean ( 1 / 24 )[/C][C]551.890410958904[/C][C]5.42608284628349[/C][C]101.710649577883[/C][/ROW]
[ROW][C]Winsorized Mean ( 2 / 24 )[/C][C]551.972602739726[/C][C]5.38261946589102[/C][C]102.547208889186[/C][/ROW]
[ROW][C]Winsorized Mean ( 3 / 24 )[/C][C]552.13698630137[/C][C]5.26075455218458[/C][C]104.953953054527[/C][/ROW]
[ROW][C]Winsorized Mean ( 4 / 24 )[/C][C]552.13698630137[/C][C]5.23901020766782[/C][C]105.389561084126[/C][/ROW]
[ROW][C]Winsorized Mean ( 5 / 24 )[/C][C]552.13698630137[/C][C]5.23901020766782[/C][C]105.389561084126[/C][/ROW]
[ROW][C]Winsorized Mean ( 6 / 24 )[/C][C]551.890410958904[/C][C]5.06902738967335[/C][C]108.875010634825[/C][/ROW]
[ROW][C]Winsorized Mean ( 7 / 24 )[/C][C]551.890410958904[/C][C]5.03290397197378[/C][C]109.656455603397[/C][/ROW]
[ROW][C]Winsorized Mean ( 8 / 24 )[/C][C]554.301369863014[/C][C]4.53427186646554[/C][C]122.247052269297[/C][/ROW]
[ROW][C]Winsorized Mean ( 9 / 24 )[/C][C]554.54794520548[/C][C]4.49297782456958[/C][C]123.425480128784[/C][/ROW]
[ROW][C]Winsorized Mean ( 10 / 24 )[/C][C]552.904109589041[/C][C]4.13702536092924[/C][C]133.647744780769[/C][/ROW]
[ROW][C]Winsorized Mean ( 11 / 24 )[/C][C]553.205479452055[/C][C]3.99385748422543[/C][C]138.514076087355[/C][/ROW]
[ROW][C]Winsorized Mean ( 12 / 24 )[/C][C]553.534246575342[/C][C]3.94164444816837[/C][C]140.432312922735[/C][/ROW]
[ROW][C]Winsorized Mean ( 13 / 24 )[/C][C]553.356164383562[/C][C]3.91579801224272[/C][C]141.313766096590[/C][/ROW]
[ROW][C]Winsorized Mean ( 14 / 24 )[/C][C]553.54794520548[/C][C]3.88578572571865[/C][C]142.454572711444[/C][/ROW]
[ROW][C]Winsorized Mean ( 15 / 24 )[/C][C]553.54794520548[/C][C]3.82434130458584[/C][C]144.743343001763[/C][/ROW]
[ROW][C]Winsorized Mean ( 16 / 24 )[/C][C]553.328767123288[/C][C]3.72836502796883[/C][C]148.410566822835[/C][/ROW]
[ROW][C]Winsorized Mean ( 17 / 24 )[/C][C]553.328767123288[/C][C]3.66007371124345[/C][C]151.179678546775[/C][/ROW]
[ROW][C]Winsorized Mean ( 18 / 24 )[/C][C]554.068493150685[/C][C]3.47716670114487[/C][C]159.344817425134[/C][/ROW]
[ROW][C]Winsorized Mean ( 19 / 24 )[/C][C]553.808219178082[/C][C]3.44104829509785[/C][C]160.941716501638[/C][/ROW]
[ROW][C]Winsorized Mean ( 20 / 24 )[/C][C]553.260273972603[/C][C]3.21117646054426[/C][C]172.292080728205[/C][/ROW]
[ROW][C]Winsorized Mean ( 21 / 24 )[/C][C]552.109589041096[/C][C]3.06180387011557[/C][C]180.321670643214[/C][/ROW]
[ROW][C]Winsorized Mean ( 22 / 24 )[/C][C]553.315068493151[/C][C]2.88318200518298[/C][C]191.911252046690[/C][/ROW]
[ROW][C]Winsorized Mean ( 23 / 24 )[/C][C]553.315068493151[/C][C]2.71109372585749[/C][C]204.092932389544[/C][/ROW]
[ROW][C]Winsorized Mean ( 24 / 24 )[/C][C]552.328767123288[/C][C]2.50076508799052[/C][C]220.863914717839[/C][/ROW]
[ROW][C]Trimmed Mean ( 1 / 24 )[/C][C]552.169014084507[/C][C]5.30282131033028[/C][C]104.127403465178[/C][/ROW]
[ROW][C]Trimmed Mean ( 2 / 24 )[/C][C]552.463768115942[/C][C]5.1563607459556[/C][C]107.142187161608[/C][/ROW]
[ROW][C]Trimmed Mean ( 3 / 24 )[/C][C]552.731343283582[/C][C]5.00956038001978[/C][C]110.335299178767[/C][/ROW]
[ROW][C]Trimmed Mean ( 4 / 24 )[/C][C]552.953846153846[/C][C]4.88976711973148[/C][C]113.083881627518[/C][/ROW]
[ROW][C]Trimmed Mean ( 5 / 24 )[/C][C]553.190476190476[/C][C]4.75324866096906[/C][C]116.381556204488[/C][/ROW]
[ROW][C]Trimmed Mean ( 6 / 24 )[/C][C]553.44262295082[/C][C]4.58755292640299[/C][C]120.640051859797[/C][/ROW]
[ROW][C]Trimmed Mean ( 7 / 24 )[/C][C]553.762711864407[/C][C]4.43541476524058[/C][C]124.850265685214[/C][/ROW]
[ROW][C]Trimmed Mean ( 8 / 24 )[/C][C]554.105263157895[/C][C]4.25809594587647[/C][C]130.129820981251[/C][/ROW]
[ROW][C]Trimmed Mean ( 9 / 24 )[/C][C]554.072727272727[/C][C]4.16825057130949[/C][C]132.926924088122[/C][/ROW]
[ROW][C]Trimmed Mean ( 10 / 24 )[/C][C]554[/C][C]4.0651444167671[/C][C]136.280521231908[/C][/ROW]
[ROW][C]Trimmed Mean ( 11 / 24 )[/C][C]554.156862745098[/C][C]4.01432460063098[/C][C]138.044856327262[/C][/ROW]
[ROW][C]Trimmed Mean ( 12 / 24 )[/C][C]554.285714285714[/C][C]3.97697454487859[/C][C]139.373714372777[/C][/ROW]
[ROW][C]Trimmed Mean ( 13 / 24 )[/C][C]554.382978723404[/C][C]3.93583517338011[/C][C]140.855232575021[/C][/ROW]
[ROW][C]Trimmed Mean ( 14 / 24 )[/C][C]554.511111111111[/C][C]3.88348253351335[/C][C]142.787074829316[/C][/ROW]
[ROW][C]Trimmed Mean ( 15 / 24 )[/C][C]554.627906976744[/C][C]3.8175475327492[/C][C]145.283824816539[/C][/ROW]
[ROW][C]Trimmed Mean ( 16 / 24 )[/C][C]554.756097560976[/C][C]3.74031766092669[/C][C]148.317909827886[/C][/ROW]
[ROW][C]Trimmed Mean ( 17 / 24 )[/C][C]554.923076923077[/C][C]3.65524868315984[/C][C]151.815409846031[/C][/ROW]
[ROW][C]Trimmed Mean ( 18 / 24 )[/C][C]555.108108108108[/C][C]3.55264647448185[/C][C]156.251997516603[/C][/ROW]
[ROW][C]Trimmed Mean ( 19 / 24 )[/C][C]555.228571428571[/C][C]3.45562158347978[/C][C]160.674008428163[/C][/ROW]
[ROW][C]Trimmed Mean ( 20 / 24 )[/C][C]555.393939393939[/C][C]3.32487735987638[/C][C]167.041932462312[/C][/ROW]
[ROW][C]Trimmed Mean ( 21 / 24 )[/C][C]555.645161290323[/C][C]3.20099056815424[/C][C]173.585379106793[/C][/ROW]
[ROW][C]Trimmed Mean ( 22 / 24 )[/C][C]556.068965517241[/C][C]3.05690328934379[/C][C]181.905972444621[/C][/ROW]
[ROW][C]Trimmed Mean ( 23 / 24 )[/C][C]556.407407407407[/C][C]2.90360776630861[/C][C]191.626229225435[/C][/ROW]
[ROW][C]Trimmed Mean ( 24 / 24 )[/C][C]556.8[/C][C]2.72702524129621[/C][C]204.178528151555[/C][/ROW]
[ROW][C]Median[/C][C]561[/C][C][/C][C][/C][/ROW]
[ROW][C]Midrange[/C][C]542[/C][C][/C][C][/C][/ROW]
[ROW][C]Midmean - Weighted Average at Xnp[/C][C]554.166666666667[/C][C][/C][C][/C][/ROW]
[ROW][C]Midmean - Weighted Average at X(n+1)p[/C][C]555.108108108108[/C][C][/C][C][/C][/ROW]
[ROW][C]Midmean - Empirical Distribution Function[/C][C]555.108108108108[/C][C][/C][C][/C][/ROW]
[ROW][C]Midmean - Empirical Distribution Function - Averaging[/C][C]555.108108108108[/C][C][/C][C][/C][/ROW]
[ROW][C]Midmean - Empirical Distribution Function - Interpolation[/C][C]555.108108108108[/C][C][/C][C][/C][/ROW]
[ROW][C]Midmean - Closest Observation[/C][C]554[/C][C][/C][C][/C][/ROW]
[ROW][C]Midmean - True Basic - Statistics Graphics Toolkit[/C][C]555.108108108108[/C][C][/C][C][/C][/ROW]
[ROW][C]Midmean - MS Excel (old versions)[/C][C]555.108108108108[/C][C][/C][C][/C][/ROW]
[ROW][C]Number of observations[/C][C]73[/C][C][/C][C][/C][/ROW]
[/TABLE]
Source: https://freestatistics.org/blog/index.php?pk=6120&T=1

Globally Unique Identifier (entire table): ba.freestatistics.org/blog/index.php?pk=6120&T=1

As an alternative you can also use a QR Code:  

The GUIDs for individual cells are displayed in the table below:

Central Tendency - Ungrouped Data
MeasureValueS.E.Value/S.E.
Arithmetic Mean551.8904109589045.43214548616753101.597133648987
Geometric Mean549.919974939706
Harmonic Mean547.905173014011
Quadratic Mean553.811896259331
Winsorized Mean ( 1 / 24 )551.8904109589045.42608284628349101.710649577883
Winsorized Mean ( 2 / 24 )551.9726027397265.38261946589102102.547208889186
Winsorized Mean ( 3 / 24 )552.136986301375.26075455218458104.953953054527
Winsorized Mean ( 4 / 24 )552.136986301375.23901020766782105.389561084126
Winsorized Mean ( 5 / 24 )552.136986301375.23901020766782105.389561084126
Winsorized Mean ( 6 / 24 )551.8904109589045.06902738967335108.875010634825
Winsorized Mean ( 7 / 24 )551.8904109589045.03290397197378109.656455603397
Winsorized Mean ( 8 / 24 )554.3013698630144.53427186646554122.247052269297
Winsorized Mean ( 9 / 24 )554.547945205484.49297782456958123.425480128784
Winsorized Mean ( 10 / 24 )552.9041095890414.13702536092924133.647744780769
Winsorized Mean ( 11 / 24 )553.2054794520553.99385748422543138.514076087355
Winsorized Mean ( 12 / 24 )553.5342465753423.94164444816837140.432312922735
Winsorized Mean ( 13 / 24 )553.3561643835623.91579801224272141.313766096590
Winsorized Mean ( 14 / 24 )553.547945205483.88578572571865142.454572711444
Winsorized Mean ( 15 / 24 )553.547945205483.82434130458584144.743343001763
Winsorized Mean ( 16 / 24 )553.3287671232883.72836502796883148.410566822835
Winsorized Mean ( 17 / 24 )553.3287671232883.66007371124345151.179678546775
Winsorized Mean ( 18 / 24 )554.0684931506853.47716670114487159.344817425134
Winsorized Mean ( 19 / 24 )553.8082191780823.44104829509785160.941716501638
Winsorized Mean ( 20 / 24 )553.2602739726033.21117646054426172.292080728205
Winsorized Mean ( 21 / 24 )552.1095890410963.06180387011557180.321670643214
Winsorized Mean ( 22 / 24 )553.3150684931512.88318200518298191.911252046690
Winsorized Mean ( 23 / 24 )553.3150684931512.71109372585749204.092932389544
Winsorized Mean ( 24 / 24 )552.3287671232882.50076508799052220.863914717839
Trimmed Mean ( 1 / 24 )552.1690140845075.30282131033028104.127403465178
Trimmed Mean ( 2 / 24 )552.4637681159425.1563607459556107.142187161608
Trimmed Mean ( 3 / 24 )552.7313432835825.00956038001978110.335299178767
Trimmed Mean ( 4 / 24 )552.9538461538464.88976711973148113.083881627518
Trimmed Mean ( 5 / 24 )553.1904761904764.75324866096906116.381556204488
Trimmed Mean ( 6 / 24 )553.442622950824.58755292640299120.640051859797
Trimmed Mean ( 7 / 24 )553.7627118644074.43541476524058124.850265685214
Trimmed Mean ( 8 / 24 )554.1052631578954.25809594587647130.129820981251
Trimmed Mean ( 9 / 24 )554.0727272727274.16825057130949132.926924088122
Trimmed Mean ( 10 / 24 )5544.0651444167671136.280521231908
Trimmed Mean ( 11 / 24 )554.1568627450984.01432460063098138.044856327262
Trimmed Mean ( 12 / 24 )554.2857142857143.97697454487859139.373714372777
Trimmed Mean ( 13 / 24 )554.3829787234043.93583517338011140.855232575021
Trimmed Mean ( 14 / 24 )554.5111111111113.88348253351335142.787074829316
Trimmed Mean ( 15 / 24 )554.6279069767443.8175475327492145.283824816539
Trimmed Mean ( 16 / 24 )554.7560975609763.74031766092669148.317909827886
Trimmed Mean ( 17 / 24 )554.9230769230773.65524868315984151.815409846031
Trimmed Mean ( 18 / 24 )555.1081081081083.55264647448185156.251997516603
Trimmed Mean ( 19 / 24 )555.2285714285713.45562158347978160.674008428163
Trimmed Mean ( 20 / 24 )555.3939393939393.32487735987638167.041932462312
Trimmed Mean ( 21 / 24 )555.6451612903233.20099056815424173.585379106793
Trimmed Mean ( 22 / 24 )556.0689655172413.05690328934379181.905972444621
Trimmed Mean ( 23 / 24 )556.4074074074072.90360776630861191.626229225435
Trimmed Mean ( 24 / 24 )556.82.72702524129621204.178528151555
Median561
Midrange542
Midmean - Weighted Average at Xnp554.166666666667
Midmean - Weighted Average at X(n+1)p555.108108108108
Midmean - Empirical Distribution Function555.108108108108
Midmean - Empirical Distribution Function - Averaging555.108108108108
Midmean - Empirical Distribution Function - Interpolation555.108108108108
Midmean - Closest Observation554
Midmean - True Basic - Statistics Graphics Toolkit555.108108108108
Midmean - MS Excel (old versions)555.108108108108
Number of observations73


Parameters (Session):
Parameters (R input):
R code (references can be found in the software module):
geomean <- function(x) {
return(exp(mean(log(x))))
}
harmean <- function(x) {
return(1/mean(1/x))
}
quamean <- function(x) {
return(sqrt(mean(x*x)))
}
winmean <- function(x) {
x <-sort(x[!is.na(x)])
n<-length(x)
denom <- 3
nodenom <- n/denom
if (nodenom>40) denom <- n/40
sqrtn = sqrt(n)
roundnodenom = floor(nodenom)
win <- array(NA,dim=c(roundnodenom,2))
for (j in 1:roundnodenom) {
win[j,1] <- (j*x[j+1]+sum(x[(j+1):(n-j)])+j*x[n-j])/n
win[j,2] <- sd(c(rep(x[j+1],j),x[(j+1):(n-j)],rep(x[n-j],j)))/sqrtn
}
return(win)
}
trimean <- function(x) {
x <-sort(x[!is.na(x)])
n<-length(x)
denom <- 3
nodenom <- n/denom
if (nodenom>40) denom <- n/40
sqrtn = sqrt(n)
roundnodenom = floor(nodenom)
tri <- array(NA,dim=c(roundnodenom,2))
for (j in 1:roundnodenom) {
tri[j,1] <- mean(x,trim=j/n)
tri[j,2] <- sd(x[(j+1):(n-j)]) / sqrt(n-j*2)
}
return(tri)
}
midrange <- function(x) {
return((max(x)+min(x))/2)
}
q1 <- function(data,n,p,i,f) {
np <- n*p;
i <<- floor(np)
f <<- np - i
qvalue <- (1-f)*data[i] + f*data[i+1]
}
q2 <- function(data,n,p,i,f) {
np <- (n+1)*p
i <<- floor(np)
f <<- np - i
qvalue <- (1-f)*data[i] + f*data[i+1]
}
q3 <- function(data,n,p,i,f) {
np <- n*p
i <<- floor(np)
f <<- np - i
if (f==0) {
qvalue <- data[i]
} else {
qvalue <- data[i+1]
}
}
q4 <- function(data,n,p,i,f) {
np <- n*p
i <<- floor(np)
f <<- np - i
if (f==0) {
qvalue <- (data[i]+data[i+1])/2
} else {
qvalue <- data[i+1]
}
}
q5 <- function(data,n,p,i,f) {
np <- (n-1)*p
i <<- floor(np)
f <<- np - i
if (f==0) {
qvalue <- data[i+1]
} else {
qvalue <- data[i+1] + f*(data[i+2]-data[i+1])
}
}
q6 <- function(data,n,p,i,f) {
np <- n*p+0.5
i <<- floor(np)
f <<- np - i
qvalue <- data[i]
}
q7 <- function(data,n,p,i,f) {
np <- (n+1)*p
i <<- floor(np)
f <<- np - i
if (f==0) {
qvalue <- data[i]
} else {
qvalue <- f*data[i] + (1-f)*data[i+1]
}
}
q8 <- function(data,n,p,i,f) {
np <- (n+1)*p
i <<- floor(np)
f <<- np - i
if (f==0) {
qvalue <- data[i]
} else {
if (f == 0.5) {
qvalue <- (data[i]+data[i+1])/2
} else {
if (f < 0.5) {
qvalue <- data[i]
} else {
qvalue <- data[i+1]
}
}
}
}
midmean <- function(x,def) {
x <-sort(x[!is.na(x)])
n<-length(x)
if (def==1) {
qvalue1 <- q1(x,n,0.25,i,f)
qvalue3 <- q1(x,n,0.75,i,f)
}
if (def==2) {
qvalue1 <- q2(x,n,0.25,i,f)
qvalue3 <- q2(x,n,0.75,i,f)
}
if (def==3) {
qvalue1 <- q3(x,n,0.25,i,f)
qvalue3 <- q3(x,n,0.75,i,f)
}
if (def==4) {
qvalue1 <- q4(x,n,0.25,i,f)
qvalue3 <- q4(x,n,0.75,i,f)
}
if (def==5) {
qvalue1 <- q5(x,n,0.25,i,f)
qvalue3 <- q5(x,n,0.75,i,f)
}
if (def==6) {
qvalue1 <- q6(x,n,0.25,i,f)
qvalue3 <- q6(x,n,0.75,i,f)
}
if (def==7) {
qvalue1 <- q7(x,n,0.25,i,f)
qvalue3 <- q7(x,n,0.75,i,f)
}
if (def==8) {
qvalue1 <- q8(x,n,0.25,i,f)
qvalue3 <- q8(x,n,0.75,i,f)
}
midm <- 0
myn <- 0
roundno4 <- round(n/4)
round3no4 <- round(3*n/4)
for (i in 1:n) {
if ((x[i]>=qvalue1) & (x[i]<=qvalue3)){
midm = midm + x[i]
myn = myn + 1
}
}
midm = midm / myn
return(midm)
}
(arm <- mean(x))
sqrtn <- sqrt(length(x))
(armse <- sd(x) / sqrtn)
(armose <- arm / armse)
(geo <- geomean(x))
(har <- harmean(x))
(qua <- quamean(x))
(win <- winmean(x))
(tri <- trimean(x))
(midr <- midrange(x))
midm <- array(NA,dim=8)
for (j in 1:8) midm[j] <- midmean(x,j)
midm
bitmap(file='test1.png')
lb <- win[,1] - 2*win[,2]
ub <- win[,1] + 2*win[,2]
if ((ylimmin == '') | (ylimmax == '')) plot(win[,1],type='b',main=main, xlab='j', pch=19, ylab='Winsorized Mean(j/n)', ylim=c(min(lb),max(ub))) else plot(win[,1],type='l',main=main, xlab='j', pch=19, ylab='Winsorized Mean(j/n)', ylim=c(ylimmin,ylimmax))
lines(ub,lty=3)
lines(lb,lty=3)
grid()
dev.off()
bitmap(file='test2.png')
lb <- tri[,1] - 2*tri[,2]
ub <- tri[,1] + 2*tri[,2]
if ((ylimmin == '') | (ylimmax == '')) plot(tri[,1],type='b',main=main, xlab='j', pch=19, ylab='Trimmed Mean(j/n)', ylim=c(min(lb),max(ub))) else plot(tri[,1],type='l',main=main, xlab='j', pch=19, ylab='Trimmed Mean(j/n)', ylim=c(ylimmin,ylimmax))
lines(ub,lty=3)
lines(lb,lty=3)
grid()
dev.off()
load(file='createtable')
a<-table.start()
a<-table.row.start(a)
a<-table.element(a,'Central Tendency - Ungrouped Data',4,TRUE)
a<-table.row.end(a)
a<-table.row.start(a)
a<-table.element(a,'Measure',header=TRUE)
a<-table.element(a,'Value',header=TRUE)
a<-table.element(a,'S.E.',header=TRUE)
a<-table.element(a,'Value/S.E.',header=TRUE)
a<-table.row.end(a)
a<-table.row.start(a)
a<-table.element(a,hyperlink('arithmetic_mean.htm', 'Arithmetic Mean', 'click to view the definition of the Arithmetic Mean'),header=TRUE)
a<-table.element(a,arm)
a<-table.element(a,hyperlink('arithmetic_mean_standard_error.htm', armse, 'click to view the definition of the Standard Error of the Arithmetic Mean'))
a<-table.element(a,armose)
a<-table.row.end(a)
a<-table.row.start(a)
a<-table.element(a,hyperlink('geometric_mean.htm', 'Geometric Mean', 'click to view the definition of the Geometric Mean'),header=TRUE)
a<-table.element(a,geo)
a<-table.element(a,'')
a<-table.row.end(a)
a<-table.row.start(a)
a<-table.element(a,hyperlink('harmonic_mean.htm', 'Harmonic Mean', 'click to view the definition of the Harmonic Mean'),header=TRUE)
a<-table.element(a,har)
a<-table.element(a,'')
a<-table.row.end(a)
a<-table.row.start(a)
a<-table.element(a,hyperlink('quadratic_mean.htm', 'Quadratic Mean', 'click to view the definition of the Quadratic Mean'),header=TRUE)
a<-table.element(a,qua)
a<-table.element(a,'')
a<-table.row.end(a)
for (j in 1:length(win[,1])) {
a<-table.row.start(a)
mylabel <- paste('Winsorized Mean (',j)
mylabel <- paste(mylabel,'/')
mylabel <- paste(mylabel,length(win[,1]))
mylabel <- paste(mylabel,')')
a<-table.element(a,hyperlink('winsorized_mean.htm', mylabel, 'click to view the definition of the Winsorized Mean'),header=TRUE)
a<-table.element(a,win[j,1])
a<-table.element(a,win[j,2])
a<-table.element(a,win[j,1]/win[j,2])
a<-table.row.end(a)
}
for (j in 1:length(tri[,1])) {
a<-table.row.start(a)
mylabel <- paste('Trimmed Mean (',j)
mylabel <- paste(mylabel,'/')
mylabel <- paste(mylabel,length(tri[,1]))
mylabel <- paste(mylabel,')')
a<-table.element(a,hyperlink('arithmetic_mean.htm', mylabel, 'click to view the definition of the Trimmed Mean'),header=TRUE)
a<-table.element(a,tri[j,1])
a<-table.element(a,tri[j,2])
a<-table.element(a,tri[j,1]/tri[j,2])
a<-table.row.end(a)
}
a<-table.row.start(a)
a<-table.element(a,hyperlink('median_1.htm', 'Median', 'click to view the definition of the Median'),header=TRUE)
a<-table.element(a,median(x))
a<-table.element(a,'')
a<-table.row.end(a)
a<-table.row.start(a)
a<-table.element(a,hyperlink('midrange.htm', 'Midrange', 'click to view the definition of the Midrange'),header=TRUE)
a<-table.element(a,midr)
a<-table.element(a,'')
a<-table.row.end(a)
a<-table.row.start(a)
mymid <- hyperlink('midmean.htm', 'Midmean', 'click to view the definition of the Midmean')
mylabel <- paste(mymid,hyperlink('method_1.htm','Weighted Average at Xnp',''),sep=' - ')
a<-table.element(a,mylabel,header=TRUE)
a<-table.element(a,midm[1])
a<-table.element(a,'')
a<-table.row.end(a)
a<-table.row.start(a)
mymid <- hyperlink('midmean.htm', 'Midmean', 'click to view the definition of the Midmean')
mylabel <- paste(mymid,hyperlink('method_2.htm','Weighted Average at X(n+1)p',''),sep=' - ')
a<-table.element(a,mylabel,header=TRUE)
a<-table.element(a,midm[2])
a<-table.element(a,'')
a<-table.row.end(a)
a<-table.row.start(a)
mymid <- hyperlink('midmean.htm', 'Midmean', 'click to view the definition of the Midmean')
mylabel <- paste(mymid,hyperlink('method_3.htm','Empirical Distribution Function',''),sep=' - ')
a<-table.element(a,mylabel,header=TRUE)
a<-table.element(a,midm[3])
a<-table.element(a,'')
a<-table.row.end(a)
a<-table.row.start(a)
mymid <- hyperlink('midmean.htm', 'Midmean', 'click to view the definition of the Midmean')
mylabel <- paste(mymid,hyperlink('method_4.htm','Empirical Distribution Function - Averaging',''),sep=' - ')
a<-table.element(a,mylabel,header=TRUE)
a<-table.element(a,midm[4])
a<-table.element(a,'')
a<-table.row.end(a)
a<-table.row.start(a)
mymid <- hyperlink('midmean.htm', 'Midmean', 'click to view the definition of the Midmean')
mylabel <- paste(mymid,hyperlink('method_5.htm','Empirical Distribution Function - Interpolation',''),sep=' - ')
a<-table.element(a,mylabel,header=TRUE)
a<-table.element(a,midm[5])
a<-table.element(a,'')
a<-table.row.end(a)
a<-table.row.start(a)
mymid <- hyperlink('midmean.htm', 'Midmean', 'click to view the definition of the Midmean')
mylabel <- paste(mymid,hyperlink('method_6.htm','Closest Observation',''),sep=' - ')
a<-table.element(a,mylabel,header=TRUE)
a<-table.element(a,midm[6])
a<-table.element(a,'')
a<-table.row.end(a)
a<-table.row.start(a)
mymid <- hyperlink('midmean.htm', 'Midmean', 'click to view the definition of the Midmean')
mylabel <- paste(mymid,hyperlink('method_7.htm','True Basic - Statistics Graphics Toolkit',''),sep=' - ')
a<-table.element(a,mylabel,header=TRUE)
a<-table.element(a,midm[7])
a<-table.element(a,'')
a<-table.row.end(a)
a<-table.row.start(a)
mymid <- hyperlink('midmean.htm', 'Midmean', 'click to view the definition of the Midmean')
mylabel <- paste(mymid,hyperlink('method_8.htm','MS Excel (old versions)',''),sep=' - ')
a<-table.element(a,mylabel,header=TRUE)
a<-table.element(a,midm[8])
a<-table.element(a,'')
a<-table.row.end(a)
a<-table.row.start(a)
a<-table.element(a,'Number of observations',header=TRUE)
a<-table.element(a,length(x))
a<-table.element(a,'')
a<-table.row.end(a)
a<-table.end(a)
table.save(a,file='mytable.tab')