Free Statistics

of Irreproducible Research!

Author's title

Author*Unverified author*
R Software Modulerwasp_cross.wasp
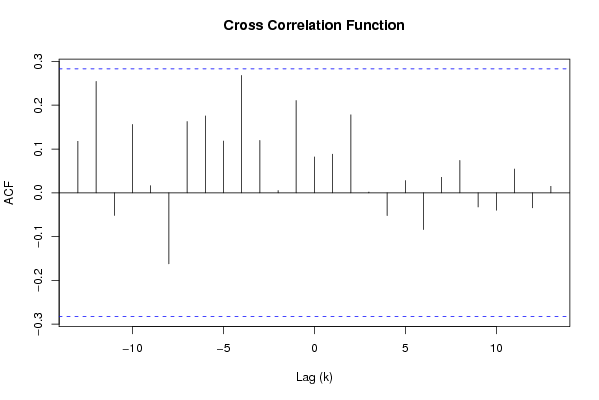
Title produced by softwareCross Correlation Function
Date of computationThu, 22 Nov 2007 09:52:08 -0700
Cite this page as followsStatistical Computations at FreeStatistics.org, Office for Research Development and Education, URL https://freestatistics.org/blog/index.php?v=date/2007/Nov/22/t1195749908t50iya66twbw23h.htm/, Retrieved Fri, 03 May 2024 03:14:09 +0000
Statistical Computations at FreeStatistics.org, Office for Research Development and Education, URL https://freestatistics.org/blog/index.php?pk=6074, Retrieved Fri, 03 May 2024 03:14:09 +0000
QR Codes:

Original text written by user:
IsPrivate?No (this computation is public)
User-defined keywordsWorkshop 7, question 3, cross correlation matrix, differentiatie D=1, Totale consumptiegoederen, duurzame consumptiegoederen
Estimated Impact162
Family? (F = Feedback message, R = changed R code, M = changed R Module, P = changed Parameters, D = changed Data)
-     [Standard Deviation-Mean Plot] [Workshop 7, quest...] [2007-11-22 15:07:42] [5babdb52c730cb807dd08aeebb84155b]
- RMPD    [Cross Correlation Function] [Workshop 7, quest...] [2007-11-22 16:52:08] [d41d8cd98f00b204e9800998ecf8427e] [Current]
Feedback Forum

Post a new message
Dataseries X:
108.4
117
103.8
100.8
110.6
104
112.6
107.3
98.9
109.8
104.9
102.2
123.9
124.9
112.7
121.9
100.6
104.3
120.4
107.5
102.9
125.6
107.5
108.8
128.4
121.1
119.5
128.7
108.7
105.5
119.8
111.3
110.6
120.1
97.5
107.7
127.3
117.2
119.8
116.2
111
112.4
130.6
109.1
118.8
123.9
101.6
112.8
128
129.6
125.8
119.5
115.7
113.6
129.7
112
116.8
126.3
112.9
115.9
Dataseries Y:
106.7
100.6
101.2
93.1
84.2
85.8
91.8
92.4
80.3
79.7
62.5
57.1
100.8
100.7
86.2
83.2
71.7
77.5
89.8
80.3
78.7
93.8
57.6
60.6
91
85.3
77.4
77.3
68.3
69.9
81.7
75.1
69.9
84
54.3
60
89.9
77
85.3
77.6
69.2
75.5
85.7
72.2
79.9
85.3
52.2
61.2
82.4
85.4
78.2
70.2
70.2
69.3
77.5
66.1
69
75.3
58.2
59.7


Summary of compuational transaction
Raw Inputview raw input (R code)
Raw Outputview raw output of R engine
Computing time1 seconds
R Server'Gwilym Jenkins' @ 72.249.127.135

\begin{tabular}{lllllllll}
\hline
Summary of compuational transaction \tabularnewline
Raw Input & view raw input (R code)  \tabularnewline
Raw Output & view raw output of R engine  \tabularnewline
Computing time & 1 seconds \tabularnewline
R Server & 'Gwilym Jenkins' @ 72.249.127.135 \tabularnewline
\hline
\end{tabular}
%Source: https://freestatistics.org/blog/index.php?pk=6074&T=0

[TABLE]
[ROW][C]Summary of compuational transaction[/C][/ROW]
[ROW][C]Raw Input[/C][C]view raw input (R code) [/C][/ROW]
[ROW][C]Raw Output[/C][C]view raw output of R engine [/C][/ROW]
[ROW][C]Computing time[/C][C]1 seconds[/C][/ROW]
[ROW][C]R Server[/C][C]'Gwilym Jenkins' @ 72.249.127.135[/C][/ROW]
[/TABLE]
Source: https://freestatistics.org/blog/index.php?pk=6074&T=0

Globally Unique Identifier (entire table): ba.freestatistics.org/blog/index.php?pk=6074&T=0

As an alternative you can also use a QR Code:  

The GUIDs for individual cells are displayed in the table below:

Summary of compuational transaction
Raw Inputview raw input (R code)
Raw Outputview raw output of R engine
Computing time1 seconds
R Server'Gwilym Jenkins' @ 72.249.127.135


Cross Correlation Function
ParameterValue
Box-Cox transformation parameter (lambda) of X series1
Degree of non-seasonal differencing (d) of X series0
Degree of seasonal differencing (D) of X series1
Seasonal Period (s)12
Box-Cox transformation parameter (lambda) of Y series1
Degree of non-seasonal differencing (d) of Y series0
Degree of seasonal differencing (D) of Y series0
krho(Y[t],X[t-k])
-130.117517404455904
-120.254338921552418
-11-0.0518146734138939
-100.156176200902903
-90.0162237990378259
-8-0.162103156150933
-70.162705724484702
-60.175464652143522
-50.118309078013853
-40.268052804419352
-30.11948549315718
-20.00518366541941563
-10.210611375880258
00.0819295580938217
10.0883300712962812
20.178005290241192
30.0017794757846594
4-0.0519397163102295
50.0280860508148687
6-0.0838937040349626
70.0353779621040495
80.0740137770320497
9-0.0324219325130164
10-0.0397022896231644
110.0543245498132138
12-0.0343002202301136
130.0149284195991897

\begin{tabular}{lllllllll}
\hline
Cross Correlation Function \tabularnewline
Parameter & Value \tabularnewline
Box-Cox transformation parameter (lambda) of X series & 1 \tabularnewline
Degree of non-seasonal differencing (d) of X series & 0 \tabularnewline
Degree of seasonal differencing (D) of X series & 1 \tabularnewline
Seasonal Period (s) & 12 \tabularnewline
Box-Cox transformation parameter (lambda) of Y series & 1 \tabularnewline
Degree of non-seasonal differencing (d) of Y series & 0 \tabularnewline
Degree of seasonal differencing (D) of Y series & 0 \tabularnewline
k & rho(Y[t],X[t-k]) \tabularnewline
-13 & 0.117517404455904 \tabularnewline
-12 & 0.254338921552418 \tabularnewline
-11 & -0.0518146734138939 \tabularnewline
-10 & 0.156176200902903 \tabularnewline
-9 & 0.0162237990378259 \tabularnewline
-8 & -0.162103156150933 \tabularnewline
-7 & 0.162705724484702 \tabularnewline
-6 & 0.175464652143522 \tabularnewline
-5 & 0.118309078013853 \tabularnewline
-4 & 0.268052804419352 \tabularnewline
-3 & 0.11948549315718 \tabularnewline
-2 & 0.00518366541941563 \tabularnewline
-1 & 0.210611375880258 \tabularnewline
0 & 0.0819295580938217 \tabularnewline
1 & 0.0883300712962812 \tabularnewline
2 & 0.178005290241192 \tabularnewline
3 & 0.0017794757846594 \tabularnewline
4 & -0.0519397163102295 \tabularnewline
5 & 0.0280860508148687 \tabularnewline
6 & -0.0838937040349626 \tabularnewline
7 & 0.0353779621040495 \tabularnewline
8 & 0.0740137770320497 \tabularnewline
9 & -0.0324219325130164 \tabularnewline
10 & -0.0397022896231644 \tabularnewline
11 & 0.0543245498132138 \tabularnewline
12 & -0.0343002202301136 \tabularnewline
13 & 0.0149284195991897 \tabularnewline
\hline
\end{tabular}
%Source: https://freestatistics.org/blog/index.php?pk=6074&T=1

[TABLE]
[ROW][C]Cross Correlation Function[/C][/ROW]
[ROW][C]Parameter[/C][C]Value[/C][/ROW]
[ROW][C]Box-Cox transformation parameter (lambda) of X series[/C][C]1[/C][/ROW]
[ROW][C]Degree of non-seasonal differencing (d) of X series[/C][C]0[/C][/ROW]
[ROW][C]Degree of seasonal differencing (D) of X series[/C][C]1[/C][/ROW]
[ROW][C]Seasonal Period (s)[/C][C]12[/C][/ROW]
[ROW][C]Box-Cox transformation parameter (lambda) of Y series[/C][C]1[/C][/ROW]
[ROW][C]Degree of non-seasonal differencing (d) of Y series[/C][C]0[/C][/ROW]
[ROW][C]Degree of seasonal differencing (D) of Y series[/C][C]0[/C][/ROW]
[ROW][C]k[/C][C]rho(Y[t],X[t-k])[/C][/ROW]
[ROW][C]-13[/C][C]0.117517404455904[/C][/ROW]
[ROW][C]-12[/C][C]0.254338921552418[/C][/ROW]
[ROW][C]-11[/C][C]-0.0518146734138939[/C][/ROW]
[ROW][C]-10[/C][C]0.156176200902903[/C][/ROW]
[ROW][C]-9[/C][C]0.0162237990378259[/C][/ROW]
[ROW][C]-8[/C][C]-0.162103156150933[/C][/ROW]
[ROW][C]-7[/C][C]0.162705724484702[/C][/ROW]
[ROW][C]-6[/C][C]0.175464652143522[/C][/ROW]
[ROW][C]-5[/C][C]0.118309078013853[/C][/ROW]
[ROW][C]-4[/C][C]0.268052804419352[/C][/ROW]
[ROW][C]-3[/C][C]0.11948549315718[/C][/ROW]
[ROW][C]-2[/C][C]0.00518366541941563[/C][/ROW]
[ROW][C]-1[/C][C]0.210611375880258[/C][/ROW]
[ROW][C]0[/C][C]0.0819295580938217[/C][/ROW]
[ROW][C]1[/C][C]0.0883300712962812[/C][/ROW]
[ROW][C]2[/C][C]0.178005290241192[/C][/ROW]
[ROW][C]3[/C][C]0.0017794757846594[/C][/ROW]
[ROW][C]4[/C][C]-0.0519397163102295[/C][/ROW]
[ROW][C]5[/C][C]0.0280860508148687[/C][/ROW]
[ROW][C]6[/C][C]-0.0838937040349626[/C][/ROW]
[ROW][C]7[/C][C]0.0353779621040495[/C][/ROW]
[ROW][C]8[/C][C]0.0740137770320497[/C][/ROW]
[ROW][C]9[/C][C]-0.0324219325130164[/C][/ROW]
[ROW][C]10[/C][C]-0.0397022896231644[/C][/ROW]
[ROW][C]11[/C][C]0.0543245498132138[/C][/ROW]
[ROW][C]12[/C][C]-0.0343002202301136[/C][/ROW]
[ROW][C]13[/C][C]0.0149284195991897[/C][/ROW]
[/TABLE]
Source: https://freestatistics.org/blog/index.php?pk=6074&T=1

Globally Unique Identifier (entire table): ba.freestatistics.org/blog/index.php?pk=6074&T=1

As an alternative you can also use a QR Code:  

The GUIDs for individual cells are displayed in the table below:

Cross Correlation Function
ParameterValue
Box-Cox transformation parameter (lambda) of X series1
Degree of non-seasonal differencing (d) of X series0
Degree of seasonal differencing (D) of X series1
Seasonal Period (s)12
Box-Cox transformation parameter (lambda) of Y series1
Degree of non-seasonal differencing (d) of Y series0
Degree of seasonal differencing (D) of Y series0
krho(Y[t],X[t-k])
-130.117517404455904
-120.254338921552418
-11-0.0518146734138939
-100.156176200902903
-90.0162237990378259
-8-0.162103156150933
-70.162705724484702
-60.175464652143522
-50.118309078013853
-40.268052804419352
-30.11948549315718
-20.00518366541941563
-10.210611375880258
00.0819295580938217
10.0883300712962812
20.178005290241192
30.0017794757846594
4-0.0519397163102295
50.0280860508148687
6-0.0838937040349626
70.0353779621040495
80.0740137770320497
9-0.0324219325130164
10-0.0397022896231644
110.0543245498132138
12-0.0343002202301136
130.0149284195991897


Parameters (Session):
par1 = 1 ; par2 = 0 ; par3 = 1 ; par4 = 12 ; par5 = 1 ; par6 = 0 ; par7 = 0 ;
Parameters (R input):
par1 = 1 ; par2 = 0 ; par3 = 1 ; par4 = 12 ; par5 = 1 ; par6 = 0 ; par7 = 0 ;
R code (references can be found in the software module):
par1 <- as.numeric(par1)
par2 <- as.numeric(par2)
par3 <- as.numeric(par3)
par4 <- as.numeric(par4)
par5 <- as.numeric(par5)
par6 <- as.numeric(par6)
par7 <- as.numeric(par7)
if (par1 == 0) {
x <- log(x)
} else {
x <- (x ^ par1 - 1) / par1
}
if (par5 == 0) {
y <- log(y)
} else {
y <- (y ^ par5 - 1) / par5
}
if (par2 > 0) x <- diff(x,lag=1,difference=par2)
if (par6 > 0) y <- diff(y,lag=1,difference=par6)
if (par3 > 0) x <- diff(x,lag=par4,difference=par3)
if (par7 > 0) x <- diff(y,lag=par4,difference=par7)
x
y
bitmap(file='test1.png')
(r <- ccf(x,y,main='Cross Correlation Function',xlab='Lag (k)'))
dev.off()
load(file='createtable')
a<-table.start()
a<-table.row.start(a)
a<-table.element(a,'Cross Correlation Function',2,TRUE)
a<-table.row.end(a)
a<-table.row.start(a)
a<-table.element(a,'Parameter',header=TRUE)
a<-table.element(a,'Value',header=TRUE)
a<-table.row.end(a)
a<-table.row.start(a)
a<-table.element(a,'Box-Cox transformation parameter (lambda) of X series',header=TRUE)
a<-table.element(a,par1)
a<-table.row.end(a)
a<-table.row.start(a)
a<-table.element(a,'Degree of non-seasonal differencing (d) of X series',header=TRUE)
a<-table.element(a,par2)
a<-table.row.end(a)
a<-table.row.start(a)
a<-table.element(a,'Degree of seasonal differencing (D) of X series',header=TRUE)
a<-table.element(a,par3)
a<-table.row.end(a)
a<-table.row.start(a)
a<-table.element(a,'Seasonal Period (s)',header=TRUE)
a<-table.element(a,par4)
a<-table.row.end(a)
a<-table.row.start(a)
a<-table.element(a,'Box-Cox transformation parameter (lambda) of Y series',header=TRUE)
a<-table.element(a,par5)
a<-table.row.end(a)
a<-table.row.start(a)
a<-table.element(a,'Degree of non-seasonal differencing (d) of Y series',header=TRUE)
a<-table.element(a,par6)
a<-table.row.end(a)
a<-table.row.start(a)
a<-table.element(a,'Degree of seasonal differencing (D) of Y series',header=TRUE)
a<-table.element(a,par7)
a<-table.row.end(a)
a<-table.row.start(a)
a<-table.element(a,'k',header=TRUE)
a<-table.element(a,'rho(Y[t],X[t-k])',header=TRUE)
a<-table.row.end(a)
mylength <- length(r$acf)
myhalf <- floor((mylength-1)/2)
for (i in 1:mylength) {
a<-table.row.start(a)
a<-table.element(a,i-myhalf-1,header=TRUE)
a<-table.element(a,r$acf[i])
a<-table.row.end(a)
}
a<-table.end(a)
table.save(a,file='mytable.tab')