Free Statistics

of Irreproducible Research!

Author's title

Author*Unverified author*
R Software Modulerwasp_multipleregression.wasp
Title produced by softwareMultiple Regression
Date of computationThu, 22 Nov 2007 02:35:12 -0700
Cite this page as followsStatistical Computations at FreeStatistics.org, Office for Research Development and Education, URL https://freestatistics.org/blog/index.php?v=date/2007/Nov/22/t1195723973h0919f2ths9ynnh.htm/, Retrieved Thu, 02 May 2024 18:33:39 +0000
Statistical Computations at FreeStatistics.org, Office for Research Development and Education, URL https://freestatistics.org/blog/index.php?pk=5925, Retrieved Thu, 02 May 2024 18:33:39 +0000
QR Codes:

Original text written by user:
IsPrivate?No (this computation is public)
User-defined keywordsnog antwoorden op de vraag en verklaringen geven aan de grafieken
Estimated Impact223
Family? (F = Feedback message, R = changed R code, M = changed R Module, P = changed Parameters, D = changed Data)
-       [Multiple Regression] [Workshop 2 vraag 3] [2007-11-22 09:35:12] [dd38921fafddee0dfc20da83e9650a2a] [Current]
Feedback Forum

Post a new message
Dataseries X:
168.836	102.161	66.674
150.581	90.488	60.093
149.514	113.022	36.492
148.281	98.250	50.031
125.968	111.717	14.250
96.566	3.027	93.538
84.416	32.943	51.473
84.222	15.236	68.986
82.354	8.606	73.747
75.213	67.359	7.854
71.639	66.225	5.414
70.339	18.636	51.703
68.503	39.376	29.127
68.183	39.383	28.800
66.893	40.266	26.627
61.926	11.407	50.520
61.630	47.735	13.895
53.911	53.284	627
53.077	8.769	44.309
51.337	982	50.355
51.314	117	51.197
50.978	25.464	25.513
48.921	6.915	42.007
48.809	32.405	16.404
47.727	25.255	22.472
47.216	47.121	95
45.698	8.350	37.348
45.568	4.521	41.047
44.102	10.756	33.346
42.489	32.693	9.796
42.102	17.061	25.041
38.251	242	38.009
37.657	12.185	25.472
36.817	12.165	24.652
35.818	13.060	22.758
35.685	2.644	33.041
35.516	12.853	22.663
35.101	370	34.732
34.173	9.495	24.678
33.234	26.133	7.101
29.635	917	28.718
27.750	12.118	15.632
27.086	25.649	1.437
26.385	20.752	5.633
25.009	14.616	10.393
24.076	2.994	21.082
23.779	4.790	18.989
23.296	16.362	6.934
23.010	19.962	3.048
22.971	22.753	218
22.723	5.096	17.627
21.938	9.411	12.527
21.446	703	20.743
21.402	4.333	17.069
21.200	9.835	11.365
20.890	15.452	5.438
20.850	1.814	19.037
19.730	216	19.514
19.661	2.580	17.082
19.264	11.426	7.838
18.980	3.335	15.644
18.836	113	18.723
17.203	4.191	13.013
17.060	7.932	9.128
16.828	544	16.283
16.574	943	15.631
16.218	5.593	10.625
16.055	1.745	14.310
15.471	2.550	12.921
15.237	1.803	13.434
15.105	395	14.710
14.560	100	14.460
14.290	11.176	3.115
14.148	1.478	12.669
14.105	2.787	11.318
13.995	12.425	1.570
13.961	4.227	9.734
13.916	13.387	528
12.982	4.956	8.026
12.671	1.119	11.553
11.415	1.036	10.380
11.393	2.308	9.085
11.363	3.620	7.743
11.152	9.734	1.418
10.730	425	10.305
10.402	7.383	3.018
10.004	2.975	7.028
9.902	2.818	7.084
9.857	7.029	2.829
9.738	554	9.184
9.625	7.197	2.428
9.228	5.354	3.873
9.145	6.297	2.849
8.846	4.816	4.030
8.749	0	8.749
8.718	4.577	4.142
8.569	3.656	4.913
8.473	280	8.193
8.309	321	7.988
8.103	1.315	6.788


Summary of compuational transaction
Raw Inputview raw input (R code)
Raw Outputview raw output of R engine
Computing time6 seconds
R Server'Herman Ole Andreas Wold' @ 193.190.124.10:1001

\begin{tabular}{lllllllll}
\hline
Summary of compuational transaction \tabularnewline
Raw Input & view raw input (R code)  \tabularnewline
Raw Output & view raw output of R engine  \tabularnewline
Computing time & 6 seconds \tabularnewline
R Server & 'Herman Ole Andreas Wold' @ 193.190.124.10:1001 \tabularnewline
\hline
\end{tabular}
%Source: https://freestatistics.org/blog/index.php?pk=5925&T=0

[TABLE]
[ROW][C]Summary of compuational transaction[/C][/ROW]
[ROW][C]Raw Input[/C][C]view raw input (R code) [/C][/ROW]
[ROW][C]Raw Output[/C][C]view raw output of R engine [/C][/ROW]
[ROW][C]Computing time[/C][C]6 seconds[/C][/ROW]
[ROW][C]R Server[/C][C]'Herman Ole Andreas Wold' @ 193.190.124.10:1001[/C][/ROW]
[/TABLE]
Source: https://freestatistics.org/blog/index.php?pk=5925&T=0

Globally Unique Identifier (entire table): ba.freestatistics.org/blog/index.php?pk=5925&T=0

As an alternative you can also use a QR Code:  

The GUIDs for individual cells are displayed in the table below:

Summary of compuational transaction
Raw Inputview raw input (R code)
Raw Outputview raw output of R engine
Computing time6 seconds
R Server'Herman Ole Andreas Wold' @ 193.190.124.10:1001


Multiple Linear Regression - Estimated Regression Equation
Totaal[t] = + 80.6199751233202 -0.00283909874382477Vrouwen[t] -0.00159293366137467Mannen[t] + 10.4049928272578M1[t] + 9.26659394050718M2[t] + 9.2121611220132M3[t] + 9.1050997513571M4[t] + 5.5323317390141M5[t] + 1.32699196787480M6[t] -0.438357788220186M7[t] -0.0177278005565451M8[t] -0.186935229537426M9[t] -0.554201233792353M10[t] -0.447555437283408M11[t] -0.95454723952818t + e[t]

\begin{tabular}{lllllllll}
\hline
Multiple Linear Regression - Estimated Regression Equation \tabularnewline
Totaal[t] =  +  80.6199751233202 -0.00283909874382477Vrouwen[t] -0.00159293366137467Mannen[t] +  10.4049928272578M1[t] +  9.26659394050718M2[t] +  9.2121611220132M3[t] +  9.1050997513571M4[t] +  5.5323317390141M5[t] +  1.32699196787480M6[t] -0.438357788220186M7[t] -0.0177278005565451M8[t] -0.186935229537426M9[t] -0.554201233792353M10[t] -0.447555437283408M11[t] -0.95454723952818t  + e[t] \tabularnewline
\hline
\end{tabular}
%Source: https://freestatistics.org/blog/index.php?pk=5925&T=1

[TABLE]
[ROW][C]Multiple Linear Regression - Estimated Regression Equation[/C][/ROW]
[ROW][C]Totaal[t] =  +  80.6199751233202 -0.00283909874382477Vrouwen[t] -0.00159293366137467Mannen[t] +  10.4049928272578M1[t] +  9.26659394050718M2[t] +  9.2121611220132M3[t] +  9.1050997513571M4[t] +  5.5323317390141M5[t] +  1.32699196787480M6[t] -0.438357788220186M7[t] -0.0177278005565451M8[t] -0.186935229537426M9[t] -0.554201233792353M10[t] -0.447555437283408M11[t] -0.95454723952818t  + e[t][/C][/ROW]
[/TABLE]
Source: https://freestatistics.org/blog/index.php?pk=5925&T=1

Globally Unique Identifier (entire table): ba.freestatistics.org/blog/index.php?pk=5925&T=1

As an alternative you can also use a QR Code:  

The GUIDs for individual cells are displayed in the table below:

Multiple Linear Regression - Estimated Regression Equation
Totaal[t] = + 80.6199751233202 -0.00283909874382477Vrouwen[t] -0.00159293366137467Mannen[t] + 10.4049928272578M1[t] + 9.26659394050718M2[t] + 9.2121611220132M3[t] + 9.1050997513571M4[t] + 5.5323317390141M5[t] + 1.32699196787480M6[t] -0.438357788220186M7[t] -0.0177278005565451M8[t] -0.186935229537426M9[t] -0.554201233792353M10[t] -0.447555437283408M11[t] -0.95454723952818t + e[t]


Multiple Linear Regression - Ordinary Least Squares
VariableParameterS.D.T-STATH0: parameter = 02-tail p-value1-tail p-value
(Intercept)80.61997512332027.98990310.090200
Vrouwen-0.002839098743824770.011099-0.25580.7987280.399364
Mannen-0.001592933661374670.028008-0.05690.9547780.477389
M110.40499282725789.6023241.08360.281610.140805
M29.266593940507189.6909560.95620.3416780.170839
M39.21216112201329.5906750.96050.3395110.169756
M49.10509975135719.5826320.95020.3447210.172361
M55.532331739014110.3138170.53640.5930830.296542
M61.3269919678748010.9469420.12120.9038030.451901
M7-0.4383577882201869.865543-0.04440.9646630.482332
M8-0.01772780055654519.983864-0.00180.9985870.499294
M9-0.1869352295374269.86326-0.0190.9849230.492462
M10-0.5542012337923539.861989-0.05620.9553180.477659
M11-0.4475554372834089.86793-0.04540.9639310.481966
t-0.954547239528180.069849-13.665800

\begin{tabular}{lllllllll}
\hline
Multiple Linear Regression - Ordinary Least Squares \tabularnewline
Variable & Parameter & S.D. & T-STATH0: parameter = 0 & 2-tail p-value & 1-tail p-value \tabularnewline
(Intercept) & 80.6199751233202 & 7.989903 & 10.0902 & 0 & 0 \tabularnewline
Vrouwen & -0.00283909874382477 & 0.011099 & -0.2558 & 0.798728 & 0.399364 \tabularnewline
Mannen & -0.00159293366137467 & 0.028008 & -0.0569 & 0.954778 & 0.477389 \tabularnewline
M1 & 10.4049928272578 & 9.602324 & 1.0836 & 0.28161 & 0.140805 \tabularnewline
M2 & 9.26659394050718 & 9.690956 & 0.9562 & 0.341678 & 0.170839 \tabularnewline
M3 & 9.2121611220132 & 9.590675 & 0.9605 & 0.339511 & 0.169756 \tabularnewline
M4 & 9.1050997513571 & 9.582632 & 0.9502 & 0.344721 & 0.172361 \tabularnewline
M5 & 5.5323317390141 & 10.313817 & 0.5364 & 0.593083 & 0.296542 \tabularnewline
M6 & 1.32699196787480 & 10.946942 & 0.1212 & 0.903803 & 0.451901 \tabularnewline
M7 & -0.438357788220186 & 9.865543 & -0.0444 & 0.964663 & 0.482332 \tabularnewline
M8 & -0.0177278005565451 & 9.983864 & -0.0018 & 0.998587 & 0.499294 \tabularnewline
M9 & -0.186935229537426 & 9.86326 & -0.019 & 0.984923 & 0.492462 \tabularnewline
M10 & -0.554201233792353 & 9.861989 & -0.0562 & 0.955318 & 0.477659 \tabularnewline
M11 & -0.447555437283408 & 9.86793 & -0.0454 & 0.963931 & 0.481966 \tabularnewline
t & -0.95454723952818 & 0.069849 & -13.6658 & 0 & 0 \tabularnewline
\hline
\end{tabular}
%Source: https://freestatistics.org/blog/index.php?pk=5925&T=2

[TABLE]
[ROW][C]Multiple Linear Regression - Ordinary Least Squares[/C][/ROW]
[ROW][C]Variable[/C][C]Parameter[/C][C]S.D.[/C][C]T-STATH0: parameter = 0[/C][C]2-tail p-value[/C][C]1-tail p-value[/C][/ROW]
[ROW][C](Intercept)[/C][C]80.6199751233202[/C][C]7.989903[/C][C]10.0902[/C][C]0[/C][C]0[/C][/ROW]
[ROW][C]Vrouwen[/C][C]-0.00283909874382477[/C][C]0.011099[/C][C]-0.2558[/C][C]0.798728[/C][C]0.399364[/C][/ROW]
[ROW][C]Mannen[/C][C]-0.00159293366137467[/C][C]0.028008[/C][C]-0.0569[/C][C]0.954778[/C][C]0.477389[/C][/ROW]
[ROW][C]M1[/C][C]10.4049928272578[/C][C]9.602324[/C][C]1.0836[/C][C]0.28161[/C][C]0.140805[/C][/ROW]
[ROW][C]M2[/C][C]9.26659394050718[/C][C]9.690956[/C][C]0.9562[/C][C]0.341678[/C][C]0.170839[/C][/ROW]
[ROW][C]M3[/C][C]9.2121611220132[/C][C]9.590675[/C][C]0.9605[/C][C]0.339511[/C][C]0.169756[/C][/ROW]
[ROW][C]M4[/C][C]9.1050997513571[/C][C]9.582632[/C][C]0.9502[/C][C]0.344721[/C][C]0.172361[/C][/ROW]
[ROW][C]M5[/C][C]5.5323317390141[/C][C]10.313817[/C][C]0.5364[/C][C]0.593083[/C][C]0.296542[/C][/ROW]
[ROW][C]M6[/C][C]1.32699196787480[/C][C]10.946942[/C][C]0.1212[/C][C]0.903803[/C][C]0.451901[/C][/ROW]
[ROW][C]M7[/C][C]-0.438357788220186[/C][C]9.865543[/C][C]-0.0444[/C][C]0.964663[/C][C]0.482332[/C][/ROW]
[ROW][C]M8[/C][C]-0.0177278005565451[/C][C]9.983864[/C][C]-0.0018[/C][C]0.998587[/C][C]0.499294[/C][/ROW]
[ROW][C]M9[/C][C]-0.186935229537426[/C][C]9.86326[/C][C]-0.019[/C][C]0.984923[/C][C]0.492462[/C][/ROW]
[ROW][C]M10[/C][C]-0.554201233792353[/C][C]9.861989[/C][C]-0.0562[/C][C]0.955318[/C][C]0.477659[/C][/ROW]
[ROW][C]M11[/C][C]-0.447555437283408[/C][C]9.86793[/C][C]-0.0454[/C][C]0.963931[/C][C]0.481966[/C][/ROW]
[ROW][C]t[/C][C]-0.95454723952818[/C][C]0.069849[/C][C]-13.6658[/C][C]0[/C][C]0[/C][/ROW]
[/TABLE]
Source: https://freestatistics.org/blog/index.php?pk=5925&T=2

Globally Unique Identifier (entire table): ba.freestatistics.org/blog/index.php?pk=5925&T=2

As an alternative you can also use a QR Code:  

The GUIDs for individual cells are displayed in the table below:

Multiple Linear Regression - Ordinary Least Squares
VariableParameterS.D.T-STATH0: parameter = 02-tail p-value1-tail p-value
(Intercept)80.61997512332027.98990310.090200
Vrouwen-0.002839098743824770.011099-0.25580.7987280.399364
Mannen-0.001592933661374670.028008-0.05690.9547780.477389
M110.40499282725789.6023241.08360.281610.140805
M29.266593940507189.6909560.95620.3416780.170839
M39.21216112201329.5906750.96050.3395110.169756
M49.10509975135719.5826320.95020.3447210.172361
M55.532331739014110.3138170.53640.5930830.296542
M61.3269919678748010.9469420.12120.9038030.451901
M7-0.4383577882201869.865543-0.04440.9646630.482332
M8-0.01772780055654519.983864-0.00180.9985870.499294
M9-0.1869352295374269.86326-0.0190.9849230.492462
M10-0.5542012337923539.861989-0.05620.9553180.477659
M11-0.4475554372834089.86793-0.04540.9639310.481966
t-0.954547239528180.069849-13.665800


Multiple Linear Regression - Regression Statistics
Multiple R0.838575876760288
R-squared0.703209501084286
Adjusted R-squared0.654326360086404
F-TEST (value)14.3855220169823
F-TEST (DF numerator)14
F-TEST (DF denominator)85
p-value1.11022302462516e-16
Multiple Linear Regression - Residual Statistics
Residual Standard Deviation19.7181113195452
Sum Squared Residuals33048.3326908480

\begin{tabular}{lllllllll}
\hline
Multiple Linear Regression - Regression Statistics \tabularnewline
Multiple R & 0.838575876760288 \tabularnewline
R-squared & 0.703209501084286 \tabularnewline
Adjusted R-squared & 0.654326360086404 \tabularnewline
F-TEST (value) & 14.3855220169823 \tabularnewline
F-TEST (DF numerator) & 14 \tabularnewline
F-TEST (DF denominator) & 85 \tabularnewline
p-value & 1.11022302462516e-16 \tabularnewline
Multiple Linear Regression - Residual Statistics \tabularnewline
Residual Standard Deviation & 19.7181113195452 \tabularnewline
Sum Squared Residuals & 33048.3326908480 \tabularnewline
\hline
\end{tabular}
%Source: https://freestatistics.org/blog/index.php?pk=5925&T=3

[TABLE]
[ROW][C]Multiple Linear Regression - Regression Statistics[/C][/ROW]
[ROW][C]Multiple R[/C][C]0.838575876760288[/C][/ROW]
[ROW][C]R-squared[/C][C]0.703209501084286[/C][/ROW]
[ROW][C]Adjusted R-squared[/C][C]0.654326360086404[/C][/ROW]
[ROW][C]F-TEST (value)[/C][C]14.3855220169823[/C][/ROW]
[ROW][C]F-TEST (DF numerator)[/C][C]14[/C][/ROW]
[ROW][C]F-TEST (DF denominator)[/C][C]85[/C][/ROW]
[ROW][C]p-value[/C][C]1.11022302462516e-16[/C][/ROW]
[ROW][C]Multiple Linear Regression - Residual Statistics[/C][/ROW]
[ROW][C]Residual Standard Deviation[/C][C]19.7181113195452[/C][/ROW]
[ROW][C]Sum Squared Residuals[/C][C]33048.3326908480[/C][/ROW]
[/TABLE]
Source: https://freestatistics.org/blog/index.php?pk=5925&T=3

Globally Unique Identifier (entire table): ba.freestatistics.org/blog/index.php?pk=5925&T=3

As an alternative you can also use a QR Code:  

The GUIDs for individual cells are displayed in the table below:

Multiple Linear Regression - Regression Statistics
Multiple R0.838575876760288
R-squared0.703209501084286
Adjusted R-squared0.654326360086404
F-TEST (value)14.3855220169823
F-TEST (DF numerator)14
F-TEST (DF denominator)85
p-value1.11022302462516e-16
Multiple Linear Regression - Residual Statistics
Residual Standard Deviation19.7181113195452
Sum Squared Residuals33048.3326908480


Multiple Linear Regression - Actuals, Interpolation, and Residuals
Time or IndexActualsInterpolationForecastResidualsPrediction Error
1168.83689.674168285343479.1618317146566
2150.58187.624846055126962.9561539448731
3149.51486.589484573353462.9245154266466
4148.28185.548248400971662.7327515990284
5125.96881.03969576565544.928304234345
696.56676.062089873310720.5039101266893
784.41673.32426515413311.0917348458670
884.22272.812722776513711.4092772234863
982.35471.700207375514410.6537926244856
1075.21370.31655174098434.89644825901565
1171.63969.47575659407442.16324340592564
1270.33969.03013935569811.30886064430191
1368.50378.45766410582-9.95466410582
1468.18376.3652189951572-8.18221899515724
1566.89375.3571934577904-8.46419345779045
1661.92674.339458434283-12.413458434283
1761.6369.767345598594-8.137345598594
1853.91163.6150688365399-9.70406883653993
1953.07761.9497424295782-8.87274242957818
2051.33758.6430953912457-7.30609539124566
2151.31459.9738198860021-8.65981988600213
2250.97858.9527992929925-7.97479929299251
2348.92158.1312864447618-9.21028644476177
2448.80957.5927098960691-8.78370989606908
2547.72767.0537891183598-19.3267891183598
2647.21664.7832309663564-17.5672309663564
2745.69863.9761614171766-18.2781614171766
2845.56862.919531454469-17.3515314544690
2944.10258.3867816040563-14.2847816040563
3042.48953.2021268719709-10.7131268719709
3142.10250.5023263942436-8.40032639424359
3238.25149.3091279463212-11.0581279463212
3337.65748.8578113649368-11.2008113649368
3436.81747.5373611087309-10.7203611087309
3535.81846.6899356886906-10.8719356886906
3635.68546.1961358021216-10.5111358021216
3735.51655.6341284963133-20.1181284963133
3835.10152.5079816546146-17.4069816546146
3934.17352.5385262442664-18.3655262442664
4033.23451.4576797041484-18.2236797041484
4129.63544.3666706247043-14.7316706247043
4227.7541.7966780934392-14.0466780934392
4327.08639.0609769460366-11.9749769460366
4426.38538.5342788110774-12.1492788110774
4525.00937.4203624882323-12.4113624882323
4624.07636.1145183821435-12.0385183821435
4723.77935.2648519279336-11.4858519279336
4823.29634.7442088903132-11.4482088903132
4923.0144.1906238627731-21.1806238627731
5022.97141.7473495355205-18.7763495355205
5122.72341.1076803405487-18.3846803405487
5221.93840.0419449809578-18.1039449809578
5321.44633.5323745274941-12.0863745274941
5421.40230.3619245571503-8.95992455715032
5521.227.6354929338431-6.43549293384313
5620.8927.0950697821455-6.20506978214547
5720.8525.9883724374437-5.13837243744369
5819.7324.0577041607592-4.32770416075922
5919.66123.8195971863115-4.15859718631155
6019.26423.3022157953447-4.03821579534465
6118.9832.7631980908499-13.7831980908499
6218.83630.3539975580862-11.5179975580862
6317.20329.6630326464873-12.4600326464873
6417.0628.5969915151768-11.5369915151768
6516.82822.5363288375538-5.70832883755381
6616.57416.24468002084740.329319979152554
6716.21816.19414828728570.0238517127143203
6816.05515.66528592684520.389714073154772
6915.47114.54145836870300.929541631296982
7015.23713.22094875671332.01605124328673
7115.10511.25468962156653.85031037843353
7214.5611.58563018216532.97436981783465
7314.2921.3063277091048-7.01632770910477
7414.14819.2256962742428-5.07769627424279
7514.10518.2151518893415-4.11015188934148
7613.99517.1417079627953-3.14670796279532
7713.96112.62466293201451.33633706798546
7813.9166.61320641990767.3027935800924
7912.9824.745529953433288.23647004656672
8012.6714.216888046425128.45411195357488
8111.4153.09523753429668.3197624657034
8211.3931.771875806002819.62112419399719
8311.3630.92238718240523610.4406128175948
8411.1520.40811243584891710.7438875641511
8510.738.66542044317682.06457955682320
8610.4027.769737924588272.63226207541173
8710.0046.76688494984683.2371150501532
889.9025.705632873880274.19636712611973
899.8571.173140109927988.68385989007202
909.738-5.5497746731661415.2877746731661
919.625-6.7064820985534316.3314820985534
929.228-7.2374686805737716.4654686805738
939.145-8.3622694551290217.507269455129
948.846-9.6817592483266218.5277592483266
958.749-10.523504645743619.2725046457436
968.718-11.036152357560919.7541523575609
978.569-1.5843201117411310.1533201117411
988.473-4.4670589636927612.9400589636928
998.309-5.5921155188111513.9011155188111
1008.103-5.7441953266821613.8471953266822

\begin{tabular}{lllllllll}
\hline
Multiple Linear Regression - Actuals, Interpolation, and Residuals \tabularnewline
Time or Index & Actuals & InterpolationForecast & ResidualsPrediction Error \tabularnewline
1 & 168.836 & 89.6741682853434 & 79.1618317146566 \tabularnewline
2 & 150.581 & 87.6248460551269 & 62.9561539448731 \tabularnewline
3 & 149.514 & 86.5894845733534 & 62.9245154266466 \tabularnewline
4 & 148.281 & 85.5482484009716 & 62.7327515990284 \tabularnewline
5 & 125.968 & 81.039695765655 & 44.928304234345 \tabularnewline
6 & 96.566 & 76.0620898733107 & 20.5039101266893 \tabularnewline
7 & 84.416 & 73.324265154133 & 11.0917348458670 \tabularnewline
8 & 84.222 & 72.8127227765137 & 11.4092772234863 \tabularnewline
9 & 82.354 & 71.7002073755144 & 10.6537926244856 \tabularnewline
10 & 75.213 & 70.3165517409843 & 4.89644825901565 \tabularnewline
11 & 71.639 & 69.4757565940744 & 2.16324340592564 \tabularnewline
12 & 70.339 & 69.0301393556981 & 1.30886064430191 \tabularnewline
13 & 68.503 & 78.45766410582 & -9.95466410582 \tabularnewline
14 & 68.183 & 76.3652189951572 & -8.18221899515724 \tabularnewline
15 & 66.893 & 75.3571934577904 & -8.46419345779045 \tabularnewline
16 & 61.926 & 74.339458434283 & -12.413458434283 \tabularnewline
17 & 61.63 & 69.767345598594 & -8.137345598594 \tabularnewline
18 & 53.911 & 63.6150688365399 & -9.70406883653993 \tabularnewline
19 & 53.077 & 61.9497424295782 & -8.87274242957818 \tabularnewline
20 & 51.337 & 58.6430953912457 & -7.30609539124566 \tabularnewline
21 & 51.314 & 59.9738198860021 & -8.65981988600213 \tabularnewline
22 & 50.978 & 58.9527992929925 & -7.97479929299251 \tabularnewline
23 & 48.921 & 58.1312864447618 & -9.21028644476177 \tabularnewline
24 & 48.809 & 57.5927098960691 & -8.78370989606908 \tabularnewline
25 & 47.727 & 67.0537891183598 & -19.3267891183598 \tabularnewline
26 & 47.216 & 64.7832309663564 & -17.5672309663564 \tabularnewline
27 & 45.698 & 63.9761614171766 & -18.2781614171766 \tabularnewline
28 & 45.568 & 62.919531454469 & -17.3515314544690 \tabularnewline
29 & 44.102 & 58.3867816040563 & -14.2847816040563 \tabularnewline
30 & 42.489 & 53.2021268719709 & -10.7131268719709 \tabularnewline
31 & 42.102 & 50.5023263942436 & -8.40032639424359 \tabularnewline
32 & 38.251 & 49.3091279463212 & -11.0581279463212 \tabularnewline
33 & 37.657 & 48.8578113649368 & -11.2008113649368 \tabularnewline
34 & 36.817 & 47.5373611087309 & -10.7203611087309 \tabularnewline
35 & 35.818 & 46.6899356886906 & -10.8719356886906 \tabularnewline
36 & 35.685 & 46.1961358021216 & -10.5111358021216 \tabularnewline
37 & 35.516 & 55.6341284963133 & -20.1181284963133 \tabularnewline
38 & 35.101 & 52.5079816546146 & -17.4069816546146 \tabularnewline
39 & 34.173 & 52.5385262442664 & -18.3655262442664 \tabularnewline
40 & 33.234 & 51.4576797041484 & -18.2236797041484 \tabularnewline
41 & 29.635 & 44.3666706247043 & -14.7316706247043 \tabularnewline
42 & 27.75 & 41.7966780934392 & -14.0466780934392 \tabularnewline
43 & 27.086 & 39.0609769460366 & -11.9749769460366 \tabularnewline
44 & 26.385 & 38.5342788110774 & -12.1492788110774 \tabularnewline
45 & 25.009 & 37.4203624882323 & -12.4113624882323 \tabularnewline
46 & 24.076 & 36.1145183821435 & -12.0385183821435 \tabularnewline
47 & 23.779 & 35.2648519279336 & -11.4858519279336 \tabularnewline
48 & 23.296 & 34.7442088903132 & -11.4482088903132 \tabularnewline
49 & 23.01 & 44.1906238627731 & -21.1806238627731 \tabularnewline
50 & 22.971 & 41.7473495355205 & -18.7763495355205 \tabularnewline
51 & 22.723 & 41.1076803405487 & -18.3846803405487 \tabularnewline
52 & 21.938 & 40.0419449809578 & -18.1039449809578 \tabularnewline
53 & 21.446 & 33.5323745274941 & -12.0863745274941 \tabularnewline
54 & 21.402 & 30.3619245571503 & -8.95992455715032 \tabularnewline
55 & 21.2 & 27.6354929338431 & -6.43549293384313 \tabularnewline
56 & 20.89 & 27.0950697821455 & -6.20506978214547 \tabularnewline
57 & 20.85 & 25.9883724374437 & -5.13837243744369 \tabularnewline
58 & 19.73 & 24.0577041607592 & -4.32770416075922 \tabularnewline
59 & 19.661 & 23.8195971863115 & -4.15859718631155 \tabularnewline
60 & 19.264 & 23.3022157953447 & -4.03821579534465 \tabularnewline
61 & 18.98 & 32.7631980908499 & -13.7831980908499 \tabularnewline
62 & 18.836 & 30.3539975580862 & -11.5179975580862 \tabularnewline
63 & 17.203 & 29.6630326464873 & -12.4600326464873 \tabularnewline
64 & 17.06 & 28.5969915151768 & -11.5369915151768 \tabularnewline
65 & 16.828 & 22.5363288375538 & -5.70832883755381 \tabularnewline
66 & 16.574 & 16.2446800208474 & 0.329319979152554 \tabularnewline
67 & 16.218 & 16.1941482872857 & 0.0238517127143203 \tabularnewline
68 & 16.055 & 15.6652859268452 & 0.389714073154772 \tabularnewline
69 & 15.471 & 14.5414583687030 & 0.929541631296982 \tabularnewline
70 & 15.237 & 13.2209487567133 & 2.01605124328673 \tabularnewline
71 & 15.105 & 11.2546896215665 & 3.85031037843353 \tabularnewline
72 & 14.56 & 11.5856301821653 & 2.97436981783465 \tabularnewline
73 & 14.29 & 21.3063277091048 & -7.01632770910477 \tabularnewline
74 & 14.148 & 19.2256962742428 & -5.07769627424279 \tabularnewline
75 & 14.105 & 18.2151518893415 & -4.11015188934148 \tabularnewline
76 & 13.995 & 17.1417079627953 & -3.14670796279532 \tabularnewline
77 & 13.961 & 12.6246629320145 & 1.33633706798546 \tabularnewline
78 & 13.916 & 6.6132064199076 & 7.3027935800924 \tabularnewline
79 & 12.982 & 4.74552995343328 & 8.23647004656672 \tabularnewline
80 & 12.671 & 4.21688804642512 & 8.45411195357488 \tabularnewline
81 & 11.415 & 3.0952375342966 & 8.3197624657034 \tabularnewline
82 & 11.393 & 1.77187580600281 & 9.62112419399719 \tabularnewline
83 & 11.363 & 0.922387182405236 & 10.4406128175948 \tabularnewline
84 & 11.152 & 0.408112435848917 & 10.7438875641511 \tabularnewline
85 & 10.73 & 8.6654204431768 & 2.06457955682320 \tabularnewline
86 & 10.402 & 7.76973792458827 & 2.63226207541173 \tabularnewline
87 & 10.004 & 6.7668849498468 & 3.2371150501532 \tabularnewline
88 & 9.902 & 5.70563287388027 & 4.19636712611973 \tabularnewline
89 & 9.857 & 1.17314010992798 & 8.68385989007202 \tabularnewline
90 & 9.738 & -5.54977467316614 & 15.2877746731661 \tabularnewline
91 & 9.625 & -6.70648209855343 & 16.3314820985534 \tabularnewline
92 & 9.228 & -7.23746868057377 & 16.4654686805738 \tabularnewline
93 & 9.145 & -8.36226945512902 & 17.507269455129 \tabularnewline
94 & 8.846 & -9.68175924832662 & 18.5277592483266 \tabularnewline
95 & 8.749 & -10.5235046457436 & 19.2725046457436 \tabularnewline
96 & 8.718 & -11.0361523575609 & 19.7541523575609 \tabularnewline
97 & 8.569 & -1.58432011174113 & 10.1533201117411 \tabularnewline
98 & 8.473 & -4.46705896369276 & 12.9400589636928 \tabularnewline
99 & 8.309 & -5.59211551881115 & 13.9011155188111 \tabularnewline
100 & 8.103 & -5.74419532668216 & 13.8471953266822 \tabularnewline
\hline
\end{tabular}
%Source: https://freestatistics.org/blog/index.php?pk=5925&T=4

[TABLE]
[ROW][C]Multiple Linear Regression - Actuals, Interpolation, and Residuals[/C][/ROW]
[ROW][C]Time or Index[/C][C]Actuals[/C][C]InterpolationForecast[/C][C]ResidualsPrediction Error[/C][/ROW]
[ROW][C]1[/C][C]168.836[/C][C]89.6741682853434[/C][C]79.1618317146566[/C][/ROW]
[ROW][C]2[/C][C]150.581[/C][C]87.6248460551269[/C][C]62.9561539448731[/C][/ROW]
[ROW][C]3[/C][C]149.514[/C][C]86.5894845733534[/C][C]62.9245154266466[/C][/ROW]
[ROW][C]4[/C][C]148.281[/C][C]85.5482484009716[/C][C]62.7327515990284[/C][/ROW]
[ROW][C]5[/C][C]125.968[/C][C]81.039695765655[/C][C]44.928304234345[/C][/ROW]
[ROW][C]6[/C][C]96.566[/C][C]76.0620898733107[/C][C]20.5039101266893[/C][/ROW]
[ROW][C]7[/C][C]84.416[/C][C]73.324265154133[/C][C]11.0917348458670[/C][/ROW]
[ROW][C]8[/C][C]84.222[/C][C]72.8127227765137[/C][C]11.4092772234863[/C][/ROW]
[ROW][C]9[/C][C]82.354[/C][C]71.7002073755144[/C][C]10.6537926244856[/C][/ROW]
[ROW][C]10[/C][C]75.213[/C][C]70.3165517409843[/C][C]4.89644825901565[/C][/ROW]
[ROW][C]11[/C][C]71.639[/C][C]69.4757565940744[/C][C]2.16324340592564[/C][/ROW]
[ROW][C]12[/C][C]70.339[/C][C]69.0301393556981[/C][C]1.30886064430191[/C][/ROW]
[ROW][C]13[/C][C]68.503[/C][C]78.45766410582[/C][C]-9.95466410582[/C][/ROW]
[ROW][C]14[/C][C]68.183[/C][C]76.3652189951572[/C][C]-8.18221899515724[/C][/ROW]
[ROW][C]15[/C][C]66.893[/C][C]75.3571934577904[/C][C]-8.46419345779045[/C][/ROW]
[ROW][C]16[/C][C]61.926[/C][C]74.339458434283[/C][C]-12.413458434283[/C][/ROW]
[ROW][C]17[/C][C]61.63[/C][C]69.767345598594[/C][C]-8.137345598594[/C][/ROW]
[ROW][C]18[/C][C]53.911[/C][C]63.6150688365399[/C][C]-9.70406883653993[/C][/ROW]
[ROW][C]19[/C][C]53.077[/C][C]61.9497424295782[/C][C]-8.87274242957818[/C][/ROW]
[ROW][C]20[/C][C]51.337[/C][C]58.6430953912457[/C][C]-7.30609539124566[/C][/ROW]
[ROW][C]21[/C][C]51.314[/C][C]59.9738198860021[/C][C]-8.65981988600213[/C][/ROW]
[ROW][C]22[/C][C]50.978[/C][C]58.9527992929925[/C][C]-7.97479929299251[/C][/ROW]
[ROW][C]23[/C][C]48.921[/C][C]58.1312864447618[/C][C]-9.21028644476177[/C][/ROW]
[ROW][C]24[/C][C]48.809[/C][C]57.5927098960691[/C][C]-8.78370989606908[/C][/ROW]
[ROW][C]25[/C][C]47.727[/C][C]67.0537891183598[/C][C]-19.3267891183598[/C][/ROW]
[ROW][C]26[/C][C]47.216[/C][C]64.7832309663564[/C][C]-17.5672309663564[/C][/ROW]
[ROW][C]27[/C][C]45.698[/C][C]63.9761614171766[/C][C]-18.2781614171766[/C][/ROW]
[ROW][C]28[/C][C]45.568[/C][C]62.919531454469[/C][C]-17.3515314544690[/C][/ROW]
[ROW][C]29[/C][C]44.102[/C][C]58.3867816040563[/C][C]-14.2847816040563[/C][/ROW]
[ROW][C]30[/C][C]42.489[/C][C]53.2021268719709[/C][C]-10.7131268719709[/C][/ROW]
[ROW][C]31[/C][C]42.102[/C][C]50.5023263942436[/C][C]-8.40032639424359[/C][/ROW]
[ROW][C]32[/C][C]38.251[/C][C]49.3091279463212[/C][C]-11.0581279463212[/C][/ROW]
[ROW][C]33[/C][C]37.657[/C][C]48.8578113649368[/C][C]-11.2008113649368[/C][/ROW]
[ROW][C]34[/C][C]36.817[/C][C]47.5373611087309[/C][C]-10.7203611087309[/C][/ROW]
[ROW][C]35[/C][C]35.818[/C][C]46.6899356886906[/C][C]-10.8719356886906[/C][/ROW]
[ROW][C]36[/C][C]35.685[/C][C]46.1961358021216[/C][C]-10.5111358021216[/C][/ROW]
[ROW][C]37[/C][C]35.516[/C][C]55.6341284963133[/C][C]-20.1181284963133[/C][/ROW]
[ROW][C]38[/C][C]35.101[/C][C]52.5079816546146[/C][C]-17.4069816546146[/C][/ROW]
[ROW][C]39[/C][C]34.173[/C][C]52.5385262442664[/C][C]-18.3655262442664[/C][/ROW]
[ROW][C]40[/C][C]33.234[/C][C]51.4576797041484[/C][C]-18.2236797041484[/C][/ROW]
[ROW][C]41[/C][C]29.635[/C][C]44.3666706247043[/C][C]-14.7316706247043[/C][/ROW]
[ROW][C]42[/C][C]27.75[/C][C]41.7966780934392[/C][C]-14.0466780934392[/C][/ROW]
[ROW][C]43[/C][C]27.086[/C][C]39.0609769460366[/C][C]-11.9749769460366[/C][/ROW]
[ROW][C]44[/C][C]26.385[/C][C]38.5342788110774[/C][C]-12.1492788110774[/C][/ROW]
[ROW][C]45[/C][C]25.009[/C][C]37.4203624882323[/C][C]-12.4113624882323[/C][/ROW]
[ROW][C]46[/C][C]24.076[/C][C]36.1145183821435[/C][C]-12.0385183821435[/C][/ROW]
[ROW][C]47[/C][C]23.779[/C][C]35.2648519279336[/C][C]-11.4858519279336[/C][/ROW]
[ROW][C]48[/C][C]23.296[/C][C]34.7442088903132[/C][C]-11.4482088903132[/C][/ROW]
[ROW][C]49[/C][C]23.01[/C][C]44.1906238627731[/C][C]-21.1806238627731[/C][/ROW]
[ROW][C]50[/C][C]22.971[/C][C]41.7473495355205[/C][C]-18.7763495355205[/C][/ROW]
[ROW][C]51[/C][C]22.723[/C][C]41.1076803405487[/C][C]-18.3846803405487[/C][/ROW]
[ROW][C]52[/C][C]21.938[/C][C]40.0419449809578[/C][C]-18.1039449809578[/C][/ROW]
[ROW][C]53[/C][C]21.446[/C][C]33.5323745274941[/C][C]-12.0863745274941[/C][/ROW]
[ROW][C]54[/C][C]21.402[/C][C]30.3619245571503[/C][C]-8.95992455715032[/C][/ROW]
[ROW][C]55[/C][C]21.2[/C][C]27.6354929338431[/C][C]-6.43549293384313[/C][/ROW]
[ROW][C]56[/C][C]20.89[/C][C]27.0950697821455[/C][C]-6.20506978214547[/C][/ROW]
[ROW][C]57[/C][C]20.85[/C][C]25.9883724374437[/C][C]-5.13837243744369[/C][/ROW]
[ROW][C]58[/C][C]19.73[/C][C]24.0577041607592[/C][C]-4.32770416075922[/C][/ROW]
[ROW][C]59[/C][C]19.661[/C][C]23.8195971863115[/C][C]-4.15859718631155[/C][/ROW]
[ROW][C]60[/C][C]19.264[/C][C]23.3022157953447[/C][C]-4.03821579534465[/C][/ROW]
[ROW][C]61[/C][C]18.98[/C][C]32.7631980908499[/C][C]-13.7831980908499[/C][/ROW]
[ROW][C]62[/C][C]18.836[/C][C]30.3539975580862[/C][C]-11.5179975580862[/C][/ROW]
[ROW][C]63[/C][C]17.203[/C][C]29.6630326464873[/C][C]-12.4600326464873[/C][/ROW]
[ROW][C]64[/C][C]17.06[/C][C]28.5969915151768[/C][C]-11.5369915151768[/C][/ROW]
[ROW][C]65[/C][C]16.828[/C][C]22.5363288375538[/C][C]-5.70832883755381[/C][/ROW]
[ROW][C]66[/C][C]16.574[/C][C]16.2446800208474[/C][C]0.329319979152554[/C][/ROW]
[ROW][C]67[/C][C]16.218[/C][C]16.1941482872857[/C][C]0.0238517127143203[/C][/ROW]
[ROW][C]68[/C][C]16.055[/C][C]15.6652859268452[/C][C]0.389714073154772[/C][/ROW]
[ROW][C]69[/C][C]15.471[/C][C]14.5414583687030[/C][C]0.929541631296982[/C][/ROW]
[ROW][C]70[/C][C]15.237[/C][C]13.2209487567133[/C][C]2.01605124328673[/C][/ROW]
[ROW][C]71[/C][C]15.105[/C][C]11.2546896215665[/C][C]3.85031037843353[/C][/ROW]
[ROW][C]72[/C][C]14.56[/C][C]11.5856301821653[/C][C]2.97436981783465[/C][/ROW]
[ROW][C]73[/C][C]14.29[/C][C]21.3063277091048[/C][C]-7.01632770910477[/C][/ROW]
[ROW][C]74[/C][C]14.148[/C][C]19.2256962742428[/C][C]-5.07769627424279[/C][/ROW]
[ROW][C]75[/C][C]14.105[/C][C]18.2151518893415[/C][C]-4.11015188934148[/C][/ROW]
[ROW][C]76[/C][C]13.995[/C][C]17.1417079627953[/C][C]-3.14670796279532[/C][/ROW]
[ROW][C]77[/C][C]13.961[/C][C]12.6246629320145[/C][C]1.33633706798546[/C][/ROW]
[ROW][C]78[/C][C]13.916[/C][C]6.6132064199076[/C][C]7.3027935800924[/C][/ROW]
[ROW][C]79[/C][C]12.982[/C][C]4.74552995343328[/C][C]8.23647004656672[/C][/ROW]
[ROW][C]80[/C][C]12.671[/C][C]4.21688804642512[/C][C]8.45411195357488[/C][/ROW]
[ROW][C]81[/C][C]11.415[/C][C]3.0952375342966[/C][C]8.3197624657034[/C][/ROW]
[ROW][C]82[/C][C]11.393[/C][C]1.77187580600281[/C][C]9.62112419399719[/C][/ROW]
[ROW][C]83[/C][C]11.363[/C][C]0.922387182405236[/C][C]10.4406128175948[/C][/ROW]
[ROW][C]84[/C][C]11.152[/C][C]0.408112435848917[/C][C]10.7438875641511[/C][/ROW]
[ROW][C]85[/C][C]10.73[/C][C]8.6654204431768[/C][C]2.06457955682320[/C][/ROW]
[ROW][C]86[/C][C]10.402[/C][C]7.76973792458827[/C][C]2.63226207541173[/C][/ROW]
[ROW][C]87[/C][C]10.004[/C][C]6.7668849498468[/C][C]3.2371150501532[/C][/ROW]
[ROW][C]88[/C][C]9.902[/C][C]5.70563287388027[/C][C]4.19636712611973[/C][/ROW]
[ROW][C]89[/C][C]9.857[/C][C]1.17314010992798[/C][C]8.68385989007202[/C][/ROW]
[ROW][C]90[/C][C]9.738[/C][C]-5.54977467316614[/C][C]15.2877746731661[/C][/ROW]
[ROW][C]91[/C][C]9.625[/C][C]-6.70648209855343[/C][C]16.3314820985534[/C][/ROW]
[ROW][C]92[/C][C]9.228[/C][C]-7.23746868057377[/C][C]16.4654686805738[/C][/ROW]
[ROW][C]93[/C][C]9.145[/C][C]-8.36226945512902[/C][C]17.507269455129[/C][/ROW]
[ROW][C]94[/C][C]8.846[/C][C]-9.68175924832662[/C][C]18.5277592483266[/C][/ROW]
[ROW][C]95[/C][C]8.749[/C][C]-10.5235046457436[/C][C]19.2725046457436[/C][/ROW]
[ROW][C]96[/C][C]8.718[/C][C]-11.0361523575609[/C][C]19.7541523575609[/C][/ROW]
[ROW][C]97[/C][C]8.569[/C][C]-1.58432011174113[/C][C]10.1533201117411[/C][/ROW]
[ROW][C]98[/C][C]8.473[/C][C]-4.46705896369276[/C][C]12.9400589636928[/C][/ROW]
[ROW][C]99[/C][C]8.309[/C][C]-5.59211551881115[/C][C]13.9011155188111[/C][/ROW]
[ROW][C]100[/C][C]8.103[/C][C]-5.74419532668216[/C][C]13.8471953266822[/C][/ROW]
[/TABLE]
Source: https://freestatistics.org/blog/index.php?pk=5925&T=4

Globally Unique Identifier (entire table): ba.freestatistics.org/blog/index.php?pk=5925&T=4

As an alternative you can also use a QR Code:  

The GUIDs for individual cells are displayed in the table below:

Multiple Linear Regression - Actuals, Interpolation, and Residuals
Time or IndexActualsInterpolationForecastResidualsPrediction Error
1168.83689.674168285343479.1618317146566
2150.58187.624846055126962.9561539448731
3149.51486.589484573353462.9245154266466
4148.28185.548248400971662.7327515990284
5125.96881.03969576565544.928304234345
696.56676.062089873310720.5039101266893
784.41673.32426515413311.0917348458670
884.22272.812722776513711.4092772234863
982.35471.700207375514410.6537926244856
1075.21370.31655174098434.89644825901565
1171.63969.47575659407442.16324340592564
1270.33969.03013935569811.30886064430191
1368.50378.45766410582-9.95466410582
1468.18376.3652189951572-8.18221899515724
1566.89375.3571934577904-8.46419345779045
1661.92674.339458434283-12.413458434283
1761.6369.767345598594-8.137345598594
1853.91163.6150688365399-9.70406883653993
1953.07761.9497424295782-8.87274242957818
2051.33758.6430953912457-7.30609539124566
2151.31459.9738198860021-8.65981988600213
2250.97858.9527992929925-7.97479929299251
2348.92158.1312864447618-9.21028644476177
2448.80957.5927098960691-8.78370989606908
2547.72767.0537891183598-19.3267891183598
2647.21664.7832309663564-17.5672309663564
2745.69863.9761614171766-18.2781614171766
2845.56862.919531454469-17.3515314544690
2944.10258.3867816040563-14.2847816040563
3042.48953.2021268719709-10.7131268719709
3142.10250.5023263942436-8.40032639424359
3238.25149.3091279463212-11.0581279463212
3337.65748.8578113649368-11.2008113649368
3436.81747.5373611087309-10.7203611087309
3535.81846.6899356886906-10.8719356886906
3635.68546.1961358021216-10.5111358021216
3735.51655.6341284963133-20.1181284963133
3835.10152.5079816546146-17.4069816546146
3934.17352.5385262442664-18.3655262442664
4033.23451.4576797041484-18.2236797041484
4129.63544.3666706247043-14.7316706247043
4227.7541.7966780934392-14.0466780934392
4327.08639.0609769460366-11.9749769460366
4426.38538.5342788110774-12.1492788110774
4525.00937.4203624882323-12.4113624882323
4624.07636.1145183821435-12.0385183821435
4723.77935.2648519279336-11.4858519279336
4823.29634.7442088903132-11.4482088903132
4923.0144.1906238627731-21.1806238627731
5022.97141.7473495355205-18.7763495355205
5122.72341.1076803405487-18.3846803405487
5221.93840.0419449809578-18.1039449809578
5321.44633.5323745274941-12.0863745274941
5421.40230.3619245571503-8.95992455715032
5521.227.6354929338431-6.43549293384313
5620.8927.0950697821455-6.20506978214547
5720.8525.9883724374437-5.13837243744369
5819.7324.0577041607592-4.32770416075922
5919.66123.8195971863115-4.15859718631155
6019.26423.3022157953447-4.03821579534465
6118.9832.7631980908499-13.7831980908499
6218.83630.3539975580862-11.5179975580862
6317.20329.6630326464873-12.4600326464873
6417.0628.5969915151768-11.5369915151768
6516.82822.5363288375538-5.70832883755381
6616.57416.24468002084740.329319979152554
6716.21816.19414828728570.0238517127143203
6816.05515.66528592684520.389714073154772
6915.47114.54145836870300.929541631296982
7015.23713.22094875671332.01605124328673
7115.10511.25468962156653.85031037843353
7214.5611.58563018216532.97436981783465
7314.2921.3063277091048-7.01632770910477
7414.14819.2256962742428-5.07769627424279
7514.10518.2151518893415-4.11015188934148
7613.99517.1417079627953-3.14670796279532
7713.96112.62466293201451.33633706798546
7813.9166.61320641990767.3027935800924
7912.9824.745529953433288.23647004656672
8012.6714.216888046425128.45411195357488
8111.4153.09523753429668.3197624657034
8211.3931.771875806002819.62112419399719
8311.3630.92238718240523610.4406128175948
8411.1520.40811243584891710.7438875641511
8510.738.66542044317682.06457955682320
8610.4027.769737924588272.63226207541173
8710.0046.76688494984683.2371150501532
889.9025.705632873880274.19636712611973
899.8571.173140109927988.68385989007202
909.738-5.5497746731661415.2877746731661
919.625-6.7064820985534316.3314820985534
929.228-7.2374686805737716.4654686805738
939.145-8.3622694551290217.507269455129
948.846-9.6817592483266218.5277592483266
958.749-10.523504645743619.2725046457436
968.718-11.036152357560919.7541523575609
978.569-1.5843201117411310.1533201117411
988.473-4.4670589636927612.9400589636928
998.309-5.5921155188111513.9011155188111
1008.103-5.7441953266821613.8471953266822


Parameters (Session):
par1 = 1 ; par2 = Include Monthly Dummies ; par3 = Linear Trend ;
Parameters (R input):
par1 = 1 ; par2 = Include Monthly Dummies ; par3 = Linear Trend ;
R code (references can be found in the software module):
library(lattice)
par1 <- as.numeric(par1)
x <- t(y)
k <- length(x[1,])
n <- length(x[,1])
x1 <- cbind(x[,par1], x[,1:k!=par1])
mycolnames <- c(colnames(x)[par1], colnames(x)[1:k!=par1])
colnames(x1) <- mycolnames #colnames(x)[par1]
x <- x1
if (par3 == 'First Differences'){
x2 <- array(0, dim=c(n-1,k), dimnames=list(1:(n-1), paste('(1-B)',colnames(x),sep='')))
for (i in 1:n-1) {
for (j in 1:k) {
x2[i,j] <- x[i+1,j] - x[i,j]
}
}
x <- x2
}
if (par2 == 'Include Monthly Dummies'){
x2 <- array(0, dim=c(n,11), dimnames=list(1:n, paste('M', seq(1:11), sep ='')))
for (i in 1:11){
x2[seq(i,n,12),i] <- 1
}
x <- cbind(x, x2)
}
if (par2 == 'Include Quarterly Dummies'){
x2 <- array(0, dim=c(n,3), dimnames=list(1:n, paste('Q', seq(1:3), sep ='')))
for (i in 1:3){
x2[seq(i,n,4),i] <- 1
}
x <- cbind(x, x2)
}
k <- length(x[1,])
if (par3 == 'Linear Trend'){
x <- cbind(x, c(1:n))
colnames(x)[k+1] <- 't'
}
x
k <- length(x[1,])
df <- as.data.frame(x)
(mylm <- lm(df))
(mysum <- summary(mylm))
bitmap(file='test0.png')
plot(x[,1], type='l', main='Actuals and Interpolation', ylab='value of Actuals and Interpolation (dots)', xlab='time or index')
points(x[,1]-mysum$resid)
grid()
dev.off()
bitmap(file='test1.png')
plot(mysum$resid, type='b', pch=19, main='Residuals', ylab='value of Residuals', xlab='time or index')
grid()
dev.off()
bitmap(file='test2.png')
hist(mysum$resid, main='Residual Histogram', xlab='values of Residuals')
grid()
dev.off()
bitmap(file='test3.png')
densityplot(~mysum$resid,col='black',main='Residual Density Plot', xlab='values of Residuals')
dev.off()
bitmap(file='test4.png')
qqnorm(mysum$resid, main='Residual Normal Q-Q Plot')
grid()
dev.off()
(myerror <- as.ts(mysum$resid))
bitmap(file='test5.png')
dum <- cbind(lag(myerror,k=1),myerror)
dum
dum1 <- dum[2:length(myerror),]
dum1
z <- as.data.frame(dum1)
z
plot(z,main=paste('Residual Lag plot, lowess, and regression line'), ylab='values of Residuals', xlab='lagged values of Residuals')
lines(lowess(z))
abline(lm(z))
grid()
dev.off()
bitmap(file='test6.png')
acf(mysum$resid, lag.max=length(mysum$resid)/2, main='Residual Autocorrelation Function')
grid()
dev.off()
bitmap(file='test7.png')
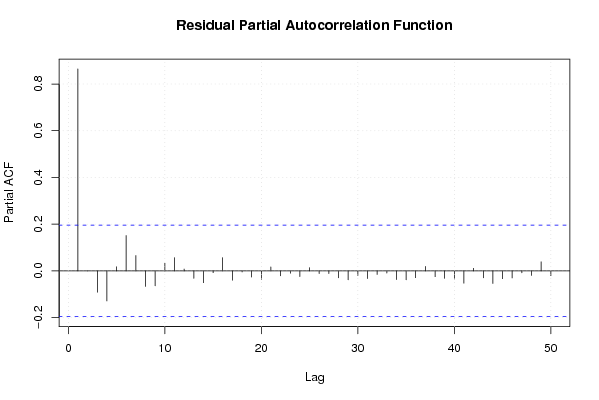
pacf(mysum$resid, lag.max=length(mysum$resid)/2, main='Residual Partial Autocorrelation Function')
grid()
dev.off()
bitmap(file='test8.png')
opar <- par(mfrow = c(2,2), oma = c(0, 0, 1.1, 0))
plot(mylm, las = 1, sub='Residual Diagnostics')
par(opar)
dev.off()
load(file='createtable')
a<-table.start()
a<-table.row.start(a)
a<-table.element(a, 'Multiple Linear Regression - Estimated Regression Equation', 1, TRUE)
a<-table.row.end(a)
myeq <- colnames(x)[1]
myeq <- paste(myeq, '[t] = ', sep='')
for (i in 1:k){
if (mysum$coefficients[i,1] > 0) myeq <- paste(myeq, '+', '')
myeq <- paste(myeq, mysum$coefficients[i,1], sep=' ')
if (rownames(mysum$coefficients)[i] != '(Intercept)') {
myeq <- paste(myeq, rownames(mysum$coefficients)[i], sep='')
if (rownames(mysum$coefficients)[i] != 't') myeq <- paste(myeq, '[t]', sep='')
}
}
myeq <- paste(myeq, ' + e[t]')
a<-table.row.start(a)
a<-table.element(a, myeq)
a<-table.row.end(a)
a<-table.end(a)
table.save(a,file='mytable1.tab')
a<-table.start()
a<-table.row.start(a)
a<-table.element(a,hyperlink('ols1.htm','Multiple Linear Regression - Ordinary Least Squares',''), 6, TRUE)
a<-table.row.end(a)
a<-table.row.start(a)
a<-table.element(a,'Variable',header=TRUE)
a<-table.element(a,'Parameter',header=TRUE)
a<-table.element(a,'S.D.',header=TRUE)
a<-table.element(a,'T-STAT
H0: parameter = 0',header=TRUE)
a<-table.element(a,'2-tail p-value',header=TRUE)
a<-table.element(a,'1-tail p-value',header=TRUE)
a<-table.row.end(a)
for (i in 1:k){
a<-table.row.start(a)
a<-table.element(a,rownames(mysum$coefficients)[i],header=TRUE)
a<-table.element(a,mysum$coefficients[i,1])
a<-table.element(a, round(mysum$coefficients[i,2],6))
a<-table.element(a, round(mysum$coefficients[i,3],4))
a<-table.element(a, round(mysum$coefficients[i,4],6))
a<-table.element(a, round(mysum$coefficients[i,4]/2,6))
a<-table.row.end(a)
}
a<-table.end(a)
table.save(a,file='mytable2.tab')
a<-table.start()
a<-table.row.start(a)
a<-table.element(a, 'Multiple Linear Regression - Regression Statistics', 2, TRUE)
a<-table.row.end(a)
a<-table.row.start(a)
a<-table.element(a, 'Multiple R',1,TRUE)
a<-table.element(a, sqrt(mysum$r.squared))
a<-table.row.end(a)
a<-table.row.start(a)
a<-table.element(a, 'R-squared',1,TRUE)
a<-table.element(a, mysum$r.squared)
a<-table.row.end(a)
a<-table.row.start(a)
a<-table.element(a, 'Adjusted R-squared',1,TRUE)
a<-table.element(a, mysum$adj.r.squared)
a<-table.row.end(a)
a<-table.row.start(a)
a<-table.element(a, 'F-TEST (value)',1,TRUE)
a<-table.element(a, mysum$fstatistic[1])
a<-table.row.end(a)
a<-table.row.start(a)
a<-table.element(a, 'F-TEST (DF numerator)',1,TRUE)
a<-table.element(a, mysum$fstatistic[2])
a<-table.row.end(a)
a<-table.row.start(a)
a<-table.element(a, 'F-TEST (DF denominator)',1,TRUE)
a<-table.element(a, mysum$fstatistic[3])
a<-table.row.end(a)
a<-table.row.start(a)
a<-table.element(a, 'p-value',1,TRUE)
a<-table.element(a, 1-pf(mysum$fstatistic[1],mysum$fstatistic[2],mysum$fstatistic[3]))
a<-table.row.end(a)
a<-table.row.start(a)
a<-table.element(a, 'Multiple Linear Regression - Residual Statistics', 2, TRUE)
a<-table.row.end(a)
a<-table.row.start(a)
a<-table.element(a, 'Residual Standard Deviation',1,TRUE)
a<-table.element(a, mysum$sigma)
a<-table.row.end(a)
a<-table.row.start(a)
a<-table.element(a, 'Sum Squared Residuals',1,TRUE)
a<-table.element(a, sum(myerror*myerror))
a<-table.row.end(a)
a<-table.end(a)
table.save(a,file='mytable3.tab')
a<-table.start()
a<-table.row.start(a)
a<-table.element(a, 'Multiple Linear Regression - Actuals, Interpolation, and Residuals', 4, TRUE)
a<-table.row.end(a)
a<-table.row.start(a)
a<-table.element(a, 'Time or Index', 1, TRUE)
a<-table.element(a, 'Actuals', 1, TRUE)
a<-table.element(a, 'Interpolation
Forecast', 1, TRUE)
a<-table.element(a, 'Residuals
Prediction Error', 1, TRUE)
a<-table.row.end(a)
for (i in 1:n) {
a<-table.row.start(a)
a<-table.element(a,i, 1, TRUE)
a<-table.element(a,x[i])
a<-table.element(a,x[i]-mysum$resid[i])
a<-table.element(a,mysum$resid[i])
a<-table.row.end(a)
}
a<-table.end(a)
table.save(a,file='mytable4.tab')