Free Statistics

of Irreproducible Research!

Author's title

Author*Unverified author*
R Software Modulerwasp_multipleregression.wasp
Title produced by softwareMultiple Regression
Date of computationWed, 21 Nov 2007 15:03:55 -0700
Cite this page as followsStatistical Computations at FreeStatistics.org, Office for Research Development and Education, URL https://freestatistics.org/blog/index.php?v=date/2007/Nov/21/t1195682241mywrjtolkrpxkqw.htm/, Retrieved Tue, 07 May 2024 18:37:17 +0000
Statistical Computations at FreeStatistics.org, Office for Research Development and Education, URL https://freestatistics.org/blog/index.php?pk=5899, Retrieved Tue, 07 May 2024 18:37:17 +0000
QR Codes:

Original text written by user:
IsPrivate?No (this computation is public)
User-defined keywordsSeasonal dummies
Estimated Impact271
Family? (F = Feedback message, R = changed R code, M = changed R Module, P = changed Parameters, D = changed Data)
-       [Multiple Regression] [Workshop 3 Q3] [2007-11-21 22:03:55] [44cf2be50bc8700e14714598feda9df9] [Current]
Feedback Forum

Post a new message
Dataseries X:
523	0
519	1
509	1
512	1
519	0
517	0
510	1
509	1
501	0
507	1
569	0
580	0
578	1
565	1
547	0
555	0
562	0
561	0
555	1
544	1
537	1
543	1
594	1
611	0
613	1
611	1
594	1
595	0
591	0
589	0
584	1
573	1
567	0
569	1
621	0
629	0
628	1
612	1
595	1
597	0
593	1
590	0
580	1
574	1
573	1
573	1
620	0
626	0
620	1
588	1
566	1
557	0
561	1
549	1
532	1
526	1
511	1
499	1
555	0
565	1
542	1


Summary of compuational transaction
Raw Inputview raw input (R code)
Raw Outputview raw output of R engine
Computing time3 seconds
R Server'Gwilym Jenkins' @ 72.249.127.135

\begin{tabular}{lllllllll}
\hline
Summary of compuational transaction \tabularnewline
Raw Input & view raw input (R code)  \tabularnewline
Raw Output & view raw output of R engine  \tabularnewline
Computing time & 3 seconds \tabularnewline
R Server & 'Gwilym Jenkins' @ 72.249.127.135 \tabularnewline
\hline
\end{tabular}
%Source: https://freestatistics.org/blog/index.php?pk=5899&T=0

[TABLE]
[ROW][C]Summary of compuational transaction[/C][/ROW]
[ROW][C]Raw Input[/C][C]view raw input (R code) [/C][/ROW]
[ROW][C]Raw Output[/C][C]view raw output of R engine [/C][/ROW]
[ROW][C]Computing time[/C][C]3 seconds[/C][/ROW]
[ROW][C]R Server[/C][C]'Gwilym Jenkins' @ 72.249.127.135[/C][/ROW]
[/TABLE]
Source: https://freestatistics.org/blog/index.php?pk=5899&T=0

Globally Unique Identifier (entire table): ba.freestatistics.org/blog/index.php?pk=5899&T=0

As an alternative you can also use a QR Code:  

The GUIDs for individual cells are displayed in the table below:

Summary of compuational transaction
Raw Inputview raw input (R code)
Raw Outputview raw output of R engine
Computing time3 seconds
R Server'Gwilym Jenkins' @ 72.249.127.135


Multiple Linear Regression - Estimated Regression Equation
y[t] = + 601.951152073733 + 1.24423963133640x[t] -18.9880184331796M1[t] -24.1953917050691M2[t] -40.7465437788018M3[t] -39M4[t] -37.2488479262673M5[t] -41M6[t] -50.9953917050691M7[t] -57.9953917050691M8[t] -64.8976958525346M9[t] -64.9953917050692M10[t] -10.4000000000000M11[t] + e[t]

\begin{tabular}{lllllllll}
\hline
Multiple Linear Regression - Estimated Regression Equation \tabularnewline
y[t] =  +  601.951152073733 +  1.24423963133640x[t] -18.9880184331796M1[t] -24.1953917050691M2[t] -40.7465437788018M3[t] -39M4[t] -37.2488479262673M5[t] -41M6[t] -50.9953917050691M7[t] -57.9953917050691M8[t] -64.8976958525346M9[t] -64.9953917050692M10[t] -10.4000000000000M11[t]  + e[t] \tabularnewline
\hline
\end{tabular}
%Source: https://freestatistics.org/blog/index.php?pk=5899&T=1

[TABLE]
[ROW][C]Multiple Linear Regression - Estimated Regression Equation[/C][/ROW]
[ROW][C]y[t] =  +  601.951152073733 +  1.24423963133640x[t] -18.9880184331796M1[t] -24.1953917050691M2[t] -40.7465437788018M3[t] -39M4[t] -37.2488479262673M5[t] -41M6[t] -50.9953917050691M7[t] -57.9953917050691M8[t] -64.8976958525346M9[t] -64.9953917050692M10[t] -10.4000000000000M11[t]  + e[t][/C][/ROW]
[/TABLE]
Source: https://freestatistics.org/blog/index.php?pk=5899&T=1

Globally Unique Identifier (entire table): ba.freestatistics.org/blog/index.php?pk=5899&T=1

As an alternative you can also use a QR Code:  

The GUIDs for individual cells are displayed in the table below:

Multiple Linear Regression - Estimated Regression Equation
y[t] = + 601.951152073733 + 1.24423963133640x[t] -18.9880184331796M1[t] -24.1953917050691M2[t] -40.7465437788018M3[t] -39M4[t] -37.2488479262673M5[t] -41M6[t] -50.9953917050691M7[t] -57.9953917050691M8[t] -64.8976958525346M9[t] -64.9953917050692M10[t] -10.4000000000000M11[t] + e[t]


Multiple Linear Regression - Ordinary Least Squares
VariableParameterS.D.T-STATH0: parameter = 02-tail p-value1-tail p-value
(Intercept)601.95115207373315.45853438.939700
x1.2442396313364012.6783140.09810.922230.461115
M1-18.988018433179622.153819-0.85710.3956490.197825
M2-24.195391705069123.831633-1.01530.3150710.157535
M3-40.746543778801822.867873-1.78180.0811050.040552
M4-3921.565559-1.80840.0768050.038402
M5-37.248847926267321.714118-1.71540.0927180.046359
M6-4121.565559-1.90120.0632910.031646
M7-50.995391705069123.831633-2.13980.0374810.01874
M8-57.995391705069123.831633-2.43350.0187250.009362
M9-64.897695852534622.153819-2.92940.0051830.002592
M10-64.995391705069223.831633-2.72730.0088920.004446
M11-10.400000000000021.565559-0.48230.631820.31591

\begin{tabular}{lllllllll}
\hline
Multiple Linear Regression - Ordinary Least Squares \tabularnewline
Variable & Parameter & S.D. & T-STATH0: parameter = 0 & 2-tail p-value & 1-tail p-value \tabularnewline
(Intercept) & 601.951152073733 & 15.458534 & 38.9397 & 0 & 0 \tabularnewline
x & 1.24423963133640 & 12.678314 & 0.0981 & 0.92223 & 0.461115 \tabularnewline
M1 & -18.9880184331796 & 22.153819 & -0.8571 & 0.395649 & 0.197825 \tabularnewline
M2 & -24.1953917050691 & 23.831633 & -1.0153 & 0.315071 & 0.157535 \tabularnewline
M3 & -40.7465437788018 & 22.867873 & -1.7818 & 0.081105 & 0.040552 \tabularnewline
M4 & -39 & 21.565559 & -1.8084 & 0.076805 & 0.038402 \tabularnewline
M5 & -37.2488479262673 & 21.714118 & -1.7154 & 0.092718 & 0.046359 \tabularnewline
M6 & -41 & 21.565559 & -1.9012 & 0.063291 & 0.031646 \tabularnewline
M7 & -50.9953917050691 & 23.831633 & -2.1398 & 0.037481 & 0.01874 \tabularnewline
M8 & -57.9953917050691 & 23.831633 & -2.4335 & 0.018725 & 0.009362 \tabularnewline
M9 & -64.8976958525346 & 22.153819 & -2.9294 & 0.005183 & 0.002592 \tabularnewline
M10 & -64.9953917050692 & 23.831633 & -2.7273 & 0.008892 & 0.004446 \tabularnewline
M11 & -10.4000000000000 & 21.565559 & -0.4823 & 0.63182 & 0.31591 \tabularnewline
\hline
\end{tabular}
%Source: https://freestatistics.org/blog/index.php?pk=5899&T=2

[TABLE]
[ROW][C]Multiple Linear Regression - Ordinary Least Squares[/C][/ROW]
[ROW][C]Variable[/C][C]Parameter[/C][C]S.D.[/C][C]T-STATH0: parameter = 0[/C][C]2-tail p-value[/C][C]1-tail p-value[/C][/ROW]
[ROW][C](Intercept)[/C][C]601.951152073733[/C][C]15.458534[/C][C]38.9397[/C][C]0[/C][C]0[/C][/ROW]
[ROW][C]x[/C][C]1.24423963133640[/C][C]12.678314[/C][C]0.0981[/C][C]0.92223[/C][C]0.461115[/C][/ROW]
[ROW][C]M1[/C][C]-18.9880184331796[/C][C]22.153819[/C][C]-0.8571[/C][C]0.395649[/C][C]0.197825[/C][/ROW]
[ROW][C]M2[/C][C]-24.1953917050691[/C][C]23.831633[/C][C]-1.0153[/C][C]0.315071[/C][C]0.157535[/C][/ROW]
[ROW][C]M3[/C][C]-40.7465437788018[/C][C]22.867873[/C][C]-1.7818[/C][C]0.081105[/C][C]0.040552[/C][/ROW]
[ROW][C]M4[/C][C]-39[/C][C]21.565559[/C][C]-1.8084[/C][C]0.076805[/C][C]0.038402[/C][/ROW]
[ROW][C]M5[/C][C]-37.2488479262673[/C][C]21.714118[/C][C]-1.7154[/C][C]0.092718[/C][C]0.046359[/C][/ROW]
[ROW][C]M6[/C][C]-41[/C][C]21.565559[/C][C]-1.9012[/C][C]0.063291[/C][C]0.031646[/C][/ROW]
[ROW][C]M7[/C][C]-50.9953917050691[/C][C]23.831633[/C][C]-2.1398[/C][C]0.037481[/C][C]0.01874[/C][/ROW]
[ROW][C]M8[/C][C]-57.9953917050691[/C][C]23.831633[/C][C]-2.4335[/C][C]0.018725[/C][C]0.009362[/C][/ROW]
[ROW][C]M9[/C][C]-64.8976958525346[/C][C]22.153819[/C][C]-2.9294[/C][C]0.005183[/C][C]0.002592[/C][/ROW]
[ROW][C]M10[/C][C]-64.9953917050692[/C][C]23.831633[/C][C]-2.7273[/C][C]0.008892[/C][C]0.004446[/C][/ROW]
[ROW][C]M11[/C][C]-10.4000000000000[/C][C]21.565559[/C][C]-0.4823[/C][C]0.63182[/C][C]0.31591[/C][/ROW]
[/TABLE]
Source: https://freestatistics.org/blog/index.php?pk=5899&T=2

Globally Unique Identifier (entire table): ba.freestatistics.org/blog/index.php?pk=5899&T=2

As an alternative you can also use a QR Code:  

The GUIDs for individual cells are displayed in the table below:

Multiple Linear Regression - Ordinary Least Squares
VariableParameterS.D.T-STATH0: parameter = 02-tail p-value1-tail p-value
(Intercept)601.95115207373315.45853438.939700
x1.2442396313364012.6783140.09810.922230.461115
M1-18.988018433179622.153819-0.85710.3956490.197825
M2-24.195391705069123.831633-1.01530.3150710.157535
M3-40.746543778801822.867873-1.78180.0811050.040552
M4-3921.565559-1.80840.0768050.038402
M5-37.248847926267321.714118-1.71540.0927180.046359
M6-4121.565559-1.90120.0632910.031646
M7-50.995391705069123.831633-2.13980.0374810.01874
M8-57.995391705069123.831633-2.43350.0187250.009362
M9-64.897695852534622.153819-2.92940.0051830.002592
M10-64.995391705069223.831633-2.72730.0088920.004446
M11-10.400000000000021.565559-0.48230.631820.31591


Multiple Linear Regression - Regression Statistics
Multiple R0.547179904465269
R-squared0.299405847850621
Adjusted R-squared0.124257309813276
F-TEST (value)1.70943960598051
F-TEST (DF numerator)12
F-TEST (DF denominator)48
p-value0.0943120423223625
Multiple Linear Regression - Residual Statistics
Residual Standard Deviation34.0981432300322
Sum Squared Residuals55808.8018433179

\begin{tabular}{lllllllll}
\hline
Multiple Linear Regression - Regression Statistics \tabularnewline
Multiple R & 0.547179904465269 \tabularnewline
R-squared & 0.299405847850621 \tabularnewline
Adjusted R-squared & 0.124257309813276 \tabularnewline
F-TEST (value) & 1.70943960598051 \tabularnewline
F-TEST (DF numerator) & 12 \tabularnewline
F-TEST (DF denominator) & 48 \tabularnewline
p-value & 0.0943120423223625 \tabularnewline
Multiple Linear Regression - Residual Statistics \tabularnewline
Residual Standard Deviation & 34.0981432300322 \tabularnewline
Sum Squared Residuals & 55808.8018433179 \tabularnewline
\hline
\end{tabular}
%Source: https://freestatistics.org/blog/index.php?pk=5899&T=3

[TABLE]
[ROW][C]Multiple Linear Regression - Regression Statistics[/C][/ROW]
[ROW][C]Multiple R[/C][C]0.547179904465269[/C][/ROW]
[ROW][C]R-squared[/C][C]0.299405847850621[/C][/ROW]
[ROW][C]Adjusted R-squared[/C][C]0.124257309813276[/C][/ROW]
[ROW][C]F-TEST (value)[/C][C]1.70943960598051[/C][/ROW]
[ROW][C]F-TEST (DF numerator)[/C][C]12[/C][/ROW]
[ROW][C]F-TEST (DF denominator)[/C][C]48[/C][/ROW]
[ROW][C]p-value[/C][C]0.0943120423223625[/C][/ROW]
[ROW][C]Multiple Linear Regression - Residual Statistics[/C][/ROW]
[ROW][C]Residual Standard Deviation[/C][C]34.0981432300322[/C][/ROW]
[ROW][C]Sum Squared Residuals[/C][C]55808.8018433179[/C][/ROW]
[/TABLE]
Source: https://freestatistics.org/blog/index.php?pk=5899&T=3

Globally Unique Identifier (entire table): ba.freestatistics.org/blog/index.php?pk=5899&T=3

As an alternative you can also use a QR Code:  

The GUIDs for individual cells are displayed in the table below:

Multiple Linear Regression - Regression Statistics
Multiple R0.547179904465269
R-squared0.299405847850621
Adjusted R-squared0.124257309813276
F-TEST (value)1.70943960598051
F-TEST (DF numerator)12
F-TEST (DF denominator)48
p-value0.0943120423223625
Multiple Linear Regression - Residual Statistics
Residual Standard Deviation34.0981432300322
Sum Squared Residuals55808.8018433179


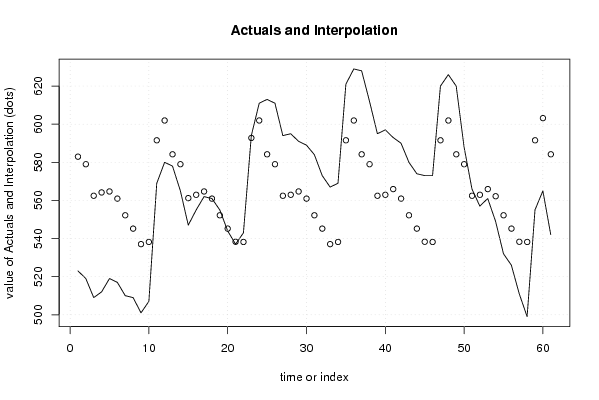
Multiple Linear Regression - Actuals, Interpolation, and Residuals
Time or IndexActualsInterpolationForecastResidualsPrediction Error
1523582.963133640553-59.9631336405528
2519579-59.9999999999999
3509562.448847926267-53.4488479262673
4512564.195391705069-52.1953917050690
5519564.702304147465-45.7023041474655
6517560.951152073733-43.9511520737328
7510552.2-42.2
8509545.2-36.2
9501537.053456221198-36.0534562211981
10507538.2-31.2000000000000
11569591.551152073733-22.5511520737328
12580601.951152073733-21.9511520737327
13578584.20737327189-6.20737327188945
14565579-14
15547561.204608294931-14.2046082949309
16555562.951152073733-7.95115207373274
17562564.702304147465-2.70230414746545
18561560.9511520737330.0488479262672605
19555552.22.80000000000001
20544545.2-1.19999999999999
21537538.297695852535-1.29769585253455
22543538.24.80000000000003
23594592.7953917050691.20460829493088
24611601.9511520737339.04884792626725
25613584.2073732718928.7926267281105
2661157932
27594562.44884792626731.5511520737327
28595562.95115207373332.0488479262673
29591564.70230414746526.2976958525345
30589560.95115207373328.0488479262673
31584552.231.8
32573545.227.8
33567537.05345622119829.9465437788018
34569538.230.8
35621591.55115207373329.4488479262673
36629601.95115207373327.0488479262673
37628584.2073732718943.7926267281105
3861257933
39595562.44884792626732.5511520737327
40597562.95115207373334.0488479262673
41593565.94654377880227.0534562211982
42590560.95115207373329.0488479262673
43580552.227.8
44574545.228.8
45573538.29769585253534.7023041474654
46573538.234.8
47620591.55115207373328.4488479262673
48626601.95115207373324.0488479262673
49620584.2073732718935.7926267281105
505885799
51566562.4488479262673.55115207373273
52557562.951152073733-5.95115207373274
53561565.946543778802-4.94654377880181
54549562.195391705069-13.1953917050691
55532552.2-20.2
56526545.2-19.2
57511538.297695852535-27.2976958525345
58499538.2-39.2
59555591.551152073733-36.5511520737327
60565603.195391705069-38.1953917050691
61542584.20737327189-42.2073732718895

\begin{tabular}{lllllllll}
\hline
Multiple Linear Regression - Actuals, Interpolation, and Residuals \tabularnewline
Time or Index & Actuals & InterpolationForecast & ResidualsPrediction Error \tabularnewline
1 & 523 & 582.963133640553 & -59.9631336405528 \tabularnewline
2 & 519 & 579 & -59.9999999999999 \tabularnewline
3 & 509 & 562.448847926267 & -53.4488479262673 \tabularnewline
4 & 512 & 564.195391705069 & -52.1953917050690 \tabularnewline
5 & 519 & 564.702304147465 & -45.7023041474655 \tabularnewline
6 & 517 & 560.951152073733 & -43.9511520737328 \tabularnewline
7 & 510 & 552.2 & -42.2 \tabularnewline
8 & 509 & 545.2 & -36.2 \tabularnewline
9 & 501 & 537.053456221198 & -36.0534562211981 \tabularnewline
10 & 507 & 538.2 & -31.2000000000000 \tabularnewline
11 & 569 & 591.551152073733 & -22.5511520737328 \tabularnewline
12 & 580 & 601.951152073733 & -21.9511520737327 \tabularnewline
13 & 578 & 584.20737327189 & -6.20737327188945 \tabularnewline
14 & 565 & 579 & -14 \tabularnewline
15 & 547 & 561.204608294931 & -14.2046082949309 \tabularnewline
16 & 555 & 562.951152073733 & -7.95115207373274 \tabularnewline
17 & 562 & 564.702304147465 & -2.70230414746545 \tabularnewline
18 & 561 & 560.951152073733 & 0.0488479262672605 \tabularnewline
19 & 555 & 552.2 & 2.80000000000001 \tabularnewline
20 & 544 & 545.2 & -1.19999999999999 \tabularnewline
21 & 537 & 538.297695852535 & -1.29769585253455 \tabularnewline
22 & 543 & 538.2 & 4.80000000000003 \tabularnewline
23 & 594 & 592.795391705069 & 1.20460829493088 \tabularnewline
24 & 611 & 601.951152073733 & 9.04884792626725 \tabularnewline
25 & 613 & 584.20737327189 & 28.7926267281105 \tabularnewline
26 & 611 & 579 & 32 \tabularnewline
27 & 594 & 562.448847926267 & 31.5511520737327 \tabularnewline
28 & 595 & 562.951152073733 & 32.0488479262673 \tabularnewline
29 & 591 & 564.702304147465 & 26.2976958525345 \tabularnewline
30 & 589 & 560.951152073733 & 28.0488479262673 \tabularnewline
31 & 584 & 552.2 & 31.8 \tabularnewline
32 & 573 & 545.2 & 27.8 \tabularnewline
33 & 567 & 537.053456221198 & 29.9465437788018 \tabularnewline
34 & 569 & 538.2 & 30.8 \tabularnewline
35 & 621 & 591.551152073733 & 29.4488479262673 \tabularnewline
36 & 629 & 601.951152073733 & 27.0488479262673 \tabularnewline
37 & 628 & 584.20737327189 & 43.7926267281105 \tabularnewline
38 & 612 & 579 & 33 \tabularnewline
39 & 595 & 562.448847926267 & 32.5511520737327 \tabularnewline
40 & 597 & 562.951152073733 & 34.0488479262673 \tabularnewline
41 & 593 & 565.946543778802 & 27.0534562211982 \tabularnewline
42 & 590 & 560.951152073733 & 29.0488479262673 \tabularnewline
43 & 580 & 552.2 & 27.8 \tabularnewline
44 & 574 & 545.2 & 28.8 \tabularnewline
45 & 573 & 538.297695852535 & 34.7023041474654 \tabularnewline
46 & 573 & 538.2 & 34.8 \tabularnewline
47 & 620 & 591.551152073733 & 28.4488479262673 \tabularnewline
48 & 626 & 601.951152073733 & 24.0488479262673 \tabularnewline
49 & 620 & 584.20737327189 & 35.7926267281105 \tabularnewline
50 & 588 & 579 & 9 \tabularnewline
51 & 566 & 562.448847926267 & 3.55115207373273 \tabularnewline
52 & 557 & 562.951152073733 & -5.95115207373274 \tabularnewline
53 & 561 & 565.946543778802 & -4.94654377880181 \tabularnewline
54 & 549 & 562.195391705069 & -13.1953917050691 \tabularnewline
55 & 532 & 552.2 & -20.2 \tabularnewline
56 & 526 & 545.2 & -19.2 \tabularnewline
57 & 511 & 538.297695852535 & -27.2976958525345 \tabularnewline
58 & 499 & 538.2 & -39.2 \tabularnewline
59 & 555 & 591.551152073733 & -36.5511520737327 \tabularnewline
60 & 565 & 603.195391705069 & -38.1953917050691 \tabularnewline
61 & 542 & 584.20737327189 & -42.2073732718895 \tabularnewline
\hline
\end{tabular}
%Source: https://freestatistics.org/blog/index.php?pk=5899&T=4

[TABLE]
[ROW][C]Multiple Linear Regression - Actuals, Interpolation, and Residuals[/C][/ROW]
[ROW][C]Time or Index[/C][C]Actuals[/C][C]InterpolationForecast[/C][C]ResidualsPrediction Error[/C][/ROW]
[ROW][C]1[/C][C]523[/C][C]582.963133640553[/C][C]-59.9631336405528[/C][/ROW]
[ROW][C]2[/C][C]519[/C][C]579[/C][C]-59.9999999999999[/C][/ROW]
[ROW][C]3[/C][C]509[/C][C]562.448847926267[/C][C]-53.4488479262673[/C][/ROW]
[ROW][C]4[/C][C]512[/C][C]564.195391705069[/C][C]-52.1953917050690[/C][/ROW]
[ROW][C]5[/C][C]519[/C][C]564.702304147465[/C][C]-45.7023041474655[/C][/ROW]
[ROW][C]6[/C][C]517[/C][C]560.951152073733[/C][C]-43.9511520737328[/C][/ROW]
[ROW][C]7[/C][C]510[/C][C]552.2[/C][C]-42.2[/C][/ROW]
[ROW][C]8[/C][C]509[/C][C]545.2[/C][C]-36.2[/C][/ROW]
[ROW][C]9[/C][C]501[/C][C]537.053456221198[/C][C]-36.0534562211981[/C][/ROW]
[ROW][C]10[/C][C]507[/C][C]538.2[/C][C]-31.2000000000000[/C][/ROW]
[ROW][C]11[/C][C]569[/C][C]591.551152073733[/C][C]-22.5511520737328[/C][/ROW]
[ROW][C]12[/C][C]580[/C][C]601.951152073733[/C][C]-21.9511520737327[/C][/ROW]
[ROW][C]13[/C][C]578[/C][C]584.20737327189[/C][C]-6.20737327188945[/C][/ROW]
[ROW][C]14[/C][C]565[/C][C]579[/C][C]-14[/C][/ROW]
[ROW][C]15[/C][C]547[/C][C]561.204608294931[/C][C]-14.2046082949309[/C][/ROW]
[ROW][C]16[/C][C]555[/C][C]562.951152073733[/C][C]-7.95115207373274[/C][/ROW]
[ROW][C]17[/C][C]562[/C][C]564.702304147465[/C][C]-2.70230414746545[/C][/ROW]
[ROW][C]18[/C][C]561[/C][C]560.951152073733[/C][C]0.0488479262672605[/C][/ROW]
[ROW][C]19[/C][C]555[/C][C]552.2[/C][C]2.80000000000001[/C][/ROW]
[ROW][C]20[/C][C]544[/C][C]545.2[/C][C]-1.19999999999999[/C][/ROW]
[ROW][C]21[/C][C]537[/C][C]538.297695852535[/C][C]-1.29769585253455[/C][/ROW]
[ROW][C]22[/C][C]543[/C][C]538.2[/C][C]4.80000000000003[/C][/ROW]
[ROW][C]23[/C][C]594[/C][C]592.795391705069[/C][C]1.20460829493088[/C][/ROW]
[ROW][C]24[/C][C]611[/C][C]601.951152073733[/C][C]9.04884792626725[/C][/ROW]
[ROW][C]25[/C][C]613[/C][C]584.20737327189[/C][C]28.7926267281105[/C][/ROW]
[ROW][C]26[/C][C]611[/C][C]579[/C][C]32[/C][/ROW]
[ROW][C]27[/C][C]594[/C][C]562.448847926267[/C][C]31.5511520737327[/C][/ROW]
[ROW][C]28[/C][C]595[/C][C]562.951152073733[/C][C]32.0488479262673[/C][/ROW]
[ROW][C]29[/C][C]591[/C][C]564.702304147465[/C][C]26.2976958525345[/C][/ROW]
[ROW][C]30[/C][C]589[/C][C]560.951152073733[/C][C]28.0488479262673[/C][/ROW]
[ROW][C]31[/C][C]584[/C][C]552.2[/C][C]31.8[/C][/ROW]
[ROW][C]32[/C][C]573[/C][C]545.2[/C][C]27.8[/C][/ROW]
[ROW][C]33[/C][C]567[/C][C]537.053456221198[/C][C]29.9465437788018[/C][/ROW]
[ROW][C]34[/C][C]569[/C][C]538.2[/C][C]30.8[/C][/ROW]
[ROW][C]35[/C][C]621[/C][C]591.551152073733[/C][C]29.4488479262673[/C][/ROW]
[ROW][C]36[/C][C]629[/C][C]601.951152073733[/C][C]27.0488479262673[/C][/ROW]
[ROW][C]37[/C][C]628[/C][C]584.20737327189[/C][C]43.7926267281105[/C][/ROW]
[ROW][C]38[/C][C]612[/C][C]579[/C][C]33[/C][/ROW]
[ROW][C]39[/C][C]595[/C][C]562.448847926267[/C][C]32.5511520737327[/C][/ROW]
[ROW][C]40[/C][C]597[/C][C]562.951152073733[/C][C]34.0488479262673[/C][/ROW]
[ROW][C]41[/C][C]593[/C][C]565.946543778802[/C][C]27.0534562211982[/C][/ROW]
[ROW][C]42[/C][C]590[/C][C]560.951152073733[/C][C]29.0488479262673[/C][/ROW]
[ROW][C]43[/C][C]580[/C][C]552.2[/C][C]27.8[/C][/ROW]
[ROW][C]44[/C][C]574[/C][C]545.2[/C][C]28.8[/C][/ROW]
[ROW][C]45[/C][C]573[/C][C]538.297695852535[/C][C]34.7023041474654[/C][/ROW]
[ROW][C]46[/C][C]573[/C][C]538.2[/C][C]34.8[/C][/ROW]
[ROW][C]47[/C][C]620[/C][C]591.551152073733[/C][C]28.4488479262673[/C][/ROW]
[ROW][C]48[/C][C]626[/C][C]601.951152073733[/C][C]24.0488479262673[/C][/ROW]
[ROW][C]49[/C][C]620[/C][C]584.20737327189[/C][C]35.7926267281105[/C][/ROW]
[ROW][C]50[/C][C]588[/C][C]579[/C][C]9[/C][/ROW]
[ROW][C]51[/C][C]566[/C][C]562.448847926267[/C][C]3.55115207373273[/C][/ROW]
[ROW][C]52[/C][C]557[/C][C]562.951152073733[/C][C]-5.95115207373274[/C][/ROW]
[ROW][C]53[/C][C]561[/C][C]565.946543778802[/C][C]-4.94654377880181[/C][/ROW]
[ROW][C]54[/C][C]549[/C][C]562.195391705069[/C][C]-13.1953917050691[/C][/ROW]
[ROW][C]55[/C][C]532[/C][C]552.2[/C][C]-20.2[/C][/ROW]
[ROW][C]56[/C][C]526[/C][C]545.2[/C][C]-19.2[/C][/ROW]
[ROW][C]57[/C][C]511[/C][C]538.297695852535[/C][C]-27.2976958525345[/C][/ROW]
[ROW][C]58[/C][C]499[/C][C]538.2[/C][C]-39.2[/C][/ROW]
[ROW][C]59[/C][C]555[/C][C]591.551152073733[/C][C]-36.5511520737327[/C][/ROW]
[ROW][C]60[/C][C]565[/C][C]603.195391705069[/C][C]-38.1953917050691[/C][/ROW]
[ROW][C]61[/C][C]542[/C][C]584.20737327189[/C][C]-42.2073732718895[/C][/ROW]
[/TABLE]
Source: https://freestatistics.org/blog/index.php?pk=5899&T=4

Globally Unique Identifier (entire table): ba.freestatistics.org/blog/index.php?pk=5899&T=4

As an alternative you can also use a QR Code:  

The GUIDs for individual cells are displayed in the table below:

Multiple Linear Regression - Actuals, Interpolation, and Residuals
Time or IndexActualsInterpolationForecastResidualsPrediction Error
1523582.963133640553-59.9631336405528
2519579-59.9999999999999
3509562.448847926267-53.4488479262673
4512564.195391705069-52.1953917050690
5519564.702304147465-45.7023041474655
6517560.951152073733-43.9511520737328
7510552.2-42.2
8509545.2-36.2
9501537.053456221198-36.0534562211981
10507538.2-31.2000000000000
11569591.551152073733-22.5511520737328
12580601.951152073733-21.9511520737327
13578584.20737327189-6.20737327188945
14565579-14
15547561.204608294931-14.2046082949309
16555562.951152073733-7.95115207373274
17562564.702304147465-2.70230414746545
18561560.9511520737330.0488479262672605
19555552.22.80000000000001
20544545.2-1.19999999999999
21537538.297695852535-1.29769585253455
22543538.24.80000000000003
23594592.7953917050691.20460829493088
24611601.9511520737339.04884792626725
25613584.2073732718928.7926267281105
2661157932
27594562.44884792626731.5511520737327
28595562.95115207373332.0488479262673
29591564.70230414746526.2976958525345
30589560.95115207373328.0488479262673
31584552.231.8
32573545.227.8
33567537.05345622119829.9465437788018
34569538.230.8
35621591.55115207373329.4488479262673
36629601.95115207373327.0488479262673
37628584.2073732718943.7926267281105
3861257933
39595562.44884792626732.5511520737327
40597562.95115207373334.0488479262673
41593565.94654377880227.0534562211982
42590560.95115207373329.0488479262673
43580552.227.8
44574545.228.8
45573538.29769585253534.7023041474654
46573538.234.8
47620591.55115207373328.4488479262673
48626601.95115207373324.0488479262673
49620584.2073732718935.7926267281105
505885799
51566562.4488479262673.55115207373273
52557562.951152073733-5.95115207373274
53561565.946543778802-4.94654377880181
54549562.195391705069-13.1953917050691
55532552.2-20.2
56526545.2-19.2
57511538.297695852535-27.2976958525345
58499538.2-39.2
59555591.551152073733-36.5511520737327
60565603.195391705069-38.1953917050691
61542584.20737327189-42.2073732718895


Parameters (Session):
par1 = 1 ; par2 = Include Monthly Dummies ; par3 = No Linear Trend ;
Parameters (R input):
par1 = 1 ; par2 = Include Monthly Dummies ; par3 = No Linear Trend ;
R code (references can be found in the software module):
library(lattice)
par1 <- as.numeric(par1)
x <- t(y)
k <- length(x[1,])
n <- length(x[,1])
x1 <- cbind(x[,par1], x[,1:k!=par1])
mycolnames <- c(colnames(x)[par1], colnames(x)[1:k!=par1])
colnames(x1) <- mycolnames #colnames(x)[par1]
x <- x1
if (par3 == 'First Differences'){
x2 <- array(0, dim=c(n-1,k), dimnames=list(1:(n-1), paste('(1-B)',colnames(x),sep='')))
for (i in 1:n-1) {
for (j in 1:k) {
x2[i,j] <- x[i+1,j] - x[i,j]
}
}
x <- x2
}
if (par2 == 'Include Monthly Dummies'){
x2 <- array(0, dim=c(n,11), dimnames=list(1:n, paste('M', seq(1:11), sep ='')))
for (i in 1:11){
x2[seq(i,n,12),i] <- 1
}
x <- cbind(x, x2)
}
if (par2 == 'Include Quarterly Dummies'){
x2 <- array(0, dim=c(n,3), dimnames=list(1:n, paste('Q', seq(1:3), sep ='')))
for (i in 1:3){
x2[seq(i,n,4),i] <- 1
}
x <- cbind(x, x2)
}
k <- length(x[1,])
if (par3 == 'Linear Trend'){
x <- cbind(x, c(1:n))
colnames(x)[k+1] <- 't'
}
x
k <- length(x[1,])
df <- as.data.frame(x)
(mylm <- lm(df))
(mysum <- summary(mylm))
bitmap(file='test0.png')
plot(x[,1], type='l', main='Actuals and Interpolation', ylab='value of Actuals and Interpolation (dots)', xlab='time or index')
points(x[,1]-mysum$resid)
grid()
dev.off()
bitmap(file='test1.png')
plot(mysum$resid, type='b', pch=19, main='Residuals', ylab='value of Residuals', xlab='time or index')
grid()
dev.off()
bitmap(file='test2.png')
hist(mysum$resid, main='Residual Histogram', xlab='values of Residuals')
grid()
dev.off()
bitmap(file='test3.png')
densityplot(~mysum$resid,col='black',main='Residual Density Plot', xlab='values of Residuals')
dev.off()
bitmap(file='test4.png')
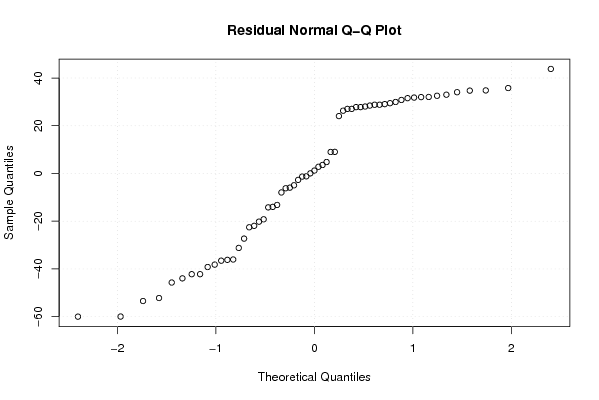
qqnorm(mysum$resid, main='Residual Normal Q-Q Plot')
grid()
dev.off()
(myerror <- as.ts(mysum$resid))
bitmap(file='test5.png')
dum <- cbind(lag(myerror,k=1),myerror)
dum
dum1 <- dum[2:length(myerror),]
dum1
z <- as.data.frame(dum1)
z
plot(z,main=paste('Residual Lag plot, lowess, and regression line'), ylab='values of Residuals', xlab='lagged values of Residuals')
lines(lowess(z))
abline(lm(z))
grid()
dev.off()
bitmap(file='test6.png')
acf(mysum$resid, lag.max=length(mysum$resid)/2, main='Residual Autocorrelation Function')
grid()
dev.off()
bitmap(file='test7.png')
pacf(mysum$resid, lag.max=length(mysum$resid)/2, main='Residual Partial Autocorrelation Function')
grid()
dev.off()
bitmap(file='test8.png')
opar <- par(mfrow = c(2,2), oma = c(0, 0, 1.1, 0))
plot(mylm, las = 1, sub='Residual Diagnostics')
par(opar)
dev.off()
load(file='createtable')
a<-table.start()
a<-table.row.start(a)
a<-table.element(a, 'Multiple Linear Regression - Estimated Regression Equation', 1, TRUE)
a<-table.row.end(a)
myeq <- colnames(x)[1]
myeq <- paste(myeq, '[t] = ', sep='')
for (i in 1:k){
if (mysum$coefficients[i,1] > 0) myeq <- paste(myeq, '+', '')
myeq <- paste(myeq, mysum$coefficients[i,1], sep=' ')
if (rownames(mysum$coefficients)[i] != '(Intercept)') {
myeq <- paste(myeq, rownames(mysum$coefficients)[i], sep='')
if (rownames(mysum$coefficients)[i] != 't') myeq <- paste(myeq, '[t]', sep='')
}
}
myeq <- paste(myeq, ' + e[t]')
a<-table.row.start(a)
a<-table.element(a, myeq)
a<-table.row.end(a)
a<-table.end(a)
table.save(a,file='mytable1.tab')
a<-table.start()
a<-table.row.start(a)
a<-table.element(a,hyperlink('ols1.htm','Multiple Linear Regression - Ordinary Least Squares',''), 6, TRUE)
a<-table.row.end(a)
a<-table.row.start(a)
a<-table.element(a,'Variable',header=TRUE)
a<-table.element(a,'Parameter',header=TRUE)
a<-table.element(a,'S.D.',header=TRUE)
a<-table.element(a,'T-STAT
H0: parameter = 0',header=TRUE)
a<-table.element(a,'2-tail p-value',header=TRUE)
a<-table.element(a,'1-tail p-value',header=TRUE)
a<-table.row.end(a)
for (i in 1:k){
a<-table.row.start(a)
a<-table.element(a,rownames(mysum$coefficients)[i],header=TRUE)
a<-table.element(a,mysum$coefficients[i,1])
a<-table.element(a, round(mysum$coefficients[i,2],6))
a<-table.element(a, round(mysum$coefficients[i,3],4))
a<-table.element(a, round(mysum$coefficients[i,4],6))
a<-table.element(a, round(mysum$coefficients[i,4]/2,6))
a<-table.row.end(a)
}
a<-table.end(a)
table.save(a,file='mytable2.tab')
a<-table.start()
a<-table.row.start(a)
a<-table.element(a, 'Multiple Linear Regression - Regression Statistics', 2, TRUE)
a<-table.row.end(a)
a<-table.row.start(a)
a<-table.element(a, 'Multiple R',1,TRUE)
a<-table.element(a, sqrt(mysum$r.squared))
a<-table.row.end(a)
a<-table.row.start(a)
a<-table.element(a, 'R-squared',1,TRUE)
a<-table.element(a, mysum$r.squared)
a<-table.row.end(a)
a<-table.row.start(a)
a<-table.element(a, 'Adjusted R-squared',1,TRUE)
a<-table.element(a, mysum$adj.r.squared)
a<-table.row.end(a)
a<-table.row.start(a)
a<-table.element(a, 'F-TEST (value)',1,TRUE)
a<-table.element(a, mysum$fstatistic[1])
a<-table.row.end(a)
a<-table.row.start(a)
a<-table.element(a, 'F-TEST (DF numerator)',1,TRUE)
a<-table.element(a, mysum$fstatistic[2])
a<-table.row.end(a)
a<-table.row.start(a)
a<-table.element(a, 'F-TEST (DF denominator)',1,TRUE)
a<-table.element(a, mysum$fstatistic[3])
a<-table.row.end(a)
a<-table.row.start(a)
a<-table.element(a, 'p-value',1,TRUE)
a<-table.element(a, 1-pf(mysum$fstatistic[1],mysum$fstatistic[2],mysum$fstatistic[3]))
a<-table.row.end(a)
a<-table.row.start(a)
a<-table.element(a, 'Multiple Linear Regression - Residual Statistics', 2, TRUE)
a<-table.row.end(a)
a<-table.row.start(a)
a<-table.element(a, 'Residual Standard Deviation',1,TRUE)
a<-table.element(a, mysum$sigma)
a<-table.row.end(a)
a<-table.row.start(a)
a<-table.element(a, 'Sum Squared Residuals',1,TRUE)
a<-table.element(a, sum(myerror*myerror))
a<-table.row.end(a)
a<-table.end(a)
table.save(a,file='mytable3.tab')
a<-table.start()
a<-table.row.start(a)
a<-table.element(a, 'Multiple Linear Regression - Actuals, Interpolation, and Residuals', 4, TRUE)
a<-table.row.end(a)
a<-table.row.start(a)
a<-table.element(a, 'Time or Index', 1, TRUE)
a<-table.element(a, 'Actuals', 1, TRUE)
a<-table.element(a, 'Interpolation
Forecast', 1, TRUE)
a<-table.element(a, 'Residuals
Prediction Error', 1, TRUE)
a<-table.row.end(a)
for (i in 1:n) {
a<-table.row.start(a)
a<-table.element(a,i, 1, TRUE)
a<-table.element(a,x[i])
a<-table.element(a,x[i]-mysum$resid[i])
a<-table.element(a,mysum$resid[i])
a<-table.row.end(a)
}
a<-table.end(a)
table.save(a,file='mytable4.tab')