| Multiple Linear Regression - Estimated Regression Equation |
| Werklh[t] = + 618.793991160117 -10.1901969858548LisStrat[t] -55.9757379424133`9/11`[t] -3.51547013018365M1[t] -7.80296451303514M2[t] -25.2616139157730M3[t] -24.2519628161533M4[t] -30.9049347069358M5[t] -34.2286169406494M6[t] -42.3856325076963M7[t] -49.5426480747433M8[t] -56.5329969751236M9[t] -55.8566792088372M10[t] -0.847028109217495M11[t] -0.176317766286378t + e[t] |
| Multiple Linear Regression - Ordinary Least Squares | |||||
| Variable | Parameter | S.D. | T-STAT H0: parameter = 0 | 2-tail p-value | 1-tail p-value |
| (Intercept) | 618.793991160117 | 20.834462 | 29.7005 | 0 | 0 |
| LisStrat | -10.1901969858548 | 12.609701 | -0.8081 | 0.422322 | 0.211161 |
| `9/11` | -55.9757379424133 | 8.851151 | -6.3241 | 0 | 0 |
| M1 | -3.51547013018365 | 12.34479 | -0.2848 | 0.776832 | 0.388416 |
| M2 | -7.80296451303514 | 12.842065 | -0.6076 | 0.545818 | 0.272909 |
| M3 | -25.2616139157730 | 12.944365 | -1.9516 | 0.055826 | 0.027913 |
| M4 | -24.2519628161533 | 12.896758 | -1.8805 | 0.065068 | 0.032534 |
| M5 | -30.9049347069358 | 12.943757 | -2.3876 | 0.020236 | 0.010118 |
| M6 | -34.2286169406494 | 12.882318 | -2.657 | 0.010167 | 0.005083 |
| M7 | -42.3856325076963 | 12.837414 | -3.3017 | 0.001648 | 0.000824 |
| M8 | -49.5426480747433 | 12.80922 | -3.8677 | 0.00028 | 0.00014 |
| M9 | -56.5329969751236 | 12.797847 | -4.4174 | 4.4e-05 | 2.2e-05 |
| M10 | -55.8566792088372 | 12.80334 | -4.3627 | 5.3e-05 | 2.7e-05 |
| M11 | -0.847028109217495 | 12.825676 | -0.066 | 0.947572 | 0.473786 |
| t | -0.176317766286378 | 0.464671 | -0.3794 | 0.705742 | 0.352871 |
| Multiple Linear Regression - Regression Statistics | |
| Multiple R | 0.903750956405106 |
| R-squared | 0.816765791203144 |
| Adjusted R-squared | 0.772536844252179 |
| F-TEST (value) | 18.4667700116997 |
| F-TEST (DF numerator) | 14 |
| F-TEST (DF denominator) | 58 |
| p-value | 2.22044604925031e-16 |
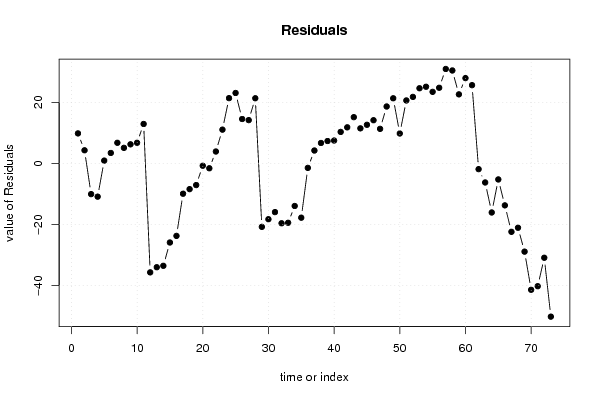
| Multiple Linear Regression - Residual Statistics | |
| Residual Standard Deviation | 22.1354498812648 |
| Sum Squared Residuals | 28418.7322038673 |