Free Statistics

of Irreproducible Research!

Author's title

Author*Unverified author*
R Software Modulerwasp_multipleregression.wasp
Title produced by softwareMultiple Regression
Date of computationMon, 19 Nov 2007 04:02:03 -0700
Cite this page as followsStatistical Computations at FreeStatistics.org, Office for Research Development and Education, URL https://freestatistics.org/blog/index.php?v=date/2007/Nov/19/t1195469764kyyoc54ndfxzbl3.htm/, Retrieved Fri, 03 May 2024 11:23:52 +0000
Statistical Computations at FreeStatistics.org, Office for Research Development and Education, URL https://freestatistics.org/blog/index.php?pk=5699, Retrieved Fri, 03 May 2024 11:23:52 +0000
QR Codes:

Original text written by user:
IsPrivate?No (this computation is public)
User-defined keywords
Estimated Impact177
Family? (F = Feedback message, R = changed R code, M = changed R Module, P = changed Parameters, D = changed Data)
-       [Multiple Regression] [] [2007-11-19 11:02:03] [079615521100262cd8b5675a0217a3b1] [Current]
Feedback Forum

Post a new message
Dataseries X:
106.54	107.89	1
106.44	107.26	1
106.57	107.76	1
106.12	107.32	1
106.13	107.15	1
106.26	108.04	1
105.78	106.52	1
105.77	106.62	0
105.2	106.47	0
105.15	105.46	0
105.01	106.13	0
104.75	105.15	0
104.96	105.39	0
105.26	104.57	0
105.13	104.29	0
104.77	104.09	0
104.79	104.51	0
104.4	103.39	0
103.89	102.71	0
103.93	102.62	0
103.48	101.94	0
103.45	101.65	0
103.47	101.86	0
103.5	101.27	0
103.69	101.21	0
103.57	102.15	0
103.47	102.07	0
102.85	102.8	0
102.54	103.39	0
102.39	102.71	0
102.16	102.65	0
101.51	101.12	0
100.83	100.29	0
100.55	99.79	0
100.88	100.11	0
101	99.76	0
100.51	99.96	0
100.44	99.98	0
100.32	100.49	0
99.98	100.75	0
100.03	100.84	0
99.64	100.44	0
99.11	99.57	0
98.97	99.22	0
98.6	99.08	0
98.31	98.04	0
98.37	98.73	0
98.19	98.72	0
98.51	100.07	0
98.23	99.02	0
97.96	98.94	0
97.77	99	0
97.49	98.54	0
97.76	98.42	0
98.01	97.9	0
97.73	97.46	0
97.06	97	0
96.63	95.97	0
96.58	96.55	0
96.66	96.51	0
96.77	96.76	0
96.5	96.05	0
96.53	96.47	0
96.22	96.38	0
96.49	97.27	0
96.34	96.67	0
96.31	96.59	0
96.06	96.06	0
95.9	96.92	0
95.33	94.96	0
95.53	95.59	0
95.42	95.68	0
95.57	95.35	0
95.3	95.41	0
95.31	95.32	0
95.38	95.8	0
95.22	95.46	0
94.62	94.16	0
93.81	92.49	0
93.6	91.58	0
93.2	91.5	0
93.29	90.83	0
93.54	91.28	0
93.23	90.57	0
93.46	90.93	0
92.82	90.9	0
92.85	91.49	0
92.67	91.38	0
92.32	90.91	0
92.06	90.72	0
91.88	89.53	0
91.53	89.47	0
91.19	89.28	0


Summary of compuational transaction
Raw Inputview raw input (R code)
Raw Outputview raw output of R engine
Computing time3 seconds
R Server'Gwilym Jenkins' @ 72.249.127.135

\begin{tabular}{lllllllll}
\hline
Summary of compuational transaction \tabularnewline
Raw Input & view raw input (R code)  \tabularnewline
Raw Output & view raw output of R engine  \tabularnewline
Computing time & 3 seconds \tabularnewline
R Server & 'Gwilym Jenkins' @ 72.249.127.135 \tabularnewline
\hline
\end{tabular}
%Source: https://freestatistics.org/blog/index.php?pk=5699&T=0

[TABLE]
[ROW][C]Summary of compuational transaction[/C][/ROW]
[ROW][C]Raw Input[/C][C]view raw input (R code) [/C][/ROW]
[ROW][C]Raw Output[/C][C]view raw output of R engine [/C][/ROW]
[ROW][C]Computing time[/C][C]3 seconds[/C][/ROW]
[ROW][C]R Server[/C][C]'Gwilym Jenkins' @ 72.249.127.135[/C][/ROW]
[/TABLE]
Source: https://freestatistics.org/blog/index.php?pk=5699&T=0

Globally Unique Identifier (entire table): ba.freestatistics.org/blog/index.php?pk=5699&T=0

As an alternative you can also use a QR Code:  

The GUIDs for individual cells are displayed in the table below:

Summary of compuational transaction
Raw Inputview raw input (R code)
Raw Outputview raw output of R engine
Computing time3 seconds
R Server'Gwilym Jenkins' @ 72.249.127.135


Multiple Linear Regression - Estimated Regression Equation
Y[t] = -7.25303327622183 + 1.06594187359589X[t] + 0.89571223355923D[t] + 0.240549460095881M1[t] + 0.156251424685183M2[t] + 0.398463373048969M3[t] + 0.801831080443743M4[t] + 0.97051313109336M5[t] + 0.735706941760564M6[t] + 0.247728631943272M7[t] + 0.129941719407226M8[t] + 0.406195271893356M9[t] -0.131051760722312M10[t] + 0.274065231376367M11[t] + e[t]

\begin{tabular}{lllllllll}
\hline
Multiple Linear Regression - Estimated Regression Equation \tabularnewline
Y[t] =  -7.25303327622183 +  1.06594187359589X[t] +  0.89571223355923D[t] +  0.240549460095881M1[t] +  0.156251424685183M2[t] +  0.398463373048969M3[t] +  0.801831080443743M4[t] +  0.97051313109336M5[t] +  0.735706941760564M6[t] +  0.247728631943272M7[t] +  0.129941719407226M8[t] +  0.406195271893356M9[t] -0.131051760722312M10[t] +  0.274065231376367M11[t]  + e[t] \tabularnewline
\hline
\end{tabular}
%Source: https://freestatistics.org/blog/index.php?pk=5699&T=1

[TABLE]
[ROW][C]Multiple Linear Regression - Estimated Regression Equation[/C][/ROW]
[ROW][C]Y[t] =  -7.25303327622183 +  1.06594187359589X[t] +  0.89571223355923D[t] +  0.240549460095881M1[t] +  0.156251424685183M2[t] +  0.398463373048969M3[t] +  0.801831080443743M4[t] +  0.97051313109336M5[t] +  0.735706941760564M6[t] +  0.247728631943272M7[t] +  0.129941719407226M8[t] +  0.406195271893356M9[t] -0.131051760722312M10[t] +  0.274065231376367M11[t]  + e[t][/C][/ROW]
[/TABLE]
Source: https://freestatistics.org/blog/index.php?pk=5699&T=1

Globally Unique Identifier (entire table): ba.freestatistics.org/blog/index.php?pk=5699&T=1

As an alternative you can also use a QR Code:  

The GUIDs for individual cells are displayed in the table below:

Multiple Linear Regression - Estimated Regression Equation
Y[t] = -7.25303327622183 + 1.06594187359589X[t] + 0.89571223355923D[t] + 0.240549460095881M1[t] + 0.156251424685183M2[t] + 0.398463373048969M3[t] + 0.801831080443743M4[t] + 0.97051313109336M5[t] + 0.735706941760564M6[t] + 0.247728631943272M7[t] + 0.129941719407226M8[t] + 0.406195271893356M9[t] -0.131051760722312M10[t] + 0.274065231376367M11[t] + e[t]


Multiple Linear Regression - Ordinary Least Squares
VariableParameterS.D.T-STATH0: parameter = 02-tail p-value1-tail p-value
(Intercept)-7.253033276221832.655996-2.73080.0077890.003894
X1.065941873595890.02655740.137300
D0.895712233559230.4580651.95540.0540690.027034
M10.2405494600958810.5269770.45650.6493040.324652
M20.1562514246851830.5269820.29650.7676240.383812
M30.3984633730489690.5269910.75610.4518320.225916
M40.8018310804437430.5271161.52120.132210.066105
M50.970513131093360.5271791.8410.0693820.034691
M60.7357069417605640.5273471.39510.1668920.083446
M70.2477286319432720.5277280.46940.6400590.320029
M80.1299417194072260.5245540.24770.8049950.402497
M90.4061952718933560.5248930.77390.4413210.220661
M10-0.1310517607223120.541683-0.24190.8094580.404729
M110.2740652313763670.5416880.50590.6143030.307151

\begin{tabular}{lllllllll}
\hline
Multiple Linear Regression - Ordinary Least Squares \tabularnewline
Variable & Parameter & S.D. & T-STATH0: parameter = 0 & 2-tail p-value & 1-tail p-value \tabularnewline
(Intercept) & -7.25303327622183 & 2.655996 & -2.7308 & 0.007789 & 0.003894 \tabularnewline
X & 1.06594187359589 & 0.026557 & 40.1373 & 0 & 0 \tabularnewline
D & 0.89571223355923 & 0.458065 & 1.9554 & 0.054069 & 0.027034 \tabularnewline
M1 & 0.240549460095881 & 0.526977 & 0.4565 & 0.649304 & 0.324652 \tabularnewline
M2 & 0.156251424685183 & 0.526982 & 0.2965 & 0.767624 & 0.383812 \tabularnewline
M3 & 0.398463373048969 & 0.526991 & 0.7561 & 0.451832 & 0.225916 \tabularnewline
M4 & 0.801831080443743 & 0.527116 & 1.5212 & 0.13221 & 0.066105 \tabularnewline
M5 & 0.97051313109336 & 0.527179 & 1.841 & 0.069382 & 0.034691 \tabularnewline
M6 & 0.735706941760564 & 0.527347 & 1.3951 & 0.166892 & 0.083446 \tabularnewline
M7 & 0.247728631943272 & 0.527728 & 0.4694 & 0.640059 & 0.320029 \tabularnewline
M8 & 0.129941719407226 & 0.524554 & 0.2477 & 0.804995 & 0.402497 \tabularnewline
M9 & 0.406195271893356 & 0.524893 & 0.7739 & 0.441321 & 0.220661 \tabularnewline
M10 & -0.131051760722312 & 0.541683 & -0.2419 & 0.809458 & 0.404729 \tabularnewline
M11 & 0.274065231376367 & 0.541688 & 0.5059 & 0.614303 & 0.307151 \tabularnewline
\hline
\end{tabular}
%Source: https://freestatistics.org/blog/index.php?pk=5699&T=2

[TABLE]
[ROW][C]Multiple Linear Regression - Ordinary Least Squares[/C][/ROW]
[ROW][C]Variable[/C][C]Parameter[/C][C]S.D.[/C][C]T-STATH0: parameter = 0[/C][C]2-tail p-value[/C][C]1-tail p-value[/C][/ROW]
[ROW][C](Intercept)[/C][C]-7.25303327622183[/C][C]2.655996[/C][C]-2.7308[/C][C]0.007789[/C][C]0.003894[/C][/ROW]
[ROW][C]X[/C][C]1.06594187359589[/C][C]0.026557[/C][C]40.1373[/C][C]0[/C][C]0[/C][/ROW]
[ROW][C]D[/C][C]0.89571223355923[/C][C]0.458065[/C][C]1.9554[/C][C]0.054069[/C][C]0.027034[/C][/ROW]
[ROW][C]M1[/C][C]0.240549460095881[/C][C]0.526977[/C][C]0.4565[/C][C]0.649304[/C][C]0.324652[/C][/ROW]
[ROW][C]M2[/C][C]0.156251424685183[/C][C]0.526982[/C][C]0.2965[/C][C]0.767624[/C][C]0.383812[/C][/ROW]
[ROW][C]M3[/C][C]0.398463373048969[/C][C]0.526991[/C][C]0.7561[/C][C]0.451832[/C][C]0.225916[/C][/ROW]
[ROW][C]M4[/C][C]0.801831080443743[/C][C]0.527116[/C][C]1.5212[/C][C]0.13221[/C][C]0.066105[/C][/ROW]
[ROW][C]M5[/C][C]0.97051313109336[/C][C]0.527179[/C][C]1.841[/C][C]0.069382[/C][C]0.034691[/C][/ROW]
[ROW][C]M6[/C][C]0.735706941760564[/C][C]0.527347[/C][C]1.3951[/C][C]0.166892[/C][C]0.083446[/C][/ROW]
[ROW][C]M7[/C][C]0.247728631943272[/C][C]0.527728[/C][C]0.4694[/C][C]0.640059[/C][C]0.320029[/C][/ROW]
[ROW][C]M8[/C][C]0.129941719407226[/C][C]0.524554[/C][C]0.2477[/C][C]0.804995[/C][C]0.402497[/C][/ROW]
[ROW][C]M9[/C][C]0.406195271893356[/C][C]0.524893[/C][C]0.7739[/C][C]0.441321[/C][C]0.220661[/C][/ROW]
[ROW][C]M10[/C][C]-0.131051760722312[/C][C]0.541683[/C][C]-0.2419[/C][C]0.809458[/C][C]0.404729[/C][/ROW]
[ROW][C]M11[/C][C]0.274065231376367[/C][C]0.541688[/C][C]0.5059[/C][C]0.614303[/C][C]0.307151[/C][/ROW]
[/TABLE]
Source: https://freestatistics.org/blog/index.php?pk=5699&T=2

Globally Unique Identifier (entire table): ba.freestatistics.org/blog/index.php?pk=5699&T=2

As an alternative you can also use a QR Code:  

The GUIDs for individual cells are displayed in the table below:

Multiple Linear Regression - Ordinary Least Squares
VariableParameterS.D.T-STATH0: parameter = 02-tail p-value1-tail p-value
(Intercept)-7.253033276221832.655996-2.73080.0077890.003894
X1.065941873595890.02655740.137300
D0.895712233559230.4580651.95540.0540690.027034
M10.2405494600958810.5269770.45650.6493040.324652
M20.1562514246851830.5269820.29650.7676240.383812
M30.3984633730489690.5269910.75610.4518320.225916
M40.8018310804437430.5271161.52120.132210.066105
M50.970513131093360.5271791.8410.0693820.034691
M60.7357069417605640.5273471.39510.1668920.083446
M70.2477286319432720.5277280.46940.6400590.320029
M80.1299417194072260.5245540.24770.8049950.402497
M90.4061952718933560.5248930.77390.4413210.220661
M10-0.1310517607223120.541683-0.24190.8094580.404729
M110.2740652313763670.5416880.50590.6143030.307151


Multiple Linear Regression - Regression Statistics
Multiple R0.982169333137103
R-squared0.964656598954982
Adjusted R-squared0.958840596251372
F-TEST (value)165.862474299768
F-TEST (DF numerator)13
F-TEST (DF denominator)79
p-value0
Multiple Linear Regression - Residual Statistics
Residual Standard Deviation1.01339534505927
Sum Squared Residuals81.1306399056367

\begin{tabular}{lllllllll}
\hline
Multiple Linear Regression - Regression Statistics \tabularnewline
Multiple R & 0.982169333137103 \tabularnewline
R-squared & 0.964656598954982 \tabularnewline
Adjusted R-squared & 0.958840596251372 \tabularnewline
F-TEST (value) & 165.862474299768 \tabularnewline
F-TEST (DF numerator) & 13 \tabularnewline
F-TEST (DF denominator) & 79 \tabularnewline
p-value & 0 \tabularnewline
Multiple Linear Regression - Residual Statistics \tabularnewline
Residual Standard Deviation & 1.01339534505927 \tabularnewline
Sum Squared Residuals & 81.1306399056367 \tabularnewline
\hline
\end{tabular}
%Source: https://freestatistics.org/blog/index.php?pk=5699&T=3

[TABLE]
[ROW][C]Multiple Linear Regression - Regression Statistics[/C][/ROW]
[ROW][C]Multiple R[/C][C]0.982169333137103[/C][/ROW]
[ROW][C]R-squared[/C][C]0.964656598954982[/C][/ROW]
[ROW][C]Adjusted R-squared[/C][C]0.958840596251372[/C][/ROW]
[ROW][C]F-TEST (value)[/C][C]165.862474299768[/C][/ROW]
[ROW][C]F-TEST (DF numerator)[/C][C]13[/C][/ROW]
[ROW][C]F-TEST (DF denominator)[/C][C]79[/C][/ROW]
[ROW][C]p-value[/C][C]0[/C][/ROW]
[ROW][C]Multiple Linear Regression - Residual Statistics[/C][/ROW]
[ROW][C]Residual Standard Deviation[/C][C]1.01339534505927[/C][/ROW]
[ROW][C]Sum Squared Residuals[/C][C]81.1306399056367[/C][/ROW]
[/TABLE]
Source: https://freestatistics.org/blog/index.php?pk=5699&T=3

Globally Unique Identifier (entire table): ba.freestatistics.org/blog/index.php?pk=5699&T=3

As an alternative you can also use a QR Code:  

The GUIDs for individual cells are displayed in the table below:

Multiple Linear Regression - Regression Statistics
Multiple R0.982169333137103
R-squared0.964656598954982
Adjusted R-squared0.958840596251372
F-TEST (value)165.862474299768
F-TEST (DF numerator)13
F-TEST (DF denominator)79
p-value0
Multiple Linear Regression - Residual Statistics
Residual Standard Deviation1.01339534505927
Sum Squared Residuals81.1306399056367


Multiple Linear Regression - Actuals, Interpolation, and Residuals
Time or IndexActualsInterpolationForecastResidualsPrediction Error
1107.89107.4486756303400.441324369660214
2107.26107.2577834075690.00221659243087586
3107.76107.6385677995000.121432200499641
4107.32107.562261663777-0.242261663777006
5107.15107.741603133163-0.59160313316256
6108.04107.6453693873970.394630612602762
7106.52106.645738978254-0.125738978253926
8106.62105.6215804134230.998419586577325
9106.47105.2902470979591.17975290204084
10105.46104.6997029716640.760297028336293
11106.13104.9555881014591.17441189854104
12105.15104.4043779829480.745622017052356
13105.39104.8687752364990.521224763501339
14104.57105.104259763167-0.534259763166749
15104.29105.207899267963-0.917899267963046
16104.09105.227527900863-1.13752790086330
17104.51105.417528788985-0.907528788984849
18103.39104.767005268950-1.37700526894966
19102.71103.735396603598-1.02539660359846
20102.62103.660247366006-1.04024736600625
21101.94103.456827075374-1.51682707537423
22101.65102.887601786551-1.23760178655068
23101.86103.314037616121-1.45403761612128
24101.27103.071950640953-1.80195064095279
25101.21103.515029057032-2.30502905703189
26102.15103.302817996790-1.15281799678967
27102.07103.438435757794-1.36843575779389
28102.8103.180919503559-0.380919503559199
29103.39103.0191595733940.370840426605899
30102.71102.6244621030220.085537896978079
31102.65101.8913171622780.758682837722442
32101.12101.0806680319040.0393319680958057
33100.29100.632081110345-0.34208111034511
3499.7999.7963703531226-0.00637035312259156
35100.11100.553248163508-0.443248163507919
3699.76100.407095956963-0.647095956963058
3799.96100.125333898997-0.16533389899697
3899.9899.96641993243450.0135800675654582
39100.49100.0807188559670.409281144033175
40100.75100.1216663263390.628333673660997
41100.84100.3436454706680.496354529331591
42100.4499.69312195063320.74687804936678
4399.5798.640194447810.92980555218989
4499.2298.37317567297060.846824327029367
4599.0898.25503073222630.82496926777372
4698.0497.40866055626780.631339443732197
4798.7397.87773406078220.85226593921776
4898.7297.41179929215861.30820070784139
49100.0797.99345015180522.07654984819481
5099.0297.61068839178761.40931160821236
5198.9497.56509603428051.37490396571948
529997.7659347856921.23406521430792
5398.5497.63615311173480.90384688826516
5498.4297.6891512282730.730848771727053
5597.997.46765838685460.432341613145376
5697.4697.05140774971170.40859225028826
579796.61348024688860.386519753111384
5895.9795.61787820862670.352121791373291
5996.5595.96969810704560.580301892954402
6096.5195.7809082255570.729091774443107
6196.7696.13871129174830.62128870825168
6296.0595.76660895046670.283391049533255
6396.4796.04079915503840.429200844961594
6496.3896.11372488161850.266275118381544
6597.2796.5702112381390.69978876186104
6696.6796.17551376776680.494486232233218
6796.5995.65555720174160.93444279825839
6896.0695.27128482080660.788715179193406
6996.9295.37698767351741.54301232648261
7094.9694.2321537729520.72784622704794
7195.5994.8504591397700.73954086023009
7295.6894.4591403022981.22085969770201
7395.3594.85958104343330.49041895656674
7495.4194.48747870215170.922521297848325
7595.3294.74035006925140.579649930748572
7695.895.21833370779790.581666292202097
7795.4695.21646505867220.243534941327815
7894.1694.3420937451819-0.182093745181858
7992.4992.9907025177519-0.500702517751894
8091.5892.6490678117607-1.0690678117607
8191.592.4989446148085-0.99894461480848
8290.8392.0576323508164-1.22763235081645
8391.2892.7292348113141-1.44923481131410
8490.5792.124727599123-1.55472759912301
8590.9392.6104436901459-1.68044369014592
8690.991.8439428556339-0.943942855633854
8791.4992.1181330602055-0.628133060205528
8891.3892.329631230353-0.94963123035305
8990.9192.125233625244-1.21523362524409
9090.7291.6132825487764-0.893282548776376
9189.5390.9334347017118-1.40343470171181
9289.4790.4425681334172-0.972568133417214
9389.2890.3564014488807-1.07640144888073

\begin{tabular}{lllllllll}
\hline
Multiple Linear Regression - Actuals, Interpolation, and Residuals \tabularnewline
Time or Index & Actuals & InterpolationForecast & ResidualsPrediction Error \tabularnewline
1 & 107.89 & 107.448675630340 & 0.441324369660214 \tabularnewline
2 & 107.26 & 107.257783407569 & 0.00221659243087586 \tabularnewline
3 & 107.76 & 107.638567799500 & 0.121432200499641 \tabularnewline
4 & 107.32 & 107.562261663777 & -0.242261663777006 \tabularnewline
5 & 107.15 & 107.741603133163 & -0.59160313316256 \tabularnewline
6 & 108.04 & 107.645369387397 & 0.394630612602762 \tabularnewline
7 & 106.52 & 106.645738978254 & -0.125738978253926 \tabularnewline
8 & 106.62 & 105.621580413423 & 0.998419586577325 \tabularnewline
9 & 106.47 & 105.290247097959 & 1.17975290204084 \tabularnewline
10 & 105.46 & 104.699702971664 & 0.760297028336293 \tabularnewline
11 & 106.13 & 104.955588101459 & 1.17441189854104 \tabularnewline
12 & 105.15 & 104.404377982948 & 0.745622017052356 \tabularnewline
13 & 105.39 & 104.868775236499 & 0.521224763501339 \tabularnewline
14 & 104.57 & 105.104259763167 & -0.534259763166749 \tabularnewline
15 & 104.29 & 105.207899267963 & -0.917899267963046 \tabularnewline
16 & 104.09 & 105.227527900863 & -1.13752790086330 \tabularnewline
17 & 104.51 & 105.417528788985 & -0.907528788984849 \tabularnewline
18 & 103.39 & 104.767005268950 & -1.37700526894966 \tabularnewline
19 & 102.71 & 103.735396603598 & -1.02539660359846 \tabularnewline
20 & 102.62 & 103.660247366006 & -1.04024736600625 \tabularnewline
21 & 101.94 & 103.456827075374 & -1.51682707537423 \tabularnewline
22 & 101.65 & 102.887601786551 & -1.23760178655068 \tabularnewline
23 & 101.86 & 103.314037616121 & -1.45403761612128 \tabularnewline
24 & 101.27 & 103.071950640953 & -1.80195064095279 \tabularnewline
25 & 101.21 & 103.515029057032 & -2.30502905703189 \tabularnewline
26 & 102.15 & 103.302817996790 & -1.15281799678967 \tabularnewline
27 & 102.07 & 103.438435757794 & -1.36843575779389 \tabularnewline
28 & 102.8 & 103.180919503559 & -0.380919503559199 \tabularnewline
29 & 103.39 & 103.019159573394 & 0.370840426605899 \tabularnewline
30 & 102.71 & 102.624462103022 & 0.085537896978079 \tabularnewline
31 & 102.65 & 101.891317162278 & 0.758682837722442 \tabularnewline
32 & 101.12 & 101.080668031904 & 0.0393319680958057 \tabularnewline
33 & 100.29 & 100.632081110345 & -0.34208111034511 \tabularnewline
34 & 99.79 & 99.7963703531226 & -0.00637035312259156 \tabularnewline
35 & 100.11 & 100.553248163508 & -0.443248163507919 \tabularnewline
36 & 99.76 & 100.407095956963 & -0.647095956963058 \tabularnewline
37 & 99.96 & 100.125333898997 & -0.16533389899697 \tabularnewline
38 & 99.98 & 99.9664199324345 & 0.0135800675654582 \tabularnewline
39 & 100.49 & 100.080718855967 & 0.409281144033175 \tabularnewline
40 & 100.75 & 100.121666326339 & 0.628333673660997 \tabularnewline
41 & 100.84 & 100.343645470668 & 0.496354529331591 \tabularnewline
42 & 100.44 & 99.6931219506332 & 0.74687804936678 \tabularnewline
43 & 99.57 & 98.64019444781 & 0.92980555218989 \tabularnewline
44 & 99.22 & 98.3731756729706 & 0.846824327029367 \tabularnewline
45 & 99.08 & 98.2550307322263 & 0.82496926777372 \tabularnewline
46 & 98.04 & 97.4086605562678 & 0.631339443732197 \tabularnewline
47 & 98.73 & 97.8777340607822 & 0.85226593921776 \tabularnewline
48 & 98.72 & 97.4117992921586 & 1.30820070784139 \tabularnewline
49 & 100.07 & 97.9934501518052 & 2.07654984819481 \tabularnewline
50 & 99.02 & 97.6106883917876 & 1.40931160821236 \tabularnewline
51 & 98.94 & 97.5650960342805 & 1.37490396571948 \tabularnewline
52 & 99 & 97.765934785692 & 1.23406521430792 \tabularnewline
53 & 98.54 & 97.6361531117348 & 0.90384688826516 \tabularnewline
54 & 98.42 & 97.689151228273 & 0.730848771727053 \tabularnewline
55 & 97.9 & 97.4676583868546 & 0.432341613145376 \tabularnewline
56 & 97.46 & 97.0514077497117 & 0.40859225028826 \tabularnewline
57 & 97 & 96.6134802468886 & 0.386519753111384 \tabularnewline
58 & 95.97 & 95.6178782086267 & 0.352121791373291 \tabularnewline
59 & 96.55 & 95.9696981070456 & 0.580301892954402 \tabularnewline
60 & 96.51 & 95.780908225557 & 0.729091774443107 \tabularnewline
61 & 96.76 & 96.1387112917483 & 0.62128870825168 \tabularnewline
62 & 96.05 & 95.7666089504667 & 0.283391049533255 \tabularnewline
63 & 96.47 & 96.0407991550384 & 0.429200844961594 \tabularnewline
64 & 96.38 & 96.1137248816185 & 0.266275118381544 \tabularnewline
65 & 97.27 & 96.570211238139 & 0.69978876186104 \tabularnewline
66 & 96.67 & 96.1755137677668 & 0.494486232233218 \tabularnewline
67 & 96.59 & 95.6555572017416 & 0.93444279825839 \tabularnewline
68 & 96.06 & 95.2712848208066 & 0.788715179193406 \tabularnewline
69 & 96.92 & 95.3769876735174 & 1.54301232648261 \tabularnewline
70 & 94.96 & 94.232153772952 & 0.72784622704794 \tabularnewline
71 & 95.59 & 94.850459139770 & 0.73954086023009 \tabularnewline
72 & 95.68 & 94.459140302298 & 1.22085969770201 \tabularnewline
73 & 95.35 & 94.8595810434333 & 0.49041895656674 \tabularnewline
74 & 95.41 & 94.4874787021517 & 0.922521297848325 \tabularnewline
75 & 95.32 & 94.7403500692514 & 0.579649930748572 \tabularnewline
76 & 95.8 & 95.2183337077979 & 0.581666292202097 \tabularnewline
77 & 95.46 & 95.2164650586722 & 0.243534941327815 \tabularnewline
78 & 94.16 & 94.3420937451819 & -0.182093745181858 \tabularnewline
79 & 92.49 & 92.9907025177519 & -0.500702517751894 \tabularnewline
80 & 91.58 & 92.6490678117607 & -1.0690678117607 \tabularnewline
81 & 91.5 & 92.4989446148085 & -0.99894461480848 \tabularnewline
82 & 90.83 & 92.0576323508164 & -1.22763235081645 \tabularnewline
83 & 91.28 & 92.7292348113141 & -1.44923481131410 \tabularnewline
84 & 90.57 & 92.124727599123 & -1.55472759912301 \tabularnewline
85 & 90.93 & 92.6104436901459 & -1.68044369014592 \tabularnewline
86 & 90.9 & 91.8439428556339 & -0.943942855633854 \tabularnewline
87 & 91.49 & 92.1181330602055 & -0.628133060205528 \tabularnewline
88 & 91.38 & 92.329631230353 & -0.94963123035305 \tabularnewline
89 & 90.91 & 92.125233625244 & -1.21523362524409 \tabularnewline
90 & 90.72 & 91.6132825487764 & -0.893282548776376 \tabularnewline
91 & 89.53 & 90.9334347017118 & -1.40343470171181 \tabularnewline
92 & 89.47 & 90.4425681334172 & -0.972568133417214 \tabularnewline
93 & 89.28 & 90.3564014488807 & -1.07640144888073 \tabularnewline
\hline
\end{tabular}
%Source: https://freestatistics.org/blog/index.php?pk=5699&T=4

[TABLE]
[ROW][C]Multiple Linear Regression - Actuals, Interpolation, and Residuals[/C][/ROW]
[ROW][C]Time or Index[/C][C]Actuals[/C][C]InterpolationForecast[/C][C]ResidualsPrediction Error[/C][/ROW]
[ROW][C]1[/C][C]107.89[/C][C]107.448675630340[/C][C]0.441324369660214[/C][/ROW]
[ROW][C]2[/C][C]107.26[/C][C]107.257783407569[/C][C]0.00221659243087586[/C][/ROW]
[ROW][C]3[/C][C]107.76[/C][C]107.638567799500[/C][C]0.121432200499641[/C][/ROW]
[ROW][C]4[/C][C]107.32[/C][C]107.562261663777[/C][C]-0.242261663777006[/C][/ROW]
[ROW][C]5[/C][C]107.15[/C][C]107.741603133163[/C][C]-0.59160313316256[/C][/ROW]
[ROW][C]6[/C][C]108.04[/C][C]107.645369387397[/C][C]0.394630612602762[/C][/ROW]
[ROW][C]7[/C][C]106.52[/C][C]106.645738978254[/C][C]-0.125738978253926[/C][/ROW]
[ROW][C]8[/C][C]106.62[/C][C]105.621580413423[/C][C]0.998419586577325[/C][/ROW]
[ROW][C]9[/C][C]106.47[/C][C]105.290247097959[/C][C]1.17975290204084[/C][/ROW]
[ROW][C]10[/C][C]105.46[/C][C]104.699702971664[/C][C]0.760297028336293[/C][/ROW]
[ROW][C]11[/C][C]106.13[/C][C]104.955588101459[/C][C]1.17441189854104[/C][/ROW]
[ROW][C]12[/C][C]105.15[/C][C]104.404377982948[/C][C]0.745622017052356[/C][/ROW]
[ROW][C]13[/C][C]105.39[/C][C]104.868775236499[/C][C]0.521224763501339[/C][/ROW]
[ROW][C]14[/C][C]104.57[/C][C]105.104259763167[/C][C]-0.534259763166749[/C][/ROW]
[ROW][C]15[/C][C]104.29[/C][C]105.207899267963[/C][C]-0.917899267963046[/C][/ROW]
[ROW][C]16[/C][C]104.09[/C][C]105.227527900863[/C][C]-1.13752790086330[/C][/ROW]
[ROW][C]17[/C][C]104.51[/C][C]105.417528788985[/C][C]-0.907528788984849[/C][/ROW]
[ROW][C]18[/C][C]103.39[/C][C]104.767005268950[/C][C]-1.37700526894966[/C][/ROW]
[ROW][C]19[/C][C]102.71[/C][C]103.735396603598[/C][C]-1.02539660359846[/C][/ROW]
[ROW][C]20[/C][C]102.62[/C][C]103.660247366006[/C][C]-1.04024736600625[/C][/ROW]
[ROW][C]21[/C][C]101.94[/C][C]103.456827075374[/C][C]-1.51682707537423[/C][/ROW]
[ROW][C]22[/C][C]101.65[/C][C]102.887601786551[/C][C]-1.23760178655068[/C][/ROW]
[ROW][C]23[/C][C]101.86[/C][C]103.314037616121[/C][C]-1.45403761612128[/C][/ROW]
[ROW][C]24[/C][C]101.27[/C][C]103.071950640953[/C][C]-1.80195064095279[/C][/ROW]
[ROW][C]25[/C][C]101.21[/C][C]103.515029057032[/C][C]-2.30502905703189[/C][/ROW]
[ROW][C]26[/C][C]102.15[/C][C]103.302817996790[/C][C]-1.15281799678967[/C][/ROW]
[ROW][C]27[/C][C]102.07[/C][C]103.438435757794[/C][C]-1.36843575779389[/C][/ROW]
[ROW][C]28[/C][C]102.8[/C][C]103.180919503559[/C][C]-0.380919503559199[/C][/ROW]
[ROW][C]29[/C][C]103.39[/C][C]103.019159573394[/C][C]0.370840426605899[/C][/ROW]
[ROW][C]30[/C][C]102.71[/C][C]102.624462103022[/C][C]0.085537896978079[/C][/ROW]
[ROW][C]31[/C][C]102.65[/C][C]101.891317162278[/C][C]0.758682837722442[/C][/ROW]
[ROW][C]32[/C][C]101.12[/C][C]101.080668031904[/C][C]0.0393319680958057[/C][/ROW]
[ROW][C]33[/C][C]100.29[/C][C]100.632081110345[/C][C]-0.34208111034511[/C][/ROW]
[ROW][C]34[/C][C]99.79[/C][C]99.7963703531226[/C][C]-0.00637035312259156[/C][/ROW]
[ROW][C]35[/C][C]100.11[/C][C]100.553248163508[/C][C]-0.443248163507919[/C][/ROW]
[ROW][C]36[/C][C]99.76[/C][C]100.407095956963[/C][C]-0.647095956963058[/C][/ROW]
[ROW][C]37[/C][C]99.96[/C][C]100.125333898997[/C][C]-0.16533389899697[/C][/ROW]
[ROW][C]38[/C][C]99.98[/C][C]99.9664199324345[/C][C]0.0135800675654582[/C][/ROW]
[ROW][C]39[/C][C]100.49[/C][C]100.080718855967[/C][C]0.409281144033175[/C][/ROW]
[ROW][C]40[/C][C]100.75[/C][C]100.121666326339[/C][C]0.628333673660997[/C][/ROW]
[ROW][C]41[/C][C]100.84[/C][C]100.343645470668[/C][C]0.496354529331591[/C][/ROW]
[ROW][C]42[/C][C]100.44[/C][C]99.6931219506332[/C][C]0.74687804936678[/C][/ROW]
[ROW][C]43[/C][C]99.57[/C][C]98.64019444781[/C][C]0.92980555218989[/C][/ROW]
[ROW][C]44[/C][C]99.22[/C][C]98.3731756729706[/C][C]0.846824327029367[/C][/ROW]
[ROW][C]45[/C][C]99.08[/C][C]98.2550307322263[/C][C]0.82496926777372[/C][/ROW]
[ROW][C]46[/C][C]98.04[/C][C]97.4086605562678[/C][C]0.631339443732197[/C][/ROW]
[ROW][C]47[/C][C]98.73[/C][C]97.8777340607822[/C][C]0.85226593921776[/C][/ROW]
[ROW][C]48[/C][C]98.72[/C][C]97.4117992921586[/C][C]1.30820070784139[/C][/ROW]
[ROW][C]49[/C][C]100.07[/C][C]97.9934501518052[/C][C]2.07654984819481[/C][/ROW]
[ROW][C]50[/C][C]99.02[/C][C]97.6106883917876[/C][C]1.40931160821236[/C][/ROW]
[ROW][C]51[/C][C]98.94[/C][C]97.5650960342805[/C][C]1.37490396571948[/C][/ROW]
[ROW][C]52[/C][C]99[/C][C]97.765934785692[/C][C]1.23406521430792[/C][/ROW]
[ROW][C]53[/C][C]98.54[/C][C]97.6361531117348[/C][C]0.90384688826516[/C][/ROW]
[ROW][C]54[/C][C]98.42[/C][C]97.689151228273[/C][C]0.730848771727053[/C][/ROW]
[ROW][C]55[/C][C]97.9[/C][C]97.4676583868546[/C][C]0.432341613145376[/C][/ROW]
[ROW][C]56[/C][C]97.46[/C][C]97.0514077497117[/C][C]0.40859225028826[/C][/ROW]
[ROW][C]57[/C][C]97[/C][C]96.6134802468886[/C][C]0.386519753111384[/C][/ROW]
[ROW][C]58[/C][C]95.97[/C][C]95.6178782086267[/C][C]0.352121791373291[/C][/ROW]
[ROW][C]59[/C][C]96.55[/C][C]95.9696981070456[/C][C]0.580301892954402[/C][/ROW]
[ROW][C]60[/C][C]96.51[/C][C]95.780908225557[/C][C]0.729091774443107[/C][/ROW]
[ROW][C]61[/C][C]96.76[/C][C]96.1387112917483[/C][C]0.62128870825168[/C][/ROW]
[ROW][C]62[/C][C]96.05[/C][C]95.7666089504667[/C][C]0.283391049533255[/C][/ROW]
[ROW][C]63[/C][C]96.47[/C][C]96.0407991550384[/C][C]0.429200844961594[/C][/ROW]
[ROW][C]64[/C][C]96.38[/C][C]96.1137248816185[/C][C]0.266275118381544[/C][/ROW]
[ROW][C]65[/C][C]97.27[/C][C]96.570211238139[/C][C]0.69978876186104[/C][/ROW]
[ROW][C]66[/C][C]96.67[/C][C]96.1755137677668[/C][C]0.494486232233218[/C][/ROW]
[ROW][C]67[/C][C]96.59[/C][C]95.6555572017416[/C][C]0.93444279825839[/C][/ROW]
[ROW][C]68[/C][C]96.06[/C][C]95.2712848208066[/C][C]0.788715179193406[/C][/ROW]
[ROW][C]69[/C][C]96.92[/C][C]95.3769876735174[/C][C]1.54301232648261[/C][/ROW]
[ROW][C]70[/C][C]94.96[/C][C]94.232153772952[/C][C]0.72784622704794[/C][/ROW]
[ROW][C]71[/C][C]95.59[/C][C]94.850459139770[/C][C]0.73954086023009[/C][/ROW]
[ROW][C]72[/C][C]95.68[/C][C]94.459140302298[/C][C]1.22085969770201[/C][/ROW]
[ROW][C]73[/C][C]95.35[/C][C]94.8595810434333[/C][C]0.49041895656674[/C][/ROW]
[ROW][C]74[/C][C]95.41[/C][C]94.4874787021517[/C][C]0.922521297848325[/C][/ROW]
[ROW][C]75[/C][C]95.32[/C][C]94.7403500692514[/C][C]0.579649930748572[/C][/ROW]
[ROW][C]76[/C][C]95.8[/C][C]95.2183337077979[/C][C]0.581666292202097[/C][/ROW]
[ROW][C]77[/C][C]95.46[/C][C]95.2164650586722[/C][C]0.243534941327815[/C][/ROW]
[ROW][C]78[/C][C]94.16[/C][C]94.3420937451819[/C][C]-0.182093745181858[/C][/ROW]
[ROW][C]79[/C][C]92.49[/C][C]92.9907025177519[/C][C]-0.500702517751894[/C][/ROW]
[ROW][C]80[/C][C]91.58[/C][C]92.6490678117607[/C][C]-1.0690678117607[/C][/ROW]
[ROW][C]81[/C][C]91.5[/C][C]92.4989446148085[/C][C]-0.99894461480848[/C][/ROW]
[ROW][C]82[/C][C]90.83[/C][C]92.0576323508164[/C][C]-1.22763235081645[/C][/ROW]
[ROW][C]83[/C][C]91.28[/C][C]92.7292348113141[/C][C]-1.44923481131410[/C][/ROW]
[ROW][C]84[/C][C]90.57[/C][C]92.124727599123[/C][C]-1.55472759912301[/C][/ROW]
[ROW][C]85[/C][C]90.93[/C][C]92.6104436901459[/C][C]-1.68044369014592[/C][/ROW]
[ROW][C]86[/C][C]90.9[/C][C]91.8439428556339[/C][C]-0.943942855633854[/C][/ROW]
[ROW][C]87[/C][C]91.49[/C][C]92.1181330602055[/C][C]-0.628133060205528[/C][/ROW]
[ROW][C]88[/C][C]91.38[/C][C]92.329631230353[/C][C]-0.94963123035305[/C][/ROW]
[ROW][C]89[/C][C]90.91[/C][C]92.125233625244[/C][C]-1.21523362524409[/C][/ROW]
[ROW][C]90[/C][C]90.72[/C][C]91.6132825487764[/C][C]-0.893282548776376[/C][/ROW]
[ROW][C]91[/C][C]89.53[/C][C]90.9334347017118[/C][C]-1.40343470171181[/C][/ROW]
[ROW][C]92[/C][C]89.47[/C][C]90.4425681334172[/C][C]-0.972568133417214[/C][/ROW]
[ROW][C]93[/C][C]89.28[/C][C]90.3564014488807[/C][C]-1.07640144888073[/C][/ROW]
[/TABLE]
Source: https://freestatistics.org/blog/index.php?pk=5699&T=4

Globally Unique Identifier (entire table): ba.freestatistics.org/blog/index.php?pk=5699&T=4

As an alternative you can also use a QR Code:  

The GUIDs for individual cells are displayed in the table below:

Multiple Linear Regression - Actuals, Interpolation, and Residuals
Time or IndexActualsInterpolationForecastResidualsPrediction Error
1107.89107.4486756303400.441324369660214
2107.26107.2577834075690.00221659243087586
3107.76107.6385677995000.121432200499641
4107.32107.562261663777-0.242261663777006
5107.15107.741603133163-0.59160313316256
6108.04107.6453693873970.394630612602762
7106.52106.645738978254-0.125738978253926
8106.62105.6215804134230.998419586577325
9106.47105.2902470979591.17975290204084
10105.46104.6997029716640.760297028336293
11106.13104.9555881014591.17441189854104
12105.15104.4043779829480.745622017052356
13105.39104.8687752364990.521224763501339
14104.57105.104259763167-0.534259763166749
15104.29105.207899267963-0.917899267963046
16104.09105.227527900863-1.13752790086330
17104.51105.417528788985-0.907528788984849
18103.39104.767005268950-1.37700526894966
19102.71103.735396603598-1.02539660359846
20102.62103.660247366006-1.04024736600625
21101.94103.456827075374-1.51682707537423
22101.65102.887601786551-1.23760178655068
23101.86103.314037616121-1.45403761612128
24101.27103.071950640953-1.80195064095279
25101.21103.515029057032-2.30502905703189
26102.15103.302817996790-1.15281799678967
27102.07103.438435757794-1.36843575779389
28102.8103.180919503559-0.380919503559199
29103.39103.0191595733940.370840426605899
30102.71102.6244621030220.085537896978079
31102.65101.8913171622780.758682837722442
32101.12101.0806680319040.0393319680958057
33100.29100.632081110345-0.34208111034511
3499.7999.7963703531226-0.00637035312259156
35100.11100.553248163508-0.443248163507919
3699.76100.407095956963-0.647095956963058
3799.96100.125333898997-0.16533389899697
3899.9899.96641993243450.0135800675654582
39100.49100.0807188559670.409281144033175
40100.75100.1216663263390.628333673660997
41100.84100.3436454706680.496354529331591
42100.4499.69312195063320.74687804936678
4399.5798.640194447810.92980555218989
4499.2298.37317567297060.846824327029367
4599.0898.25503073222630.82496926777372
4698.0497.40866055626780.631339443732197
4798.7397.87773406078220.85226593921776
4898.7297.41179929215861.30820070784139
49100.0797.99345015180522.07654984819481
5099.0297.61068839178761.40931160821236
5198.9497.56509603428051.37490396571948
529997.7659347856921.23406521430792
5398.5497.63615311173480.90384688826516
5498.4297.6891512282730.730848771727053
5597.997.46765838685460.432341613145376
5697.4697.05140774971170.40859225028826
579796.61348024688860.386519753111384
5895.9795.61787820862670.352121791373291
5996.5595.96969810704560.580301892954402
6096.5195.7809082255570.729091774443107
6196.7696.13871129174830.62128870825168
6296.0595.76660895046670.283391049533255
6396.4796.04079915503840.429200844961594
6496.3896.11372488161850.266275118381544
6597.2796.5702112381390.69978876186104
6696.6796.17551376776680.494486232233218
6796.5995.65555720174160.93444279825839
6896.0695.27128482080660.788715179193406
6996.9295.37698767351741.54301232648261
7094.9694.2321537729520.72784622704794
7195.5994.8504591397700.73954086023009
7295.6894.4591403022981.22085969770201
7395.3594.85958104343330.49041895656674
7495.4194.48747870215170.922521297848325
7595.3294.74035006925140.579649930748572
7695.895.21833370779790.581666292202097
7795.4695.21646505867220.243534941327815
7894.1694.3420937451819-0.182093745181858
7992.4992.9907025177519-0.500702517751894
8091.5892.6490678117607-1.0690678117607
8191.592.4989446148085-0.99894461480848
8290.8392.0576323508164-1.22763235081645
8391.2892.7292348113141-1.44923481131410
8490.5792.124727599123-1.55472759912301
8590.9392.6104436901459-1.68044369014592
8690.991.8439428556339-0.943942855633854
8791.4992.1181330602055-0.628133060205528
8891.3892.329631230353-0.94963123035305
8990.9192.125233625244-1.21523362524409
9090.7291.6132825487764-0.893282548776376
9189.5390.9334347017118-1.40343470171181
9289.4790.4425681334172-0.972568133417214
9389.2890.3564014488807-1.07640144888073


Parameters (Session):
par1 = 2 ; par2 = Include Monthly Dummies ; par3 = No Linear Trend ;
Parameters (R input):
par1 = 2 ; par2 = Include Monthly Dummies ; par3 = No Linear Trend ;
R code (references can be found in the software module):
library(lattice)
par1 <- as.numeric(par1)
x <- t(y)
k <- length(x[1,])
n <- length(x[,1])
x1 <- cbind(x[,par1], x[,1:k!=par1])
mycolnames <- c(colnames(x)[par1], colnames(x)[1:k!=par1])
colnames(x1) <- mycolnames #colnames(x)[par1]
x <- x1
if (par3 == 'First Differences'){
x2 <- array(0, dim=c(n-1,k), dimnames=list(1:(n-1), paste('(1-B)',colnames(x),sep='')))
for (i in 1:n-1) {
for (j in 1:k) {
x2[i,j] <- x[i+1,j] - x[i,j]
}
}
x <- x2
}
if (par2 == 'Include Monthly Dummies'){
x2 <- array(0, dim=c(n,11), dimnames=list(1:n, paste('M', seq(1:11), sep ='')))
for (i in 1:11){
x2[seq(i,n,12),i] <- 1
}
x <- cbind(x, x2)
}
if (par2 == 'Include Quarterly Dummies'){
x2 <- array(0, dim=c(n,3), dimnames=list(1:n, paste('Q', seq(1:3), sep ='')))
for (i in 1:3){
x2[seq(i,n,4),i] <- 1
}
x <- cbind(x, x2)
}
k <- length(x[1,])
if (par3 == 'Linear Trend'){
x <- cbind(x, c(1:n))
colnames(x)[k+1] <- 't'
}
x
k <- length(x[1,])
df <- as.data.frame(x)
(mylm <- lm(df))
(mysum <- summary(mylm))
bitmap(file='test0.png')
plot(x[,1], type='l', main='Actuals and Interpolation', ylab='value of Actuals and Interpolation (dots)', xlab='time or index')
points(x[,1]-mysum$resid)
grid()
dev.off()
bitmap(file='test1.png')
plot(mysum$resid, type='b', pch=19, main='Residuals', ylab='value of Residuals', xlab='time or index')
grid()
dev.off()
bitmap(file='test2.png')
hist(mysum$resid, main='Residual Histogram', xlab='values of Residuals')
grid()
dev.off()
bitmap(file='test3.png')
densityplot(~mysum$resid,col='black',main='Residual Density Plot', xlab='values of Residuals')
dev.off()
bitmap(file='test4.png')
qqnorm(mysum$resid, main='Residual Normal Q-Q Plot')
grid()
dev.off()
(myerror <- as.ts(mysum$resid))
bitmap(file='test5.png')
dum <- cbind(lag(myerror,k=1),myerror)
dum
dum1 <- dum[2:length(myerror),]
dum1
z <- as.data.frame(dum1)
z
plot(z,main=paste('Residual Lag plot, lowess, and regression line'), ylab='values of Residuals', xlab='lagged values of Residuals')
lines(lowess(z))
abline(lm(z))
grid()
dev.off()
bitmap(file='test6.png')
acf(mysum$resid, lag.max=length(mysum$resid)/2, main='Residual Autocorrelation Function')
grid()
dev.off()
bitmap(file='test7.png')
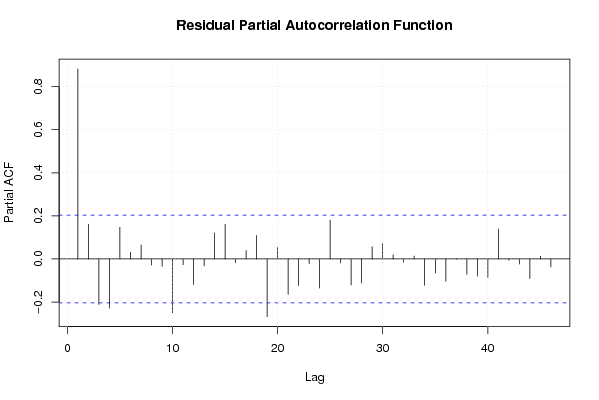
pacf(mysum$resid, lag.max=length(mysum$resid)/2, main='Residual Partial Autocorrelation Function')
grid()
dev.off()
bitmap(file='test8.png')
opar <- par(mfrow = c(2,2), oma = c(0, 0, 1.1, 0))
plot(mylm, las = 1, sub='Residual Diagnostics')
par(opar)
dev.off()
load(file='createtable')
a<-table.start()
a<-table.row.start(a)
a<-table.element(a, 'Multiple Linear Regression - Estimated Regression Equation', 1, TRUE)
a<-table.row.end(a)
myeq <- colnames(x)[1]
myeq <- paste(myeq, '[t] = ', sep='')
for (i in 1:k){
if (mysum$coefficients[i,1] > 0) myeq <- paste(myeq, '+', '')
myeq <- paste(myeq, mysum$coefficients[i,1], sep=' ')
if (rownames(mysum$coefficients)[i] != '(Intercept)') {
myeq <- paste(myeq, rownames(mysum$coefficients)[i], sep='')
if (rownames(mysum$coefficients)[i] != 't') myeq <- paste(myeq, '[t]', sep='')
}
}
myeq <- paste(myeq, ' + e[t]')
a<-table.row.start(a)
a<-table.element(a, myeq)
a<-table.row.end(a)
a<-table.end(a)
table.save(a,file='mytable1.tab')
a<-table.start()
a<-table.row.start(a)
a<-table.element(a,hyperlink('ols1.htm','Multiple Linear Regression - Ordinary Least Squares',''), 6, TRUE)
a<-table.row.end(a)
a<-table.row.start(a)
a<-table.element(a,'Variable',header=TRUE)
a<-table.element(a,'Parameter',header=TRUE)
a<-table.element(a,'S.D.',header=TRUE)
a<-table.element(a,'T-STAT
H0: parameter = 0',header=TRUE)
a<-table.element(a,'2-tail p-value',header=TRUE)
a<-table.element(a,'1-tail p-value',header=TRUE)
a<-table.row.end(a)
for (i in 1:k){
a<-table.row.start(a)
a<-table.element(a,rownames(mysum$coefficients)[i],header=TRUE)
a<-table.element(a,mysum$coefficients[i,1])
a<-table.element(a, round(mysum$coefficients[i,2],6))
a<-table.element(a, round(mysum$coefficients[i,3],4))
a<-table.element(a, round(mysum$coefficients[i,4],6))
a<-table.element(a, round(mysum$coefficients[i,4]/2,6))
a<-table.row.end(a)
}
a<-table.end(a)
table.save(a,file='mytable2.tab')
a<-table.start()
a<-table.row.start(a)
a<-table.element(a, 'Multiple Linear Regression - Regression Statistics', 2, TRUE)
a<-table.row.end(a)
a<-table.row.start(a)
a<-table.element(a, 'Multiple R',1,TRUE)
a<-table.element(a, sqrt(mysum$r.squared))
a<-table.row.end(a)
a<-table.row.start(a)
a<-table.element(a, 'R-squared',1,TRUE)
a<-table.element(a, mysum$r.squared)
a<-table.row.end(a)
a<-table.row.start(a)
a<-table.element(a, 'Adjusted R-squared',1,TRUE)
a<-table.element(a, mysum$adj.r.squared)
a<-table.row.end(a)
a<-table.row.start(a)
a<-table.element(a, 'F-TEST (value)',1,TRUE)
a<-table.element(a, mysum$fstatistic[1])
a<-table.row.end(a)
a<-table.row.start(a)
a<-table.element(a, 'F-TEST (DF numerator)',1,TRUE)
a<-table.element(a, mysum$fstatistic[2])
a<-table.row.end(a)
a<-table.row.start(a)
a<-table.element(a, 'F-TEST (DF denominator)',1,TRUE)
a<-table.element(a, mysum$fstatistic[3])
a<-table.row.end(a)
a<-table.row.start(a)
a<-table.element(a, 'p-value',1,TRUE)
a<-table.element(a, 1-pf(mysum$fstatistic[1],mysum$fstatistic[2],mysum$fstatistic[3]))
a<-table.row.end(a)
a<-table.row.start(a)
a<-table.element(a, 'Multiple Linear Regression - Residual Statistics', 2, TRUE)
a<-table.row.end(a)
a<-table.row.start(a)
a<-table.element(a, 'Residual Standard Deviation',1,TRUE)
a<-table.element(a, mysum$sigma)
a<-table.row.end(a)
a<-table.row.start(a)
a<-table.element(a, 'Sum Squared Residuals',1,TRUE)
a<-table.element(a, sum(myerror*myerror))
a<-table.row.end(a)
a<-table.end(a)
table.save(a,file='mytable3.tab')
a<-table.start()
a<-table.row.start(a)
a<-table.element(a, 'Multiple Linear Regression - Actuals, Interpolation, and Residuals', 4, TRUE)
a<-table.row.end(a)
a<-table.row.start(a)
a<-table.element(a, 'Time or Index', 1, TRUE)
a<-table.element(a, 'Actuals', 1, TRUE)
a<-table.element(a, 'Interpolation
Forecast', 1, TRUE)
a<-table.element(a, 'Residuals
Prediction Error', 1, TRUE)
a<-table.row.end(a)
for (i in 1:n) {
a<-table.row.start(a)
a<-table.element(a,i, 1, TRUE)
a<-table.element(a,x[i])
a<-table.element(a,x[i]-mysum$resid[i])
a<-table.element(a,mysum$resid[i])
a<-table.row.end(a)
}
a<-table.end(a)
table.save(a,file='mytable4.tab')