Free Statistics

of Irreproducible Research!

Author's title

Author*Unverified author*
R Software Modulerwasp_multipleregression.wasp
Title produced by softwareMultiple Regression
Date of computationSat, 17 Nov 2007 10:53:24 -0700
Cite this page as followsStatistical Computations at FreeStatistics.org, Office for Research Development and Education, URL https://freestatistics.org/blog/index.php?v=date/2007/Nov/17/t11953216674h1wxpl2ln31yyz.htm/, Retrieved Wed, 08 May 2024 21:38:21 +0000
Statistical Computations at FreeStatistics.org, Office for Research Development and Education, URL https://freestatistics.org/blog/index.php?pk=5540, Retrieved Wed, 08 May 2024 21:38:21 +0000
QR Codes:

Original text written by user:
IsPrivate?No (this computation is public)
User-defined keywords
Estimated Impact269
Family? (F = Feedback message, R = changed R code, M = changed R Module, P = changed Parameters, D = changed Data)
-       [Multiple Regression] [Case: the Seatbel...] [2007-11-17 17:53:24] [cb172450b25aceeff04d58e88e905157] [Current]
Feedback Forum

Post a new message
Dataseries X:
476	2,9
475	2,6
470	2,7
461	1,8
455	1,3
456	0,9
517	1,3
525	1,3
523	1,3
519	1,3
509	1,1
512	1,4
519	1,2
517	1,7
510	1,8
509	1,5
501	1
507	1,6
569	1,5
580	1,8
578	1,8
565	1,6
547	1,9
555	1,7
562	1,6
561	1,3
555	1,1
544	1,9
537	2,6
543	2,3
594	2,4
611	2,2
613	2
611	2,9
594	2,6
595	2,3
591	2,3
589	2,6
584	3,1
573	2,8
567	2,5
569	2,9
621	3,1
629	3,1
628	3,2
612	2,5
595	2,6
597	2,9
593	2,6
590	2,4
580	1,7
574	2
573	2,2
573	1,9
620	1,6
626	1,6
620	1,2
588	1,2
566	1,5
557	1,6


Summary of compuational transaction
Raw Inputview raw input (R code)
Raw Outputview raw output of R engine
Computing time6 seconds
R Server'Herman Ole Andreas Wold' @ 193.190.124.10:1001

\begin{tabular}{lllllllll}
\hline
Summary of compuational transaction \tabularnewline
Raw Input & view raw input (R code)  \tabularnewline
Raw Output & view raw output of R engine  \tabularnewline
Computing time & 6 seconds \tabularnewline
R Server & 'Herman Ole Andreas Wold' @ 193.190.124.10:1001 \tabularnewline
\hline
\end{tabular}
%Source: https://freestatistics.org/blog/index.php?pk=5540&T=0

[TABLE]
[ROW][C]Summary of compuational transaction[/C][/ROW]
[ROW][C]Raw Input[/C][C]view raw input (R code) [/C][/ROW]
[ROW][C]Raw Output[/C][C]view raw output of R engine [/C][/ROW]
[ROW][C]Computing time[/C][C]6 seconds[/C][/ROW]
[ROW][C]R Server[/C][C]'Herman Ole Andreas Wold' @ 193.190.124.10:1001[/C][/ROW]
[/TABLE]
Source: https://freestatistics.org/blog/index.php?pk=5540&T=0

Globally Unique Identifier (entire table): ba.freestatistics.org/blog/index.php?pk=5540&T=0

As an alternative you can also use a QR Code:  

The GUIDs for individual cells are displayed in the table below:

Summary of compuational transaction
Raw Inputview raw input (R code)
Raw Outputview raw output of R engine
Computing time6 seconds
R Server'Herman Ole Andreas Wold' @ 193.190.124.10:1001


Multiple Linear Regression - Estimated Regression Equation
Werkloosheid*1000[t] = + 465.407101309638 + 14.4669259774709Inflatie[t] + 4.10330363550572M1[t] + 0.382515156201070M2[t] -7.5595962840048M3[t] -15.9230306851118M4[t] -22.2864650862189M5[t] -21.2072535655235M6[t] + 30.6039423965235M7[t] + 38.3938153976694M8[t] + 36.1197195161118M9[t] + 20.7989310368071M10[t] + 1.49946551840354M11[t] + 1.9207884793047t + e[t]

\begin{tabular}{lllllllll}
\hline
Multiple Linear Regression - Estimated Regression Equation \tabularnewline
Werkloosheid*1000[t] =  +  465.407101309638 +  14.4669259774709Inflatie[t] +  4.10330363550572M1[t] +  0.382515156201070M2[t] -7.5595962840048M3[t] -15.9230306851118M4[t] -22.2864650862189M5[t] -21.2072535655235M6[t] +  30.6039423965235M7[t] +  38.3938153976694M8[t] +  36.1197195161118M9[t] +  20.7989310368071M10[t] +  1.49946551840354M11[t] +  1.9207884793047t  + e[t] \tabularnewline
\hline
\end{tabular}
%Source: https://freestatistics.org/blog/index.php?pk=5540&T=1

[TABLE]
[ROW][C]Multiple Linear Regression - Estimated Regression Equation[/C][/ROW]
[ROW][C]Werkloosheid*1000[t] =  +  465.407101309638 +  14.4669259774709Inflatie[t] +  4.10330363550572M1[t] +  0.382515156201070M2[t] -7.5595962840048M3[t] -15.9230306851118M4[t] -22.2864650862189M5[t] -21.2072535655235M6[t] +  30.6039423965235M7[t] +  38.3938153976694M8[t] +  36.1197195161118M9[t] +  20.7989310368071M10[t] +  1.49946551840354M11[t] +  1.9207884793047t  + e[t][/C][/ROW]
[/TABLE]
Source: https://freestatistics.org/blog/index.php?pk=5540&T=1

Globally Unique Identifier (entire table): ba.freestatistics.org/blog/index.php?pk=5540&T=1

As an alternative you can also use a QR Code:  

The GUIDs for individual cells are displayed in the table below:

Multiple Linear Regression - Estimated Regression Equation
Werkloosheid*1000[t] = + 465.407101309638 + 14.4669259774709Inflatie[t] + 4.10330363550572M1[t] + 0.382515156201070M2[t] -7.5595962840048M3[t] -15.9230306851118M4[t] -22.2864650862189M5[t] -21.2072535655235M6[t] + 30.6039423965235M7[t] + 38.3938153976694M8[t] + 36.1197195161118M9[t] + 20.7989310368071M10[t] + 1.49946551840354M11[t] + 1.9207884793047t + e[t]


Multiple Linear Regression - Ordinary Least Squares
VariableParameterS.D.T-STATH0: parameter = 02-tail p-value1-tail p-value
(Intercept)465.40710130963811.57492240.208200
Inflatie14.46692597747094.0560993.56670.0008570.000429
M14.1033036355057211.9154130.34440.7321380.366069
M20.38251515620107011.8931930.03220.9744820.487241
M3-7.559596284004811.860036-0.63740.5270240.263512
M4-15.923030685111811.824585-1.34660.1847060.092353
M5-22.286465086218911.802603-1.88830.0653060.032653
M6-21.207253565523511.791237-1.79860.0786520.039326
M730.603942396523511.7844042.5970.0125870.006294
M838.393815397669411.7774643.25990.0021010.00105
M936.119719516111811.7694723.06890.0035960.001798
M1020.798931036807111.7660681.76770.0837430.041871
M111.4994655184035411.7619060.12750.8991120.449556
t1.92078847930470.14998612.806500

\begin{tabular}{lllllllll}
\hline
Multiple Linear Regression - Ordinary Least Squares \tabularnewline
Variable & Parameter & S.D. & T-STATH0: parameter = 0 & 2-tail p-value & 1-tail p-value \tabularnewline
(Intercept) & 465.407101309638 & 11.574922 & 40.2082 & 0 & 0 \tabularnewline
Inflatie & 14.4669259774709 & 4.056099 & 3.5667 & 0.000857 & 0.000429 \tabularnewline
M1 & 4.10330363550572 & 11.915413 & 0.3444 & 0.732138 & 0.366069 \tabularnewline
M2 & 0.382515156201070 & 11.893193 & 0.0322 & 0.974482 & 0.487241 \tabularnewline
M3 & -7.5595962840048 & 11.860036 & -0.6374 & 0.527024 & 0.263512 \tabularnewline
M4 & -15.9230306851118 & 11.824585 & -1.3466 & 0.184706 & 0.092353 \tabularnewline
M5 & -22.2864650862189 & 11.802603 & -1.8883 & 0.065306 & 0.032653 \tabularnewline
M6 & -21.2072535655235 & 11.791237 & -1.7986 & 0.078652 & 0.039326 \tabularnewline
M7 & 30.6039423965235 & 11.784404 & 2.597 & 0.012587 & 0.006294 \tabularnewline
M8 & 38.3938153976694 & 11.777464 & 3.2599 & 0.002101 & 0.00105 \tabularnewline
M9 & 36.1197195161118 & 11.769472 & 3.0689 & 0.003596 & 0.001798 \tabularnewline
M10 & 20.7989310368071 & 11.766068 & 1.7677 & 0.083743 & 0.041871 \tabularnewline
M11 & 1.49946551840354 & 11.761906 & 0.1275 & 0.899112 & 0.449556 \tabularnewline
t & 1.9207884793047 & 0.149986 & 12.8065 & 0 & 0 \tabularnewline
\hline
\end{tabular}
%Source: https://freestatistics.org/blog/index.php?pk=5540&T=2

[TABLE]
[ROW][C]Multiple Linear Regression - Ordinary Least Squares[/C][/ROW]
[ROW][C]Variable[/C][C]Parameter[/C][C]S.D.[/C][C]T-STATH0: parameter = 0[/C][C]2-tail p-value[/C][C]1-tail p-value[/C][/ROW]
[ROW][C](Intercept)[/C][C]465.407101309638[/C][C]11.574922[/C][C]40.2082[/C][C]0[/C][C]0[/C][/ROW]
[ROW][C]Inflatie[/C][C]14.4669259774709[/C][C]4.056099[/C][C]3.5667[/C][C]0.000857[/C][C]0.000429[/C][/ROW]
[ROW][C]M1[/C][C]4.10330363550572[/C][C]11.915413[/C][C]0.3444[/C][C]0.732138[/C][C]0.366069[/C][/ROW]
[ROW][C]M2[/C][C]0.382515156201070[/C][C]11.893193[/C][C]0.0322[/C][C]0.974482[/C][C]0.487241[/C][/ROW]
[ROW][C]M3[/C][C]-7.5595962840048[/C][C]11.860036[/C][C]-0.6374[/C][C]0.527024[/C][C]0.263512[/C][/ROW]
[ROW][C]M4[/C][C]-15.9230306851118[/C][C]11.824585[/C][C]-1.3466[/C][C]0.184706[/C][C]0.092353[/C][/ROW]
[ROW][C]M5[/C][C]-22.2864650862189[/C][C]11.802603[/C][C]-1.8883[/C][C]0.065306[/C][C]0.032653[/C][/ROW]
[ROW][C]M6[/C][C]-21.2072535655235[/C][C]11.791237[/C][C]-1.7986[/C][C]0.078652[/C][C]0.039326[/C][/ROW]
[ROW][C]M7[/C][C]30.6039423965235[/C][C]11.784404[/C][C]2.597[/C][C]0.012587[/C][C]0.006294[/C][/ROW]
[ROW][C]M8[/C][C]38.3938153976694[/C][C]11.777464[/C][C]3.2599[/C][C]0.002101[/C][C]0.00105[/C][/ROW]
[ROW][C]M9[/C][C]36.1197195161118[/C][C]11.769472[/C][C]3.0689[/C][C]0.003596[/C][C]0.001798[/C][/ROW]
[ROW][C]M10[/C][C]20.7989310368071[/C][C]11.766068[/C][C]1.7677[/C][C]0.083743[/C][C]0.041871[/C][/ROW]
[ROW][C]M11[/C][C]1.49946551840354[/C][C]11.761906[/C][C]0.1275[/C][C]0.899112[/C][C]0.449556[/C][/ROW]
[ROW][C]t[/C][C]1.9207884793047[/C][C]0.149986[/C][C]12.8065[/C][C]0[/C][C]0[/C][/ROW]
[/TABLE]
Source: https://freestatistics.org/blog/index.php?pk=5540&T=2

Globally Unique Identifier (entire table): ba.freestatistics.org/blog/index.php?pk=5540&T=2

As an alternative you can also use a QR Code:  

The GUIDs for individual cells are displayed in the table below:

Multiple Linear Regression - Ordinary Least Squares
VariableParameterS.D.T-STATH0: parameter = 02-tail p-value1-tail p-value
(Intercept)465.40710130963811.57492240.208200
Inflatie14.46692597747094.0560993.56670.0008570.000429
M14.1033036355057211.9154130.34440.7321380.366069
M20.38251515620107011.8931930.03220.9744820.487241
M3-7.559596284004811.860036-0.63740.5270240.263512
M4-15.923030685111811.824585-1.34660.1847060.092353
M5-22.286465086218911.802603-1.88830.0653060.032653
M6-21.207253565523511.791237-1.79860.0786520.039326
M730.603942396523511.7844042.5970.0125870.006294
M838.393815397669411.7774643.25990.0021010.00105
M936.119719516111811.7694723.06890.0035960.001798
M1020.798931036807111.7660681.76770.0837430.041871
M111.4994655184035411.7619060.12750.8991120.449556
t1.92078847930470.14998612.806500


Multiple Linear Regression - Regression Statistics
Multiple R0.936746926230519
R-squared0.877494803802325
Adjusted R-squared0.842873770094286
F-TEST (value)25.3457135682976
F-TEST (DF numerator)13
F-TEST (DF denominator)46
p-value1.11022302462516e-16
Multiple Linear Regression - Residual Statistics
Residual Standard Deviation18.5950118887617
Sum Squared Residuals15905.6254885868

\begin{tabular}{lllllllll}
\hline
Multiple Linear Regression - Regression Statistics \tabularnewline
Multiple R & 0.936746926230519 \tabularnewline
R-squared & 0.877494803802325 \tabularnewline
Adjusted R-squared & 0.842873770094286 \tabularnewline
F-TEST (value) & 25.3457135682976 \tabularnewline
F-TEST (DF numerator) & 13 \tabularnewline
F-TEST (DF denominator) & 46 \tabularnewline
p-value & 1.11022302462516e-16 \tabularnewline
Multiple Linear Regression - Residual Statistics \tabularnewline
Residual Standard Deviation & 18.5950118887617 \tabularnewline
Sum Squared Residuals & 15905.6254885868 \tabularnewline
\hline
\end{tabular}
%Source: https://freestatistics.org/blog/index.php?pk=5540&T=3

[TABLE]
[ROW][C]Multiple Linear Regression - Regression Statistics[/C][/ROW]
[ROW][C]Multiple R[/C][C]0.936746926230519[/C][/ROW]
[ROW][C]R-squared[/C][C]0.877494803802325[/C][/ROW]
[ROW][C]Adjusted R-squared[/C][C]0.842873770094286[/C][/ROW]
[ROW][C]F-TEST (value)[/C][C]25.3457135682976[/C][/ROW]
[ROW][C]F-TEST (DF numerator)[/C][C]13[/C][/ROW]
[ROW][C]F-TEST (DF denominator)[/C][C]46[/C][/ROW]
[ROW][C]p-value[/C][C]1.11022302462516e-16[/C][/ROW]
[ROW][C]Multiple Linear Regression - Residual Statistics[/C][/ROW]
[ROW][C]Residual Standard Deviation[/C][C]18.5950118887617[/C][/ROW]
[ROW][C]Sum Squared Residuals[/C][C]15905.6254885868[/C][/ROW]
[/TABLE]
Source: https://freestatistics.org/blog/index.php?pk=5540&T=3

Globally Unique Identifier (entire table): ba.freestatistics.org/blog/index.php?pk=5540&T=3

As an alternative you can also use a QR Code:  

The GUIDs for individual cells are displayed in the table below:

Multiple Linear Regression - Regression Statistics
Multiple R0.936746926230519
R-squared0.877494803802325
Adjusted R-squared0.842873770094286
F-TEST (value)25.3457135682976
F-TEST (DF numerator)13
F-TEST (DF denominator)46
p-value1.11022302462516e-16
Multiple Linear Regression - Residual Statistics
Residual Standard Deviation18.5950118887617
Sum Squared Residuals15905.6254885868


Multiple Linear Regression - Actuals, Interpolation, and Residuals
Time or IndexActualsInterpolationForecastResidualsPrediction Error
1476513.385278759115-37.3852787591147
2475507.245200965873-32.2452009658732
3470502.670570602719-32.6705706027192
4461483.207691301193-22.2076913011930
5455471.531582390655-16.5315823906553
6456468.744811999667-12.7448119996669
7517528.263566832007-11.2635668320070
8525537.974228312458-12.9742283124576
9523537.620920910205-14.6209209102047
10519524.220920910205-5.22092091020473
11509503.9488586756125.0511413243883
12512508.7102594297543.28974057024589
13519511.840966349077.15903365092962
14517517.274429337806-0.274429337805853
15510512.699798974652-2.69979897465177
16509501.9170752596087.08292474039182
17501490.2409663490710.7590336509296
18507501.9211219355535.07887806444706
19569554.20641377915814.7935862208424
20580568.2571530528511.7428469471505
21578567.90384565059710.0961543494035
22565551.61046045510213.3895395448976
23547538.5718612092458.42813879075522
24555536.09979897465218.9002010253482
25562540.67719849171521.3228015082849
26561534.53712069847426.4628793015261
27555525.62241254207929.3775874579215
28544530.75330740225313.2466925977471
29537536.437509664680.562490335319803
30543535.0974318714397.90256812856106
31594590.2761089105383.72389108946224
32611597.09338519549413.9066148045058
33613593.84669259774719.1533074022529
34611593.46692597747117.5330740225291
35594571.74817114513122.2518288548692
36595567.82941631279127.1705836872093
37591573.85350842760117.1464915723989
38589576.39358622084212.6064137791576
39584577.6057262486776.39427375132333
40573566.8230025336336.17699746636692
41567558.040278818598.9597211814105
42569566.8270492095782.17295079042217
43621623.452418846424-2.45241884642379
44629633.163080326874-4.16308032687435
45628634.256465522369-6.25646552236853
46612610.7296173381391.2703826618611
47595594.7976328967870.202367103212828
48597599.55903365093-2.55903365092959
49593601.243047972499-8.24304797249874
50590596.549662777005-6.54966277700462
51580580.401491631874-0.401491631873829
52574578.298923503313-4.29892350331279
53573576.749662777005-3.74966277700462
54573575.409584983763-2.40958498376335
55620624.801491631874-4.80149163187383
56626634.512153112324-8.5121531123244
57620628.372075319083-8.37207531908314
58588614.972075319083-26.9720753190831
59566601.933476073226-35.9334760732256
60557603.801491631874-46.8014916318738

\begin{tabular}{lllllllll}
\hline
Multiple Linear Regression - Actuals, Interpolation, and Residuals \tabularnewline
Time or Index & Actuals & InterpolationForecast & ResidualsPrediction Error \tabularnewline
1 & 476 & 513.385278759115 & -37.3852787591147 \tabularnewline
2 & 475 & 507.245200965873 & -32.2452009658732 \tabularnewline
3 & 470 & 502.670570602719 & -32.6705706027192 \tabularnewline
4 & 461 & 483.207691301193 & -22.2076913011930 \tabularnewline
5 & 455 & 471.531582390655 & -16.5315823906553 \tabularnewline
6 & 456 & 468.744811999667 & -12.7448119996669 \tabularnewline
7 & 517 & 528.263566832007 & -11.2635668320070 \tabularnewline
8 & 525 & 537.974228312458 & -12.9742283124576 \tabularnewline
9 & 523 & 537.620920910205 & -14.6209209102047 \tabularnewline
10 & 519 & 524.220920910205 & -5.22092091020473 \tabularnewline
11 & 509 & 503.948858675612 & 5.0511413243883 \tabularnewline
12 & 512 & 508.710259429754 & 3.28974057024589 \tabularnewline
13 & 519 & 511.84096634907 & 7.15903365092962 \tabularnewline
14 & 517 & 517.274429337806 & -0.274429337805853 \tabularnewline
15 & 510 & 512.699798974652 & -2.69979897465177 \tabularnewline
16 & 509 & 501.917075259608 & 7.08292474039182 \tabularnewline
17 & 501 & 490.24096634907 & 10.7590336509296 \tabularnewline
18 & 507 & 501.921121935553 & 5.07887806444706 \tabularnewline
19 & 569 & 554.206413779158 & 14.7935862208424 \tabularnewline
20 & 580 & 568.25715305285 & 11.7428469471505 \tabularnewline
21 & 578 & 567.903845650597 & 10.0961543494035 \tabularnewline
22 & 565 & 551.610460455102 & 13.3895395448976 \tabularnewline
23 & 547 & 538.571861209245 & 8.42813879075522 \tabularnewline
24 & 555 & 536.099798974652 & 18.9002010253482 \tabularnewline
25 & 562 & 540.677198491715 & 21.3228015082849 \tabularnewline
26 & 561 & 534.537120698474 & 26.4628793015261 \tabularnewline
27 & 555 & 525.622412542079 & 29.3775874579215 \tabularnewline
28 & 544 & 530.753307402253 & 13.2466925977471 \tabularnewline
29 & 537 & 536.43750966468 & 0.562490335319803 \tabularnewline
30 & 543 & 535.097431871439 & 7.90256812856106 \tabularnewline
31 & 594 & 590.276108910538 & 3.72389108946224 \tabularnewline
32 & 611 & 597.093385195494 & 13.9066148045058 \tabularnewline
33 & 613 & 593.846692597747 & 19.1533074022529 \tabularnewline
34 & 611 & 593.466925977471 & 17.5330740225291 \tabularnewline
35 & 594 & 571.748171145131 & 22.2518288548692 \tabularnewline
36 & 595 & 567.829416312791 & 27.1705836872093 \tabularnewline
37 & 591 & 573.853508427601 & 17.1464915723989 \tabularnewline
38 & 589 & 576.393586220842 & 12.6064137791576 \tabularnewline
39 & 584 & 577.605726248677 & 6.39427375132333 \tabularnewline
40 & 573 & 566.823002533633 & 6.17699746636692 \tabularnewline
41 & 567 & 558.04027881859 & 8.9597211814105 \tabularnewline
42 & 569 & 566.827049209578 & 2.17295079042217 \tabularnewline
43 & 621 & 623.452418846424 & -2.45241884642379 \tabularnewline
44 & 629 & 633.163080326874 & -4.16308032687435 \tabularnewline
45 & 628 & 634.256465522369 & -6.25646552236853 \tabularnewline
46 & 612 & 610.729617338139 & 1.2703826618611 \tabularnewline
47 & 595 & 594.797632896787 & 0.202367103212828 \tabularnewline
48 & 597 & 599.55903365093 & -2.55903365092959 \tabularnewline
49 & 593 & 601.243047972499 & -8.24304797249874 \tabularnewline
50 & 590 & 596.549662777005 & -6.54966277700462 \tabularnewline
51 & 580 & 580.401491631874 & -0.401491631873829 \tabularnewline
52 & 574 & 578.298923503313 & -4.29892350331279 \tabularnewline
53 & 573 & 576.749662777005 & -3.74966277700462 \tabularnewline
54 & 573 & 575.409584983763 & -2.40958498376335 \tabularnewline
55 & 620 & 624.801491631874 & -4.80149163187383 \tabularnewline
56 & 626 & 634.512153112324 & -8.5121531123244 \tabularnewline
57 & 620 & 628.372075319083 & -8.37207531908314 \tabularnewline
58 & 588 & 614.972075319083 & -26.9720753190831 \tabularnewline
59 & 566 & 601.933476073226 & -35.9334760732256 \tabularnewline
60 & 557 & 603.801491631874 & -46.8014916318738 \tabularnewline
\hline
\end{tabular}
%Source: https://freestatistics.org/blog/index.php?pk=5540&T=4

[TABLE]
[ROW][C]Multiple Linear Regression - Actuals, Interpolation, and Residuals[/C][/ROW]
[ROW][C]Time or Index[/C][C]Actuals[/C][C]InterpolationForecast[/C][C]ResidualsPrediction Error[/C][/ROW]
[ROW][C]1[/C][C]476[/C][C]513.385278759115[/C][C]-37.3852787591147[/C][/ROW]
[ROW][C]2[/C][C]475[/C][C]507.245200965873[/C][C]-32.2452009658732[/C][/ROW]
[ROW][C]3[/C][C]470[/C][C]502.670570602719[/C][C]-32.6705706027192[/C][/ROW]
[ROW][C]4[/C][C]461[/C][C]483.207691301193[/C][C]-22.2076913011930[/C][/ROW]
[ROW][C]5[/C][C]455[/C][C]471.531582390655[/C][C]-16.5315823906553[/C][/ROW]
[ROW][C]6[/C][C]456[/C][C]468.744811999667[/C][C]-12.7448119996669[/C][/ROW]
[ROW][C]7[/C][C]517[/C][C]528.263566832007[/C][C]-11.2635668320070[/C][/ROW]
[ROW][C]8[/C][C]525[/C][C]537.974228312458[/C][C]-12.9742283124576[/C][/ROW]
[ROW][C]9[/C][C]523[/C][C]537.620920910205[/C][C]-14.6209209102047[/C][/ROW]
[ROW][C]10[/C][C]519[/C][C]524.220920910205[/C][C]-5.22092091020473[/C][/ROW]
[ROW][C]11[/C][C]509[/C][C]503.948858675612[/C][C]5.0511413243883[/C][/ROW]
[ROW][C]12[/C][C]512[/C][C]508.710259429754[/C][C]3.28974057024589[/C][/ROW]
[ROW][C]13[/C][C]519[/C][C]511.84096634907[/C][C]7.15903365092962[/C][/ROW]
[ROW][C]14[/C][C]517[/C][C]517.274429337806[/C][C]-0.274429337805853[/C][/ROW]
[ROW][C]15[/C][C]510[/C][C]512.699798974652[/C][C]-2.69979897465177[/C][/ROW]
[ROW][C]16[/C][C]509[/C][C]501.917075259608[/C][C]7.08292474039182[/C][/ROW]
[ROW][C]17[/C][C]501[/C][C]490.24096634907[/C][C]10.7590336509296[/C][/ROW]
[ROW][C]18[/C][C]507[/C][C]501.921121935553[/C][C]5.07887806444706[/C][/ROW]
[ROW][C]19[/C][C]569[/C][C]554.206413779158[/C][C]14.7935862208424[/C][/ROW]
[ROW][C]20[/C][C]580[/C][C]568.25715305285[/C][C]11.7428469471505[/C][/ROW]
[ROW][C]21[/C][C]578[/C][C]567.903845650597[/C][C]10.0961543494035[/C][/ROW]
[ROW][C]22[/C][C]565[/C][C]551.610460455102[/C][C]13.3895395448976[/C][/ROW]
[ROW][C]23[/C][C]547[/C][C]538.571861209245[/C][C]8.42813879075522[/C][/ROW]
[ROW][C]24[/C][C]555[/C][C]536.099798974652[/C][C]18.9002010253482[/C][/ROW]
[ROW][C]25[/C][C]562[/C][C]540.677198491715[/C][C]21.3228015082849[/C][/ROW]
[ROW][C]26[/C][C]561[/C][C]534.537120698474[/C][C]26.4628793015261[/C][/ROW]
[ROW][C]27[/C][C]555[/C][C]525.622412542079[/C][C]29.3775874579215[/C][/ROW]
[ROW][C]28[/C][C]544[/C][C]530.753307402253[/C][C]13.2466925977471[/C][/ROW]
[ROW][C]29[/C][C]537[/C][C]536.43750966468[/C][C]0.562490335319803[/C][/ROW]
[ROW][C]30[/C][C]543[/C][C]535.097431871439[/C][C]7.90256812856106[/C][/ROW]
[ROW][C]31[/C][C]594[/C][C]590.276108910538[/C][C]3.72389108946224[/C][/ROW]
[ROW][C]32[/C][C]611[/C][C]597.093385195494[/C][C]13.9066148045058[/C][/ROW]
[ROW][C]33[/C][C]613[/C][C]593.846692597747[/C][C]19.1533074022529[/C][/ROW]
[ROW][C]34[/C][C]611[/C][C]593.466925977471[/C][C]17.5330740225291[/C][/ROW]
[ROW][C]35[/C][C]594[/C][C]571.748171145131[/C][C]22.2518288548692[/C][/ROW]
[ROW][C]36[/C][C]595[/C][C]567.829416312791[/C][C]27.1705836872093[/C][/ROW]
[ROW][C]37[/C][C]591[/C][C]573.853508427601[/C][C]17.1464915723989[/C][/ROW]
[ROW][C]38[/C][C]589[/C][C]576.393586220842[/C][C]12.6064137791576[/C][/ROW]
[ROW][C]39[/C][C]584[/C][C]577.605726248677[/C][C]6.39427375132333[/C][/ROW]
[ROW][C]40[/C][C]573[/C][C]566.823002533633[/C][C]6.17699746636692[/C][/ROW]
[ROW][C]41[/C][C]567[/C][C]558.04027881859[/C][C]8.9597211814105[/C][/ROW]
[ROW][C]42[/C][C]569[/C][C]566.827049209578[/C][C]2.17295079042217[/C][/ROW]
[ROW][C]43[/C][C]621[/C][C]623.452418846424[/C][C]-2.45241884642379[/C][/ROW]
[ROW][C]44[/C][C]629[/C][C]633.163080326874[/C][C]-4.16308032687435[/C][/ROW]
[ROW][C]45[/C][C]628[/C][C]634.256465522369[/C][C]-6.25646552236853[/C][/ROW]
[ROW][C]46[/C][C]612[/C][C]610.729617338139[/C][C]1.2703826618611[/C][/ROW]
[ROW][C]47[/C][C]595[/C][C]594.797632896787[/C][C]0.202367103212828[/C][/ROW]
[ROW][C]48[/C][C]597[/C][C]599.55903365093[/C][C]-2.55903365092959[/C][/ROW]
[ROW][C]49[/C][C]593[/C][C]601.243047972499[/C][C]-8.24304797249874[/C][/ROW]
[ROW][C]50[/C][C]590[/C][C]596.549662777005[/C][C]-6.54966277700462[/C][/ROW]
[ROW][C]51[/C][C]580[/C][C]580.401491631874[/C][C]-0.401491631873829[/C][/ROW]
[ROW][C]52[/C][C]574[/C][C]578.298923503313[/C][C]-4.29892350331279[/C][/ROW]
[ROW][C]53[/C][C]573[/C][C]576.749662777005[/C][C]-3.74966277700462[/C][/ROW]
[ROW][C]54[/C][C]573[/C][C]575.409584983763[/C][C]-2.40958498376335[/C][/ROW]
[ROW][C]55[/C][C]620[/C][C]624.801491631874[/C][C]-4.80149163187383[/C][/ROW]
[ROW][C]56[/C][C]626[/C][C]634.512153112324[/C][C]-8.5121531123244[/C][/ROW]
[ROW][C]57[/C][C]620[/C][C]628.372075319083[/C][C]-8.37207531908314[/C][/ROW]
[ROW][C]58[/C][C]588[/C][C]614.972075319083[/C][C]-26.9720753190831[/C][/ROW]
[ROW][C]59[/C][C]566[/C][C]601.933476073226[/C][C]-35.9334760732256[/C][/ROW]
[ROW][C]60[/C][C]557[/C][C]603.801491631874[/C][C]-46.8014916318738[/C][/ROW]
[/TABLE]
Source: https://freestatistics.org/blog/index.php?pk=5540&T=4

Globally Unique Identifier (entire table): ba.freestatistics.org/blog/index.php?pk=5540&T=4

As an alternative you can also use a QR Code:  

The GUIDs for individual cells are displayed in the table below:

Multiple Linear Regression - Actuals, Interpolation, and Residuals
Time or IndexActualsInterpolationForecastResidualsPrediction Error
1476513.385278759115-37.3852787591147
2475507.245200965873-32.2452009658732
3470502.670570602719-32.6705706027192
4461483.207691301193-22.2076913011930
5455471.531582390655-16.5315823906553
6456468.744811999667-12.7448119996669
7517528.263566832007-11.2635668320070
8525537.974228312458-12.9742283124576
9523537.620920910205-14.6209209102047
10519524.220920910205-5.22092091020473
11509503.9488586756125.0511413243883
12512508.7102594297543.28974057024589
13519511.840966349077.15903365092962
14517517.274429337806-0.274429337805853
15510512.699798974652-2.69979897465177
16509501.9170752596087.08292474039182
17501490.2409663490710.7590336509296
18507501.9211219355535.07887806444706
19569554.20641377915814.7935862208424
20580568.2571530528511.7428469471505
21578567.90384565059710.0961543494035
22565551.61046045510213.3895395448976
23547538.5718612092458.42813879075522
24555536.09979897465218.9002010253482
25562540.67719849171521.3228015082849
26561534.53712069847426.4628793015261
27555525.62241254207929.3775874579215
28544530.75330740225313.2466925977471
29537536.437509664680.562490335319803
30543535.0974318714397.90256812856106
31594590.2761089105383.72389108946224
32611597.09338519549413.9066148045058
33613593.84669259774719.1533074022529
34611593.46692597747117.5330740225291
35594571.74817114513122.2518288548692
36595567.82941631279127.1705836872093
37591573.85350842760117.1464915723989
38589576.39358622084212.6064137791576
39584577.6057262486776.39427375132333
40573566.8230025336336.17699746636692
41567558.040278818598.9597211814105
42569566.8270492095782.17295079042217
43621623.452418846424-2.45241884642379
44629633.163080326874-4.16308032687435
45628634.256465522369-6.25646552236853
46612610.7296173381391.2703826618611
47595594.7976328967870.202367103212828
48597599.55903365093-2.55903365092959
49593601.243047972499-8.24304797249874
50590596.549662777005-6.54966277700462
51580580.401491631874-0.401491631873829
52574578.298923503313-4.29892350331279
53573576.749662777005-3.74966277700462
54573575.409584983763-2.40958498376335
55620624.801491631874-4.80149163187383
56626634.512153112324-8.5121531123244
57620628.372075319083-8.37207531908314
58588614.972075319083-26.9720753190831
59566601.933476073226-35.9334760732256
60557603.801491631874-46.8014916318738


Parameters (Session):
par1 = 1 ; par2 = Include Monthly Dummies ; par3 = Linear Trend ;
Parameters (R input):
par1 = 1 ; par2 = Include Monthly Dummies ; par3 = Linear Trend ;
R code (references can be found in the software module):
library(lattice)
par1 <- as.numeric(par1)
x <- t(y)
k <- length(x[1,])
n <- length(x[,1])
x1 <- cbind(x[,par1], x[,1:k!=par1])
mycolnames <- c(colnames(x)[par1], colnames(x)[1:k!=par1])
colnames(x1) <- mycolnames #colnames(x)[par1]
x <- x1
if (par3 == 'First Differences'){
x2 <- array(0, dim=c(n-1,k), dimnames=list(1:(n-1), paste('(1-B)',colnames(x),sep='')))
for (i in 1:n-1) {
for (j in 1:k) {
x2[i,j] <- x[i+1,j] - x[i,j]
}
}
x <- x2
}
if (par2 == 'Include Monthly Dummies'){
x2 <- array(0, dim=c(n,11), dimnames=list(1:n, paste('M', seq(1:11), sep ='')))
for (i in 1:11){
x2[seq(i,n,12),i] <- 1
}
x <- cbind(x, x2)
}
if (par2 == 'Include Quarterly Dummies'){
x2 <- array(0, dim=c(n,3), dimnames=list(1:n, paste('Q', seq(1:3), sep ='')))
for (i in 1:3){
x2[seq(i,n,4),i] <- 1
}
x <- cbind(x, x2)
}
k <- length(x[1,])
if (par3 == 'Linear Trend'){
x <- cbind(x, c(1:n))
colnames(x)[k+1] <- 't'
}
x
k <- length(x[1,])
df <- as.data.frame(x)
(mylm <- lm(df))
(mysum <- summary(mylm))
bitmap(file='test0.png')
plot(x[,1], type='l', main='Actuals and Interpolation', ylab='value of Actuals and Interpolation (dots)', xlab='time or index')
points(x[,1]-mysum$resid)
grid()
dev.off()
bitmap(file='test1.png')
plot(mysum$resid, type='b', pch=19, main='Residuals', ylab='value of Residuals', xlab='time or index')
grid()
dev.off()
bitmap(file='test2.png')
hist(mysum$resid, main='Residual Histogram', xlab='values of Residuals')
grid()
dev.off()
bitmap(file='test3.png')
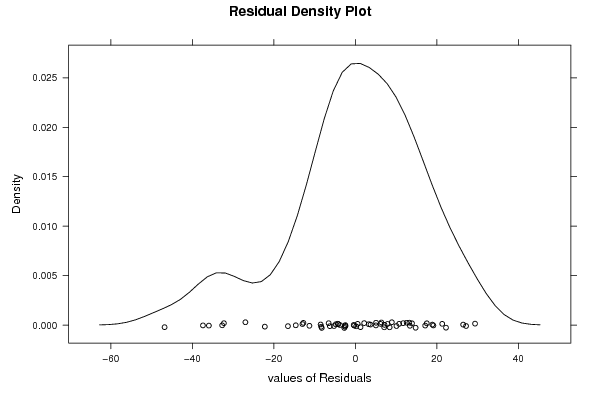
densityplot(~mysum$resid,col='black',main='Residual Density Plot', xlab='values of Residuals')
dev.off()
bitmap(file='test4.png')
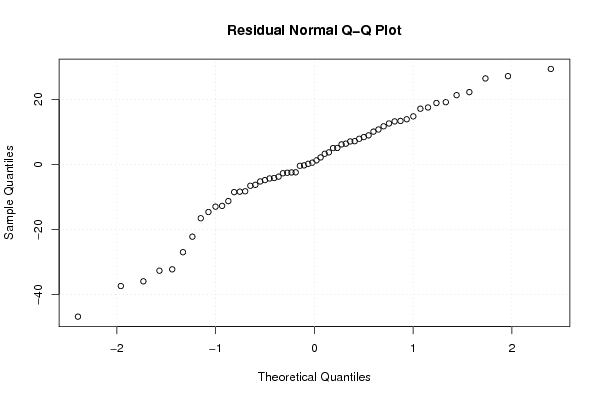
qqnorm(mysum$resid, main='Residual Normal Q-Q Plot')
grid()
dev.off()
(myerror <- as.ts(mysum$resid))
bitmap(file='test5.png')
dum <- cbind(lag(myerror,k=1),myerror)
dum
dum1 <- dum[2:length(myerror),]
dum1
z <- as.data.frame(dum1)
z
plot(z,main=paste('Residual Lag plot, lowess, and regression line'), ylab='values of Residuals', xlab='lagged values of Residuals')
lines(lowess(z))
abline(lm(z))
grid()
dev.off()
bitmap(file='test6.png')
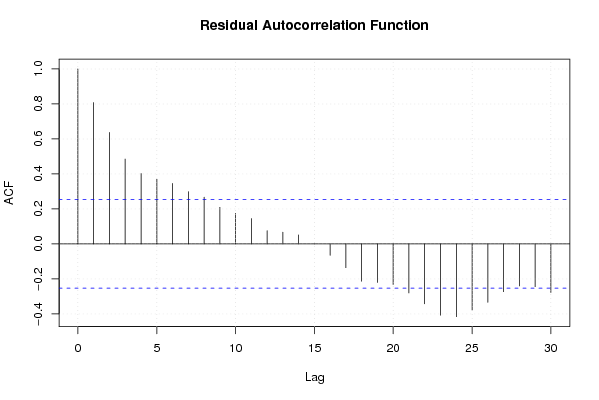
acf(mysum$resid, lag.max=length(mysum$resid)/2, main='Residual Autocorrelation Function')
grid()
dev.off()
bitmap(file='test7.png')
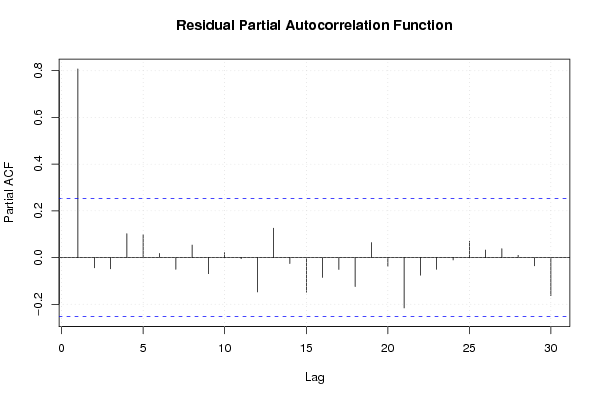
pacf(mysum$resid, lag.max=length(mysum$resid)/2, main='Residual Partial Autocorrelation Function')
grid()
dev.off()
bitmap(file='test8.png')
opar <- par(mfrow = c(2,2), oma = c(0, 0, 1.1, 0))
plot(mylm, las = 1, sub='Residual Diagnostics')
par(opar)
dev.off()
load(file='createtable')
a<-table.start()
a<-table.row.start(a)
a<-table.element(a, 'Multiple Linear Regression - Estimated Regression Equation', 1, TRUE)
a<-table.row.end(a)
myeq <- colnames(x)[1]
myeq <- paste(myeq, '[t] = ', sep='')
for (i in 1:k){
if (mysum$coefficients[i,1] > 0) myeq <- paste(myeq, '+', '')
myeq <- paste(myeq, mysum$coefficients[i,1], sep=' ')
if (rownames(mysum$coefficients)[i] != '(Intercept)') {
myeq <- paste(myeq, rownames(mysum$coefficients)[i], sep='')
if (rownames(mysum$coefficients)[i] != 't') myeq <- paste(myeq, '[t]', sep='')
}
}
myeq <- paste(myeq, ' + e[t]')
a<-table.row.start(a)
a<-table.element(a, myeq)
a<-table.row.end(a)
a<-table.end(a)
table.save(a,file='mytable1.tab')
a<-table.start()
a<-table.row.start(a)
a<-table.element(a,hyperlink('ols1.htm','Multiple Linear Regression - Ordinary Least Squares',''), 6, TRUE)
a<-table.row.end(a)
a<-table.row.start(a)
a<-table.element(a,'Variable',header=TRUE)
a<-table.element(a,'Parameter',header=TRUE)
a<-table.element(a,'S.D.',header=TRUE)
a<-table.element(a,'T-STAT
H0: parameter = 0',header=TRUE)
a<-table.element(a,'2-tail p-value',header=TRUE)
a<-table.element(a,'1-tail p-value',header=TRUE)
a<-table.row.end(a)
for (i in 1:k){
a<-table.row.start(a)
a<-table.element(a,rownames(mysum$coefficients)[i],header=TRUE)
a<-table.element(a,mysum$coefficients[i,1])
a<-table.element(a, round(mysum$coefficients[i,2],6))
a<-table.element(a, round(mysum$coefficients[i,3],4))
a<-table.element(a, round(mysum$coefficients[i,4],6))
a<-table.element(a, round(mysum$coefficients[i,4]/2,6))
a<-table.row.end(a)
}
a<-table.end(a)
table.save(a,file='mytable2.tab')
a<-table.start()
a<-table.row.start(a)
a<-table.element(a, 'Multiple Linear Regression - Regression Statistics', 2, TRUE)
a<-table.row.end(a)
a<-table.row.start(a)
a<-table.element(a, 'Multiple R',1,TRUE)
a<-table.element(a, sqrt(mysum$r.squared))
a<-table.row.end(a)
a<-table.row.start(a)
a<-table.element(a, 'R-squared',1,TRUE)
a<-table.element(a, mysum$r.squared)
a<-table.row.end(a)
a<-table.row.start(a)
a<-table.element(a, 'Adjusted R-squared',1,TRUE)
a<-table.element(a, mysum$adj.r.squared)
a<-table.row.end(a)
a<-table.row.start(a)
a<-table.element(a, 'F-TEST (value)',1,TRUE)
a<-table.element(a, mysum$fstatistic[1])
a<-table.row.end(a)
a<-table.row.start(a)
a<-table.element(a, 'F-TEST (DF numerator)',1,TRUE)
a<-table.element(a, mysum$fstatistic[2])
a<-table.row.end(a)
a<-table.row.start(a)
a<-table.element(a, 'F-TEST (DF denominator)',1,TRUE)
a<-table.element(a, mysum$fstatistic[3])
a<-table.row.end(a)
a<-table.row.start(a)
a<-table.element(a, 'p-value',1,TRUE)
a<-table.element(a, 1-pf(mysum$fstatistic[1],mysum$fstatistic[2],mysum$fstatistic[3]))
a<-table.row.end(a)
a<-table.row.start(a)
a<-table.element(a, 'Multiple Linear Regression - Residual Statistics', 2, TRUE)
a<-table.row.end(a)
a<-table.row.start(a)
a<-table.element(a, 'Residual Standard Deviation',1,TRUE)
a<-table.element(a, mysum$sigma)
a<-table.row.end(a)
a<-table.row.start(a)
a<-table.element(a, 'Sum Squared Residuals',1,TRUE)
a<-table.element(a, sum(myerror*myerror))
a<-table.row.end(a)
a<-table.end(a)
table.save(a,file='mytable3.tab')
a<-table.start()
a<-table.row.start(a)
a<-table.element(a, 'Multiple Linear Regression - Actuals, Interpolation, and Residuals', 4, TRUE)
a<-table.row.end(a)
a<-table.row.start(a)
a<-table.element(a, 'Time or Index', 1, TRUE)
a<-table.element(a, 'Actuals', 1, TRUE)
a<-table.element(a, 'Interpolation
Forecast', 1, TRUE)
a<-table.element(a, 'Residuals
Prediction Error', 1, TRUE)
a<-table.row.end(a)
for (i in 1:n) {
a<-table.row.start(a)
a<-table.element(a,i, 1, TRUE)
a<-table.element(a,x[i])
a<-table.element(a,x[i]-mysum$resid[i])
a<-table.element(a,mysum$resid[i])
a<-table.row.end(a)
}
a<-table.end(a)
table.save(a,file='mytable4.tab')