Free Statistics

of Irreproducible Research!

Author's title

Author*Unverified author*
R Software Modulerwasp_multipleregression.wasp
Title produced by softwareMultiple Regression
Date of computationThu, 15 Nov 2007 09:41:55 -0700
Cite this page as followsStatistical Computations at FreeStatistics.org, Office for Research Development and Education, URL https://freestatistics.org/blog/index.php?v=date/2007/Nov/15/t1195144665824rrcy0wno4oar.htm/, Retrieved Sat, 04 May 2024 11:17:03 +0000
Statistical Computations at FreeStatistics.org, Office for Research Development and Education, URL https://freestatistics.org/blog/index.php?pk=5468, Retrieved Sat, 04 May 2024 11:17:03 +0000
QR Codes:

Original text written by user:
IsPrivate?No (this computation is public)
User-defined keywordsQ3
Estimated Impact251
Family? (F = Feedback message, R = changed R code, M = changed R Module, P = changed Parameters, D = changed Data)
-       [Multiple Regression] [Case: the seatbel...] [2007-11-15 16:41:55] [ac6f409873aab27747ac7f3d36ded223] [Current]
Feedback Forum

Post a new message
Dataseries X:
513	0
503	0
471	0
471	0
476	0
475	0
470	0
461	0
455	0
456	0
517	0
525	0
523	0
519	0
509	0
512	0
519	0
517	0
510	0
509	0
501	0
507	0
569	0
580	0
578	0
565	0
547	0
555	0
562	0
561	0
555	0
544	0
537	0
543	0
594	0
611	0
613	0
611	0
594	0
595	0
591	1
589	1
584	1
573	1
567	1
569	1
621	1
629	1
628	1
612	1
595	1
597	1
593	1
590	1
580	1
574	1
573	1
573	1
620	1
626	1
620	1
588	1
566	1
557	1
561	1
549	1
532	1
526	1
511	1
499	1
555	1
565	1
542	1


Summary of compuational transaction
Raw Inputview raw input (R code)
Raw Outputview raw output of R engine
Computing time7 seconds
R Server'Herman Ole Andreas Wold' @ 193.190.124.10:1001

\begin{tabular}{lllllllll}
\hline
Summary of compuational transaction \tabularnewline
Raw Input & view raw input (R code)  \tabularnewline
Raw Output & view raw output of R engine  \tabularnewline
Computing time & 7 seconds \tabularnewline
R Server & 'Herman Ole Andreas Wold' @ 193.190.124.10:1001 \tabularnewline
\hline
\end{tabular}
%Source: https://freestatistics.org/blog/index.php?pk=5468&T=0

[TABLE]
[ROW][C]Summary of compuational transaction[/C][/ROW]
[ROW][C]Raw Input[/C][C]view raw input (R code) [/C][/ROW]
[ROW][C]Raw Output[/C][C]view raw output of R engine [/C][/ROW]
[ROW][C]Computing time[/C][C]7 seconds[/C][/ROW]
[ROW][C]R Server[/C][C]'Herman Ole Andreas Wold' @ 193.190.124.10:1001[/C][/ROW]
[/TABLE]
Source: https://freestatistics.org/blog/index.php?pk=5468&T=0

Globally Unique Identifier (entire table): ba.freestatistics.org/blog/index.php?pk=5468&T=0

As an alternative you can also use a QR Code:  

The GUIDs for individual cells are displayed in the table below:

Summary of compuational transaction
Raw Inputview raw input (R code)
Raw Outputview raw output of R engine
Computing time7 seconds
R Server'Herman Ole Andreas Wold' @ 193.190.124.10:1001


Multiple Linear Regression - Estimated Regression Equation
y[t] = + 533.950757575758 + 0.462121212121239`x `[t] -8.87752525252522M1[t] -9.79166666666669M2[t] -30.4381313131313M3[t] -30.9179292929293M4[t] -29.8080808080808M5[t] -34.6212121212121M6[t] -44.2676767676768M7[t] -52.9141414141414M8[t] -61.3939393939394M9[t] -62.2070707070707M10[t] -8.6868686868687M11[t] + 1.31313131313131t + e[t]

\begin{tabular}{lllllllll}
\hline
Multiple Linear Regression - Estimated Regression Equation \tabularnewline
y[t] =  +  533.950757575758 +  0.462121212121239`x
`[t] -8.87752525252522M1[t] -9.79166666666669M2[t] -30.4381313131313M3[t] -30.9179292929293M4[t] -29.8080808080808M5[t] -34.6212121212121M6[t] -44.2676767676768M7[t] -52.9141414141414M8[t] -61.3939393939394M9[t] -62.2070707070707M10[t] -8.6868686868687M11[t] +  1.31313131313131t  + e[t] \tabularnewline
\hline
\end{tabular}
%Source: https://freestatistics.org/blog/index.php?pk=5468&T=1

[TABLE]
[ROW][C]Multiple Linear Regression - Estimated Regression Equation[/C][/ROW]
[ROW][C]y[t] =  +  533.950757575758 +  0.462121212121239`x
`[t] -8.87752525252522M1[t] -9.79166666666669M2[t] -30.4381313131313M3[t] -30.9179292929293M4[t] -29.8080808080808M5[t] -34.6212121212121M6[t] -44.2676767676768M7[t] -52.9141414141414M8[t] -61.3939393939394M9[t] -62.2070707070707M10[t] -8.6868686868687M11[t] +  1.31313131313131t  + e[t][/C][/ROW]
[/TABLE]
Source: https://freestatistics.org/blog/index.php?pk=5468&T=1

Globally Unique Identifier (entire table): ba.freestatistics.org/blog/index.php?pk=5468&T=1

As an alternative you can also use a QR Code:  

The GUIDs for individual cells are displayed in the table below:

Multiple Linear Regression - Estimated Regression Equation
y[t] = + 533.950757575758 + 0.462121212121239`x `[t] -8.87752525252522M1[t] -9.79166666666669M2[t] -30.4381313131313M3[t] -30.9179292929293M4[t] -29.8080808080808M5[t] -34.6212121212121M6[t] -44.2676767676768M7[t] -52.9141414141414M8[t] -61.3939393939394M9[t] -62.2070707070707M10[t] -8.6868686868687M11[t] + 1.31313131313131t + e[t]


Multiple Linear Regression - Ordinary Least Squares
VariableParameterS.D.T-STATH0: parameter = 02-tail p-value1-tail p-value
(Intercept)533.95075757575817.09106931.241500
`x `0.46212121212123916.1115840.02870.9772150.488607
M1-8.8775252525252219.023756-0.46670.6424660.321233
M2-9.7916666666666919.812262-0.49420.6229840.311492
M3-30.438131313131319.78737-1.53830.1293310.064666
M4-30.917929292929319.769774-1.56390.123190.061595
M5-29.808080808080819.889394-1.49870.1392850.069643
M6-34.621212121212119.842009-1.74480.0862190.043109
M7-44.267676767676819.801826-2.23550.029180.01459
M8-52.914141414141419.768888-2.67660.0096130.004807
M9-61.393939393939419.743231-3.10960.0028830.001442
M10-62.207070707070719.724885-3.15370.0025350.001268
M11-8.686868686868719.713869-0.44060.6610790.330539
t1.313131313131310.3805523.45060.001040.00052

\begin{tabular}{lllllllll}
\hline
Multiple Linear Regression - Ordinary Least Squares \tabularnewline
Variable & Parameter & S.D. & T-STATH0: parameter = 0 & 2-tail p-value & 1-tail p-value \tabularnewline
(Intercept) & 533.950757575758 & 17.091069 & 31.2415 & 0 & 0 \tabularnewline
`x
` & 0.462121212121239 & 16.111584 & 0.0287 & 0.977215 & 0.488607 \tabularnewline
M1 & -8.87752525252522 & 19.023756 & -0.4667 & 0.642466 & 0.321233 \tabularnewline
M2 & -9.79166666666669 & 19.812262 & -0.4942 & 0.622984 & 0.311492 \tabularnewline
M3 & -30.4381313131313 & 19.78737 & -1.5383 & 0.129331 & 0.064666 \tabularnewline
M4 & -30.9179292929293 & 19.769774 & -1.5639 & 0.12319 & 0.061595 \tabularnewline
M5 & -29.8080808080808 & 19.889394 & -1.4987 & 0.139285 & 0.069643 \tabularnewline
M6 & -34.6212121212121 & 19.842009 & -1.7448 & 0.086219 & 0.043109 \tabularnewline
M7 & -44.2676767676768 & 19.801826 & -2.2355 & 0.02918 & 0.01459 \tabularnewline
M8 & -52.9141414141414 & 19.768888 & -2.6766 & 0.009613 & 0.004807 \tabularnewline
M9 & -61.3939393939394 & 19.743231 & -3.1096 & 0.002883 & 0.001442 \tabularnewline
M10 & -62.2070707070707 & 19.724885 & -3.1537 & 0.002535 & 0.001268 \tabularnewline
M11 & -8.6868686868687 & 19.713869 & -0.4406 & 0.661079 & 0.330539 \tabularnewline
t & 1.31313131313131 & 0.380552 & 3.4506 & 0.00104 & 0.00052 \tabularnewline
\hline
\end{tabular}
%Source: https://freestatistics.org/blog/index.php?pk=5468&T=2

[TABLE]
[ROW][C]Multiple Linear Regression - Ordinary Least Squares[/C][/ROW]
[ROW][C]Variable[/C][C]Parameter[/C][C]S.D.[/C][C]T-STATH0: parameter = 0[/C][C]2-tail p-value[/C][C]1-tail p-value[/C][/ROW]
[ROW][C](Intercept)[/C][C]533.950757575758[/C][C]17.091069[/C][C]31.2415[/C][C]0[/C][C]0[/C][/ROW]
[ROW][C]`x
`[/C][C]0.462121212121239[/C][C]16.111584[/C][C]0.0287[/C][C]0.977215[/C][C]0.488607[/C][/ROW]
[ROW][C]M1[/C][C]-8.87752525252522[/C][C]19.023756[/C][C]-0.4667[/C][C]0.642466[/C][C]0.321233[/C][/ROW]
[ROW][C]M2[/C][C]-9.79166666666669[/C][C]19.812262[/C][C]-0.4942[/C][C]0.622984[/C][C]0.311492[/C][/ROW]
[ROW][C]M3[/C][C]-30.4381313131313[/C][C]19.78737[/C][C]-1.5383[/C][C]0.129331[/C][C]0.064666[/C][/ROW]
[ROW][C]M4[/C][C]-30.9179292929293[/C][C]19.769774[/C][C]-1.5639[/C][C]0.12319[/C][C]0.061595[/C][/ROW]
[ROW][C]M5[/C][C]-29.8080808080808[/C][C]19.889394[/C][C]-1.4987[/C][C]0.139285[/C][C]0.069643[/C][/ROW]
[ROW][C]M6[/C][C]-34.6212121212121[/C][C]19.842009[/C][C]-1.7448[/C][C]0.086219[/C][C]0.043109[/C][/ROW]
[ROW][C]M7[/C][C]-44.2676767676768[/C][C]19.801826[/C][C]-2.2355[/C][C]0.02918[/C][C]0.01459[/C][/ROW]
[ROW][C]M8[/C][C]-52.9141414141414[/C][C]19.768888[/C][C]-2.6766[/C][C]0.009613[/C][C]0.004807[/C][/ROW]
[ROW][C]M9[/C][C]-61.3939393939394[/C][C]19.743231[/C][C]-3.1096[/C][C]0.002883[/C][C]0.001442[/C][/ROW]
[ROW][C]M10[/C][C]-62.2070707070707[/C][C]19.724885[/C][C]-3.1537[/C][C]0.002535[/C][C]0.001268[/C][/ROW]
[ROW][C]M11[/C][C]-8.6868686868687[/C][C]19.713869[/C][C]-0.4406[/C][C]0.661079[/C][C]0.330539[/C][/ROW]
[ROW][C]t[/C][C]1.31313131313131[/C][C]0.380552[/C][C]3.4506[/C][C]0.00104[/C][C]0.00052[/C][/ROW]
[/TABLE]
Source: https://freestatistics.org/blog/index.php?pk=5468&T=2

Globally Unique Identifier (entire table): ba.freestatistics.org/blog/index.php?pk=5468&T=2

As an alternative you can also use a QR Code:  

The GUIDs for individual cells are displayed in the table below:

Multiple Linear Regression - Ordinary Least Squares
VariableParameterS.D.T-STATH0: parameter = 02-tail p-value1-tail p-value
(Intercept)533.95075757575817.09106931.241500
`x `0.46212121212123916.1115840.02870.9772150.488607
M1-8.8775252525252219.023756-0.46670.6424660.321233
M2-9.7916666666666919.812262-0.49420.6229840.311492
M3-30.438131313131319.78737-1.53830.1293310.064666
M4-30.917929292929319.769774-1.56390.123190.061595
M5-29.808080808080819.889394-1.49870.1392850.069643
M6-34.621212121212119.842009-1.74480.0862190.043109
M7-44.267676767676819.801826-2.23550.029180.01459
M8-52.914141414141419.768888-2.67660.0096130.004807
M9-61.393939393939419.743231-3.10960.0028830.001442
M10-62.207070707070719.724885-3.15370.0025350.001268
M11-8.686868686868719.713869-0.44060.6610790.330539
t1.313131313131310.3805523.45060.001040.00052


Multiple Linear Regression - Regression Statistics
Multiple R0.746082785022105
R-squared0.55663952210634
Adjusted R-squared0.458949925282314
F-TEST (value)5.69804298720819
F-TEST (DF numerator)13
F-TEST (DF denominator)59
p-value1.30832598277397e-06
Multiple Linear Regression - Residual Statistics
Residual Standard Deviation34.1390595870493
Sum Squared Residuals68763.047979798

\begin{tabular}{lllllllll}
\hline
Multiple Linear Regression - Regression Statistics \tabularnewline
Multiple R & 0.746082785022105 \tabularnewline
R-squared & 0.55663952210634 \tabularnewline
Adjusted R-squared & 0.458949925282314 \tabularnewline
F-TEST (value) & 5.69804298720819 \tabularnewline
F-TEST (DF numerator) & 13 \tabularnewline
F-TEST (DF denominator) & 59 \tabularnewline
p-value & 1.30832598277397e-06 \tabularnewline
Multiple Linear Regression - Residual Statistics \tabularnewline
Residual Standard Deviation & 34.1390595870493 \tabularnewline
Sum Squared Residuals & 68763.047979798 \tabularnewline
\hline
\end{tabular}
%Source: https://freestatistics.org/blog/index.php?pk=5468&T=3

[TABLE]
[ROW][C]Multiple Linear Regression - Regression Statistics[/C][/ROW]
[ROW][C]Multiple R[/C][C]0.746082785022105[/C][/ROW]
[ROW][C]R-squared[/C][C]0.55663952210634[/C][/ROW]
[ROW][C]Adjusted R-squared[/C][C]0.458949925282314[/C][/ROW]
[ROW][C]F-TEST (value)[/C][C]5.69804298720819[/C][/ROW]
[ROW][C]F-TEST (DF numerator)[/C][C]13[/C][/ROW]
[ROW][C]F-TEST (DF denominator)[/C][C]59[/C][/ROW]
[ROW][C]p-value[/C][C]1.30832598277397e-06[/C][/ROW]
[ROW][C]Multiple Linear Regression - Residual Statistics[/C][/ROW]
[ROW][C]Residual Standard Deviation[/C][C]34.1390595870493[/C][/ROW]
[ROW][C]Sum Squared Residuals[/C][C]68763.047979798[/C][/ROW]
[/TABLE]
Source: https://freestatistics.org/blog/index.php?pk=5468&T=3

Globally Unique Identifier (entire table): ba.freestatistics.org/blog/index.php?pk=5468&T=3

As an alternative you can also use a QR Code:  

The GUIDs for individual cells are displayed in the table below:

Multiple Linear Regression - Regression Statistics
Multiple R0.746082785022105
R-squared0.55663952210634
Adjusted R-squared0.458949925282314
F-TEST (value)5.69804298720819
F-TEST (DF numerator)13
F-TEST (DF denominator)59
p-value1.30832598277397e-06
Multiple Linear Regression - Residual Statistics
Residual Standard Deviation34.1390595870493
Sum Squared Residuals68763.047979798


Multiple Linear Regression - Actuals, Interpolation, and Residuals
Time or IndexActualsInterpolationForecastResidualsPrediction Error
1513526.386363636363-13.3863636363634
2503526.785353535354-23.7853535353536
3471507.45202020202-36.4520202020202
4471508.285353535354-37.2853535353536
5476510.708333333333-34.7083333333334
6475507.208333333333-32.2083333333333
7470498.875-28.875
8461491.541666666667-30.5416666666667
9455484.375-29.375
10456484.875-28.875
11517539.708333333333-22.7083333333334
12525549.708333333333-24.7083333333334
13523542.14393939394-19.1439393939395
14519542.542929292929-23.5429292929293
15509523.209595959596-14.2095959595960
16512524.042929292929-12.0429292929293
17519526.465909090909-7.4659090909091
18517522.965909090909-5.9659090909091
19510514.632575757576-4.63257575757576
20509507.2992424242421.70075757575758
21501500.1325757575760.86742424242424
22507500.6325757575766.36742424242424
23569555.46590909090913.5340909090909
24580565.46590909090914.5340909090909
25578557.90151515151520.0984848484848
26565558.3005050505056.69949494949496
27547538.9671717171728.0328282828283
28555539.80050505050515.1994949494950
29562542.22348484848519.7765151515152
30561538.72348484848522.2765151515152
31555530.39015151515224.6098484848485
32544523.05681818181820.9431818181818
33537515.89015151515221.1098484848485
34543516.39015151515226.6098484848485
35594571.22348484848522.7765151515151
36611581.22348484848529.7765151515152
37613573.65909090909139.3409090909091
38611574.05808080808136.9419191919192
39594554.72474747474739.2752525252525
40595555.55808080808139.4419191919192
41591558.44318181818232.5568181818182
42589554.94318181818234.0568181818182
43584546.60984848484837.3901515151515
44573539.27651515151533.7234848484848
45567532.10984848484834.8901515151515
46569532.60984848484836.3901515151515
47621587.44318181818233.5568181818182
48629597.44318181818231.5568181818182
49628589.87878787878838.1212121212121
50612590.27777777777821.7222222222222
51595570.94444444444424.0555555555556
52597571.77777777777825.2222222222222
53593574.20075757575818.7992424242424
54590570.70075757575819.2992424242424
55580562.36742424242417.6325757575758
56574555.03409090909118.9659090909091
57573547.86742424242425.1325757575758
58573548.36742424242424.6325757575758
59620603.20075757575816.7992424242424
60626613.20075757575812.7992424242424
61620605.63636363636414.3636363636363
62588606.035353535354-18.0353535353535
63566586.70202020202-20.7020202020202
64557587.535353535354-30.5353535353535
65561589.958333333333-28.9583333333333
66549586.458333333333-37.4583333333333
67532578.125-46.125
68526570.791666666667-44.7916666666666
69511563.625-52.625
70499564.125-65.125
71555618.958333333333-63.9583333333333
72565628.958333333333-63.9583333333333
73542621.39393939394-79.3939393939395

\begin{tabular}{lllllllll}
\hline
Multiple Linear Regression - Actuals, Interpolation, and Residuals \tabularnewline
Time or Index & Actuals & InterpolationForecast & ResidualsPrediction Error \tabularnewline
1 & 513 & 526.386363636363 & -13.3863636363634 \tabularnewline
2 & 503 & 526.785353535354 & -23.7853535353536 \tabularnewline
3 & 471 & 507.45202020202 & -36.4520202020202 \tabularnewline
4 & 471 & 508.285353535354 & -37.2853535353536 \tabularnewline
5 & 476 & 510.708333333333 & -34.7083333333334 \tabularnewline
6 & 475 & 507.208333333333 & -32.2083333333333 \tabularnewline
7 & 470 & 498.875 & -28.875 \tabularnewline
8 & 461 & 491.541666666667 & -30.5416666666667 \tabularnewline
9 & 455 & 484.375 & -29.375 \tabularnewline
10 & 456 & 484.875 & -28.875 \tabularnewline
11 & 517 & 539.708333333333 & -22.7083333333334 \tabularnewline
12 & 525 & 549.708333333333 & -24.7083333333334 \tabularnewline
13 & 523 & 542.14393939394 & -19.1439393939395 \tabularnewline
14 & 519 & 542.542929292929 & -23.5429292929293 \tabularnewline
15 & 509 & 523.209595959596 & -14.2095959595960 \tabularnewline
16 & 512 & 524.042929292929 & -12.0429292929293 \tabularnewline
17 & 519 & 526.465909090909 & -7.4659090909091 \tabularnewline
18 & 517 & 522.965909090909 & -5.9659090909091 \tabularnewline
19 & 510 & 514.632575757576 & -4.63257575757576 \tabularnewline
20 & 509 & 507.299242424242 & 1.70075757575758 \tabularnewline
21 & 501 & 500.132575757576 & 0.86742424242424 \tabularnewline
22 & 507 & 500.632575757576 & 6.36742424242424 \tabularnewline
23 & 569 & 555.465909090909 & 13.5340909090909 \tabularnewline
24 & 580 & 565.465909090909 & 14.5340909090909 \tabularnewline
25 & 578 & 557.901515151515 & 20.0984848484848 \tabularnewline
26 & 565 & 558.300505050505 & 6.69949494949496 \tabularnewline
27 & 547 & 538.967171717172 & 8.0328282828283 \tabularnewline
28 & 555 & 539.800505050505 & 15.1994949494950 \tabularnewline
29 & 562 & 542.223484848485 & 19.7765151515152 \tabularnewline
30 & 561 & 538.723484848485 & 22.2765151515152 \tabularnewline
31 & 555 & 530.390151515152 & 24.6098484848485 \tabularnewline
32 & 544 & 523.056818181818 & 20.9431818181818 \tabularnewline
33 & 537 & 515.890151515152 & 21.1098484848485 \tabularnewline
34 & 543 & 516.390151515152 & 26.6098484848485 \tabularnewline
35 & 594 & 571.223484848485 & 22.7765151515151 \tabularnewline
36 & 611 & 581.223484848485 & 29.7765151515152 \tabularnewline
37 & 613 & 573.659090909091 & 39.3409090909091 \tabularnewline
38 & 611 & 574.058080808081 & 36.9419191919192 \tabularnewline
39 & 594 & 554.724747474747 & 39.2752525252525 \tabularnewline
40 & 595 & 555.558080808081 & 39.4419191919192 \tabularnewline
41 & 591 & 558.443181818182 & 32.5568181818182 \tabularnewline
42 & 589 & 554.943181818182 & 34.0568181818182 \tabularnewline
43 & 584 & 546.609848484848 & 37.3901515151515 \tabularnewline
44 & 573 & 539.276515151515 & 33.7234848484848 \tabularnewline
45 & 567 & 532.109848484848 & 34.8901515151515 \tabularnewline
46 & 569 & 532.609848484848 & 36.3901515151515 \tabularnewline
47 & 621 & 587.443181818182 & 33.5568181818182 \tabularnewline
48 & 629 & 597.443181818182 & 31.5568181818182 \tabularnewline
49 & 628 & 589.878787878788 & 38.1212121212121 \tabularnewline
50 & 612 & 590.277777777778 & 21.7222222222222 \tabularnewline
51 & 595 & 570.944444444444 & 24.0555555555556 \tabularnewline
52 & 597 & 571.777777777778 & 25.2222222222222 \tabularnewline
53 & 593 & 574.200757575758 & 18.7992424242424 \tabularnewline
54 & 590 & 570.700757575758 & 19.2992424242424 \tabularnewline
55 & 580 & 562.367424242424 & 17.6325757575758 \tabularnewline
56 & 574 & 555.034090909091 & 18.9659090909091 \tabularnewline
57 & 573 & 547.867424242424 & 25.1325757575758 \tabularnewline
58 & 573 & 548.367424242424 & 24.6325757575758 \tabularnewline
59 & 620 & 603.200757575758 & 16.7992424242424 \tabularnewline
60 & 626 & 613.200757575758 & 12.7992424242424 \tabularnewline
61 & 620 & 605.636363636364 & 14.3636363636363 \tabularnewline
62 & 588 & 606.035353535354 & -18.0353535353535 \tabularnewline
63 & 566 & 586.70202020202 & -20.7020202020202 \tabularnewline
64 & 557 & 587.535353535354 & -30.5353535353535 \tabularnewline
65 & 561 & 589.958333333333 & -28.9583333333333 \tabularnewline
66 & 549 & 586.458333333333 & -37.4583333333333 \tabularnewline
67 & 532 & 578.125 & -46.125 \tabularnewline
68 & 526 & 570.791666666667 & -44.7916666666666 \tabularnewline
69 & 511 & 563.625 & -52.625 \tabularnewline
70 & 499 & 564.125 & -65.125 \tabularnewline
71 & 555 & 618.958333333333 & -63.9583333333333 \tabularnewline
72 & 565 & 628.958333333333 & -63.9583333333333 \tabularnewline
73 & 542 & 621.39393939394 & -79.3939393939395 \tabularnewline
\hline
\end{tabular}
%Source: https://freestatistics.org/blog/index.php?pk=5468&T=4

[TABLE]
[ROW][C]Multiple Linear Regression - Actuals, Interpolation, and Residuals[/C][/ROW]
[ROW][C]Time or Index[/C][C]Actuals[/C][C]InterpolationForecast[/C][C]ResidualsPrediction Error[/C][/ROW]
[ROW][C]1[/C][C]513[/C][C]526.386363636363[/C][C]-13.3863636363634[/C][/ROW]
[ROW][C]2[/C][C]503[/C][C]526.785353535354[/C][C]-23.7853535353536[/C][/ROW]
[ROW][C]3[/C][C]471[/C][C]507.45202020202[/C][C]-36.4520202020202[/C][/ROW]
[ROW][C]4[/C][C]471[/C][C]508.285353535354[/C][C]-37.2853535353536[/C][/ROW]
[ROW][C]5[/C][C]476[/C][C]510.708333333333[/C][C]-34.7083333333334[/C][/ROW]
[ROW][C]6[/C][C]475[/C][C]507.208333333333[/C][C]-32.2083333333333[/C][/ROW]
[ROW][C]7[/C][C]470[/C][C]498.875[/C][C]-28.875[/C][/ROW]
[ROW][C]8[/C][C]461[/C][C]491.541666666667[/C][C]-30.5416666666667[/C][/ROW]
[ROW][C]9[/C][C]455[/C][C]484.375[/C][C]-29.375[/C][/ROW]
[ROW][C]10[/C][C]456[/C][C]484.875[/C][C]-28.875[/C][/ROW]
[ROW][C]11[/C][C]517[/C][C]539.708333333333[/C][C]-22.7083333333334[/C][/ROW]
[ROW][C]12[/C][C]525[/C][C]549.708333333333[/C][C]-24.7083333333334[/C][/ROW]
[ROW][C]13[/C][C]523[/C][C]542.14393939394[/C][C]-19.1439393939395[/C][/ROW]
[ROW][C]14[/C][C]519[/C][C]542.542929292929[/C][C]-23.5429292929293[/C][/ROW]
[ROW][C]15[/C][C]509[/C][C]523.209595959596[/C][C]-14.2095959595960[/C][/ROW]
[ROW][C]16[/C][C]512[/C][C]524.042929292929[/C][C]-12.0429292929293[/C][/ROW]
[ROW][C]17[/C][C]519[/C][C]526.465909090909[/C][C]-7.4659090909091[/C][/ROW]
[ROW][C]18[/C][C]517[/C][C]522.965909090909[/C][C]-5.9659090909091[/C][/ROW]
[ROW][C]19[/C][C]510[/C][C]514.632575757576[/C][C]-4.63257575757576[/C][/ROW]
[ROW][C]20[/C][C]509[/C][C]507.299242424242[/C][C]1.70075757575758[/C][/ROW]
[ROW][C]21[/C][C]501[/C][C]500.132575757576[/C][C]0.86742424242424[/C][/ROW]
[ROW][C]22[/C][C]507[/C][C]500.632575757576[/C][C]6.36742424242424[/C][/ROW]
[ROW][C]23[/C][C]569[/C][C]555.465909090909[/C][C]13.5340909090909[/C][/ROW]
[ROW][C]24[/C][C]580[/C][C]565.465909090909[/C][C]14.5340909090909[/C][/ROW]
[ROW][C]25[/C][C]578[/C][C]557.901515151515[/C][C]20.0984848484848[/C][/ROW]
[ROW][C]26[/C][C]565[/C][C]558.300505050505[/C][C]6.69949494949496[/C][/ROW]
[ROW][C]27[/C][C]547[/C][C]538.967171717172[/C][C]8.0328282828283[/C][/ROW]
[ROW][C]28[/C][C]555[/C][C]539.800505050505[/C][C]15.1994949494950[/C][/ROW]
[ROW][C]29[/C][C]562[/C][C]542.223484848485[/C][C]19.7765151515152[/C][/ROW]
[ROW][C]30[/C][C]561[/C][C]538.723484848485[/C][C]22.2765151515152[/C][/ROW]
[ROW][C]31[/C][C]555[/C][C]530.390151515152[/C][C]24.6098484848485[/C][/ROW]
[ROW][C]32[/C][C]544[/C][C]523.056818181818[/C][C]20.9431818181818[/C][/ROW]
[ROW][C]33[/C][C]537[/C][C]515.890151515152[/C][C]21.1098484848485[/C][/ROW]
[ROW][C]34[/C][C]543[/C][C]516.390151515152[/C][C]26.6098484848485[/C][/ROW]
[ROW][C]35[/C][C]594[/C][C]571.223484848485[/C][C]22.7765151515151[/C][/ROW]
[ROW][C]36[/C][C]611[/C][C]581.223484848485[/C][C]29.7765151515152[/C][/ROW]
[ROW][C]37[/C][C]613[/C][C]573.659090909091[/C][C]39.3409090909091[/C][/ROW]
[ROW][C]38[/C][C]611[/C][C]574.058080808081[/C][C]36.9419191919192[/C][/ROW]
[ROW][C]39[/C][C]594[/C][C]554.724747474747[/C][C]39.2752525252525[/C][/ROW]
[ROW][C]40[/C][C]595[/C][C]555.558080808081[/C][C]39.4419191919192[/C][/ROW]
[ROW][C]41[/C][C]591[/C][C]558.443181818182[/C][C]32.5568181818182[/C][/ROW]
[ROW][C]42[/C][C]589[/C][C]554.943181818182[/C][C]34.0568181818182[/C][/ROW]
[ROW][C]43[/C][C]584[/C][C]546.609848484848[/C][C]37.3901515151515[/C][/ROW]
[ROW][C]44[/C][C]573[/C][C]539.276515151515[/C][C]33.7234848484848[/C][/ROW]
[ROW][C]45[/C][C]567[/C][C]532.109848484848[/C][C]34.8901515151515[/C][/ROW]
[ROW][C]46[/C][C]569[/C][C]532.609848484848[/C][C]36.3901515151515[/C][/ROW]
[ROW][C]47[/C][C]621[/C][C]587.443181818182[/C][C]33.5568181818182[/C][/ROW]
[ROW][C]48[/C][C]629[/C][C]597.443181818182[/C][C]31.5568181818182[/C][/ROW]
[ROW][C]49[/C][C]628[/C][C]589.878787878788[/C][C]38.1212121212121[/C][/ROW]
[ROW][C]50[/C][C]612[/C][C]590.277777777778[/C][C]21.7222222222222[/C][/ROW]
[ROW][C]51[/C][C]595[/C][C]570.944444444444[/C][C]24.0555555555556[/C][/ROW]
[ROW][C]52[/C][C]597[/C][C]571.777777777778[/C][C]25.2222222222222[/C][/ROW]
[ROW][C]53[/C][C]593[/C][C]574.200757575758[/C][C]18.7992424242424[/C][/ROW]
[ROW][C]54[/C][C]590[/C][C]570.700757575758[/C][C]19.2992424242424[/C][/ROW]
[ROW][C]55[/C][C]580[/C][C]562.367424242424[/C][C]17.6325757575758[/C][/ROW]
[ROW][C]56[/C][C]574[/C][C]555.034090909091[/C][C]18.9659090909091[/C][/ROW]
[ROW][C]57[/C][C]573[/C][C]547.867424242424[/C][C]25.1325757575758[/C][/ROW]
[ROW][C]58[/C][C]573[/C][C]548.367424242424[/C][C]24.6325757575758[/C][/ROW]
[ROW][C]59[/C][C]620[/C][C]603.200757575758[/C][C]16.7992424242424[/C][/ROW]
[ROW][C]60[/C][C]626[/C][C]613.200757575758[/C][C]12.7992424242424[/C][/ROW]
[ROW][C]61[/C][C]620[/C][C]605.636363636364[/C][C]14.3636363636363[/C][/ROW]
[ROW][C]62[/C][C]588[/C][C]606.035353535354[/C][C]-18.0353535353535[/C][/ROW]
[ROW][C]63[/C][C]566[/C][C]586.70202020202[/C][C]-20.7020202020202[/C][/ROW]
[ROW][C]64[/C][C]557[/C][C]587.535353535354[/C][C]-30.5353535353535[/C][/ROW]
[ROW][C]65[/C][C]561[/C][C]589.958333333333[/C][C]-28.9583333333333[/C][/ROW]
[ROW][C]66[/C][C]549[/C][C]586.458333333333[/C][C]-37.4583333333333[/C][/ROW]
[ROW][C]67[/C][C]532[/C][C]578.125[/C][C]-46.125[/C][/ROW]
[ROW][C]68[/C][C]526[/C][C]570.791666666667[/C][C]-44.7916666666666[/C][/ROW]
[ROW][C]69[/C][C]511[/C][C]563.625[/C][C]-52.625[/C][/ROW]
[ROW][C]70[/C][C]499[/C][C]564.125[/C][C]-65.125[/C][/ROW]
[ROW][C]71[/C][C]555[/C][C]618.958333333333[/C][C]-63.9583333333333[/C][/ROW]
[ROW][C]72[/C][C]565[/C][C]628.958333333333[/C][C]-63.9583333333333[/C][/ROW]
[ROW][C]73[/C][C]542[/C][C]621.39393939394[/C][C]-79.3939393939395[/C][/ROW]
[/TABLE]
Source: https://freestatistics.org/blog/index.php?pk=5468&T=4

Globally Unique Identifier (entire table): ba.freestatistics.org/blog/index.php?pk=5468&T=4

As an alternative you can also use a QR Code:  

The GUIDs for individual cells are displayed in the table below:

Multiple Linear Regression - Actuals, Interpolation, and Residuals
Time or IndexActualsInterpolationForecastResidualsPrediction Error
1513526.386363636363-13.3863636363634
2503526.785353535354-23.7853535353536
3471507.45202020202-36.4520202020202
4471508.285353535354-37.2853535353536
5476510.708333333333-34.7083333333334
6475507.208333333333-32.2083333333333
7470498.875-28.875
8461491.541666666667-30.5416666666667
9455484.375-29.375
10456484.875-28.875
11517539.708333333333-22.7083333333334
12525549.708333333333-24.7083333333334
13523542.14393939394-19.1439393939395
14519542.542929292929-23.5429292929293
15509523.209595959596-14.2095959595960
16512524.042929292929-12.0429292929293
17519526.465909090909-7.4659090909091
18517522.965909090909-5.9659090909091
19510514.632575757576-4.63257575757576
20509507.2992424242421.70075757575758
21501500.1325757575760.86742424242424
22507500.6325757575766.36742424242424
23569555.46590909090913.5340909090909
24580565.46590909090914.5340909090909
25578557.90151515151520.0984848484848
26565558.3005050505056.69949494949496
27547538.9671717171728.0328282828283
28555539.80050505050515.1994949494950
29562542.22348484848519.7765151515152
30561538.72348484848522.2765151515152
31555530.39015151515224.6098484848485
32544523.05681818181820.9431818181818
33537515.89015151515221.1098484848485
34543516.39015151515226.6098484848485
35594571.22348484848522.7765151515151
36611581.22348484848529.7765151515152
37613573.65909090909139.3409090909091
38611574.05808080808136.9419191919192
39594554.72474747474739.2752525252525
40595555.55808080808139.4419191919192
41591558.44318181818232.5568181818182
42589554.94318181818234.0568181818182
43584546.60984848484837.3901515151515
44573539.27651515151533.7234848484848
45567532.10984848484834.8901515151515
46569532.60984848484836.3901515151515
47621587.44318181818233.5568181818182
48629597.44318181818231.5568181818182
49628589.87878787878838.1212121212121
50612590.27777777777821.7222222222222
51595570.94444444444424.0555555555556
52597571.77777777777825.2222222222222
53593574.20075757575818.7992424242424
54590570.70075757575819.2992424242424
55580562.36742424242417.6325757575758
56574555.03409090909118.9659090909091
57573547.86742424242425.1325757575758
58573548.36742424242424.6325757575758
59620603.20075757575816.7992424242424
60626613.20075757575812.7992424242424
61620605.63636363636414.3636363636363
62588606.035353535354-18.0353535353535
63566586.70202020202-20.7020202020202
64557587.535353535354-30.5353535353535
65561589.958333333333-28.9583333333333
66549586.458333333333-37.4583333333333
67532578.125-46.125
68526570.791666666667-44.7916666666666
69511563.625-52.625
70499564.125-65.125
71555618.958333333333-63.9583333333333
72565628.958333333333-63.9583333333333
73542621.39393939394-79.3939393939395


Parameters (Session):
par1 = 1 ; par2 = Include Monthly Dummies ; par3 = Linear Trend ;
Parameters (R input):
par1 = 1 ; par2 = Include Monthly Dummies ; par3 = Linear Trend ;
R code (references can be found in the software module):
library(lattice)
par1 <- as.numeric(par1)
x <- t(y)
k <- length(x[1,])
n <- length(x[,1])
x1 <- cbind(x[,par1], x[,1:k!=par1])
mycolnames <- c(colnames(x)[par1], colnames(x)[1:k!=par1])
colnames(x1) <- mycolnames #colnames(x)[par1]
x <- x1
if (par3 == 'First Differences'){
x2 <- array(0, dim=c(n-1,k), dimnames=list(1:(n-1), paste('(1-B)',colnames(x),sep='')))
for (i in 1:n-1) {
for (j in 1:k) {
x2[i,j] <- x[i+1,j] - x[i,j]
}
}
x <- x2
}
if (par2 == 'Include Monthly Dummies'){
x2 <- array(0, dim=c(n,11), dimnames=list(1:n, paste('M', seq(1:11), sep ='')))
for (i in 1:11){
x2[seq(i,n,12),i] <- 1
}
x <- cbind(x, x2)
}
if (par2 == 'Include Quarterly Dummies'){
x2 <- array(0, dim=c(n,3), dimnames=list(1:n, paste('Q', seq(1:3), sep ='')))
for (i in 1:3){
x2[seq(i,n,4),i] <- 1
}
x <- cbind(x, x2)
}
k <- length(x[1,])
if (par3 == 'Linear Trend'){
x <- cbind(x, c(1:n))
colnames(x)[k+1] <- 't'
}
x
k <- length(x[1,])
df <- as.data.frame(x)
(mylm <- lm(df))
(mysum <- summary(mylm))
bitmap(file='test0.png')
plot(x[,1], type='l', main='Actuals and Interpolation', ylab='value of Actuals and Interpolation (dots)', xlab='time or index')
points(x[,1]-mysum$resid)
grid()
dev.off()
bitmap(file='test1.png')
plot(mysum$resid, type='b', pch=19, main='Residuals', ylab='value of Residuals', xlab='time or index')
grid()
dev.off()
bitmap(file='test2.png')
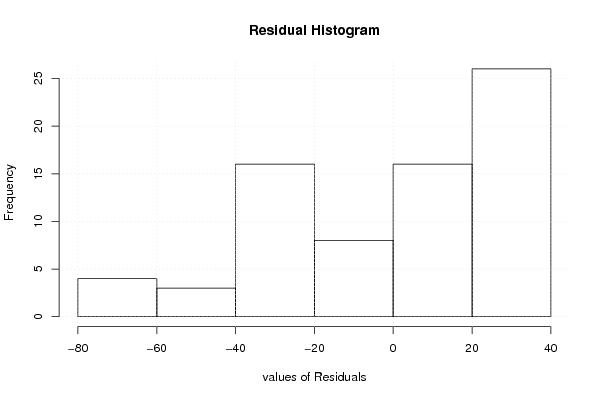
hist(mysum$resid, main='Residual Histogram', xlab='values of Residuals')
grid()
dev.off()
bitmap(file='test3.png')
densityplot(~mysum$resid,col='black',main='Residual Density Plot', xlab='values of Residuals')
dev.off()
bitmap(file='test4.png')
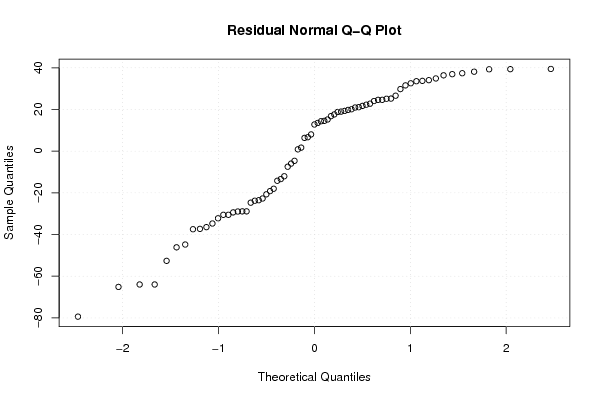
qqnorm(mysum$resid, main='Residual Normal Q-Q Plot')
grid()
dev.off()
(myerror <- as.ts(mysum$resid))
bitmap(file='test5.png')
dum <- cbind(lag(myerror,k=1),myerror)
dum
dum1 <- dum[2:length(myerror),]
dum1
z <- as.data.frame(dum1)
z
plot(z,main=paste('Residual Lag plot, lowess, and regression line'), ylab='values of Residuals', xlab='lagged values of Residuals')
lines(lowess(z))
abline(lm(z))
grid()
dev.off()
bitmap(file='test6.png')
acf(mysum$resid, lag.max=length(mysum$resid)/2, main='Residual Autocorrelation Function')
grid()
dev.off()
bitmap(file='test7.png')
pacf(mysum$resid, lag.max=length(mysum$resid)/2, main='Residual Partial Autocorrelation Function')
grid()
dev.off()
bitmap(file='test8.png')
opar <- par(mfrow = c(2,2), oma = c(0, 0, 1.1, 0))
plot(mylm, las = 1, sub='Residual Diagnostics')
par(opar)
dev.off()
load(file='createtable')
a<-table.start()
a<-table.row.start(a)
a<-table.element(a, 'Multiple Linear Regression - Estimated Regression Equation', 1, TRUE)
a<-table.row.end(a)
myeq <- colnames(x)[1]
myeq <- paste(myeq, '[t] = ', sep='')
for (i in 1:k){
if (mysum$coefficients[i,1] > 0) myeq <- paste(myeq, '+', '')
myeq <- paste(myeq, mysum$coefficients[i,1], sep=' ')
if (rownames(mysum$coefficients)[i] != '(Intercept)') {
myeq <- paste(myeq, rownames(mysum$coefficients)[i], sep='')
if (rownames(mysum$coefficients)[i] != 't') myeq <- paste(myeq, '[t]', sep='')
}
}
myeq <- paste(myeq, ' + e[t]')
a<-table.row.start(a)
a<-table.element(a, myeq)
a<-table.row.end(a)
a<-table.end(a)
table.save(a,file='mytable1.tab')
a<-table.start()
a<-table.row.start(a)
a<-table.element(a,hyperlink('ols1.htm','Multiple Linear Regression - Ordinary Least Squares',''), 6, TRUE)
a<-table.row.end(a)
a<-table.row.start(a)
a<-table.element(a,'Variable',header=TRUE)
a<-table.element(a,'Parameter',header=TRUE)
a<-table.element(a,'S.D.',header=TRUE)
a<-table.element(a,'T-STAT
H0: parameter = 0',header=TRUE)
a<-table.element(a,'2-tail p-value',header=TRUE)
a<-table.element(a,'1-tail p-value',header=TRUE)
a<-table.row.end(a)
for (i in 1:k){
a<-table.row.start(a)
a<-table.element(a,rownames(mysum$coefficients)[i],header=TRUE)
a<-table.element(a,mysum$coefficients[i,1])
a<-table.element(a, round(mysum$coefficients[i,2],6))
a<-table.element(a, round(mysum$coefficients[i,3],4))
a<-table.element(a, round(mysum$coefficients[i,4],6))
a<-table.element(a, round(mysum$coefficients[i,4]/2,6))
a<-table.row.end(a)
}
a<-table.end(a)
table.save(a,file='mytable2.tab')
a<-table.start()
a<-table.row.start(a)
a<-table.element(a, 'Multiple Linear Regression - Regression Statistics', 2, TRUE)
a<-table.row.end(a)
a<-table.row.start(a)
a<-table.element(a, 'Multiple R',1,TRUE)
a<-table.element(a, sqrt(mysum$r.squared))
a<-table.row.end(a)
a<-table.row.start(a)
a<-table.element(a, 'R-squared',1,TRUE)
a<-table.element(a, mysum$r.squared)
a<-table.row.end(a)
a<-table.row.start(a)
a<-table.element(a, 'Adjusted R-squared',1,TRUE)
a<-table.element(a, mysum$adj.r.squared)
a<-table.row.end(a)
a<-table.row.start(a)
a<-table.element(a, 'F-TEST (value)',1,TRUE)
a<-table.element(a, mysum$fstatistic[1])
a<-table.row.end(a)
a<-table.row.start(a)
a<-table.element(a, 'F-TEST (DF numerator)',1,TRUE)
a<-table.element(a, mysum$fstatistic[2])
a<-table.row.end(a)
a<-table.row.start(a)
a<-table.element(a, 'F-TEST (DF denominator)',1,TRUE)
a<-table.element(a, mysum$fstatistic[3])
a<-table.row.end(a)
a<-table.row.start(a)
a<-table.element(a, 'p-value',1,TRUE)
a<-table.element(a, 1-pf(mysum$fstatistic[1],mysum$fstatistic[2],mysum$fstatistic[3]))
a<-table.row.end(a)
a<-table.row.start(a)
a<-table.element(a, 'Multiple Linear Regression - Residual Statistics', 2, TRUE)
a<-table.row.end(a)
a<-table.row.start(a)
a<-table.element(a, 'Residual Standard Deviation',1,TRUE)
a<-table.element(a, mysum$sigma)
a<-table.row.end(a)
a<-table.row.start(a)
a<-table.element(a, 'Sum Squared Residuals',1,TRUE)
a<-table.element(a, sum(myerror*myerror))
a<-table.row.end(a)
a<-table.end(a)
table.save(a,file='mytable3.tab')
a<-table.start()
a<-table.row.start(a)
a<-table.element(a, 'Multiple Linear Regression - Actuals, Interpolation, and Residuals', 4, TRUE)
a<-table.row.end(a)
a<-table.row.start(a)
a<-table.element(a, 'Time or Index', 1, TRUE)
a<-table.element(a, 'Actuals', 1, TRUE)
a<-table.element(a, 'Interpolation
Forecast', 1, TRUE)
a<-table.element(a, 'Residuals
Prediction Error', 1, TRUE)
a<-table.row.end(a)
for (i in 1:n) {
a<-table.row.start(a)
a<-table.element(a,i, 1, TRUE)
a<-table.element(a,x[i])
a<-table.element(a,x[i]-mysum$resid[i])
a<-table.element(a,mysum$resid[i])
a<-table.row.end(a)
}
a<-table.end(a)
table.save(a,file='mytable4.tab')