Free Statistics

of Irreproducible Research!

Author's title

Author*Unverified author*
R Software Modulerwasp_multipleregression.wasp
Title produced by softwareMultiple Regression
Date of computationThu, 15 Nov 2007 08:42:40 -0700
Cite this page as followsStatistical Computations at FreeStatistics.org, Office for Research Development and Education, URL https://freestatistics.org/blog/index.php?v=date/2007/Nov/15/t1195141023b8e06nn5g4zxywl.htm/, Retrieved Sat, 04 May 2024 12:15:50 +0000
Statistical Computations at FreeStatistics.org, Office for Research Development and Education, URL https://freestatistics.org/blog/index.php?pk=14461, Retrieved Sat, 04 May 2024 12:15:50 +0000
QR Codes:

Original text written by user:
IsPrivate?No (this computation is public)
User-defined keywordsW9Q3G7
Estimated Impact191
Family? (F = Feedback message, R = changed R code, M = changed R Module, P = changed Parameters, D = changed Data)
-       [Multiple Regression] [multiple regressi...] [2007-11-15 15:42:40] [923db922542fbe09e7ff87bb31b2f310] [Current]
Feedback Forum

Post a new message
Dataseries X:
140	1
132	0
117	0
114	1
113	1
110	1
107	0
103	0
98	0
98	1
137	1
148	0
147	0
139	1
130	0
128	1
127	1
123	1
118	0
114	1
108	0
111	1
151	1
159	1
158	0
148	0
138	0
137	1
136	1
133	1
126	1
120	0
114	0
116	1
153	1
162	1
161	1
149	1
139	0
135	1
130	1
127	1
122	0
117	0
112	0
113	1
149	1
157	1
157	0
147	0
137	0
132	1
125	1
123	0
117	0
114	0
111	1
112	0
144	1
150	1
149	0
134	0
123	0
116	0
117	1
111	0
105	0
102	0
95	0
93	0
124	1
130	1
124	0


Summary of compuational transaction
Raw Inputview raw input (R code)
Raw Outputview raw output of R engine
Computing time3 seconds
R Server'Gwilym Jenkins' @ 72.249.127.135

\begin{tabular}{lllllllll}
\hline
Summary of compuational transaction \tabularnewline
Raw Input & view raw input (R code)  \tabularnewline
Raw Output & view raw output of R engine  \tabularnewline
Computing time & 3 seconds \tabularnewline
R Server & 'Gwilym Jenkins' @ 72.249.127.135 \tabularnewline
\hline
\end{tabular}
%Source: https://freestatistics.org/blog/index.php?pk=14461&T=0

[TABLE]
[ROW][C]Summary of compuational transaction[/C][/ROW]
[ROW][C]Raw Input[/C][C]view raw input (R code) [/C][/ROW]
[ROW][C]Raw Output[/C][C]view raw output of R engine [/C][/ROW]
[ROW][C]Computing time[/C][C]3 seconds[/C][/ROW]
[ROW][C]R Server[/C][C]'Gwilym Jenkins' @ 72.249.127.135[/C][/ROW]
[/TABLE]
Source: https://freestatistics.org/blog/index.php?pk=14461&T=0

Globally Unique Identifier (entire table): ba.freestatistics.org/blog/index.php?pk=14461&T=0

As an alternative you can also use a QR Code:  

The GUIDs for individual cells are displayed in the table below:

Summary of compuational transaction
Raw Inputview raw input (R code)
Raw Outputview raw output of R engine
Computing time3 seconds
R Server'Gwilym Jenkins' @ 72.249.127.135


Multiple Linear Regression - Estimated Regression Equation
Y[t] = + 146.931317512971 + 5.83579994896655X[t] + 0.101213765254304M1[t] -6.77126291530474M2[t] -15.6404133100038M3[t] -24.1513303118304M4[t] -27.4383806810127M5[t] -28.9741977423784M6[t] -31.3707148122497M7[t] -35.5184651899375M8[t] -40.832882234292M9[t] -42.8985325864632M10[t] -8.99154961380658M11[t] -0.0189162889788047t + e[t]

\begin{tabular}{lllllllll}
\hline
Multiple Linear Regression - Estimated Regression Equation \tabularnewline
Y[t] =  +  146.931317512971 +  5.83579994896655X[t] +  0.101213765254304M1[t] -6.77126291530474M2[t] -15.6404133100038M3[t] -24.1513303118304M4[t] -27.4383806810127M5[t] -28.9741977423784M6[t] -31.3707148122497M7[t] -35.5184651899375M8[t] -40.832882234292M9[t] -42.8985325864632M10[t] -8.99154961380658M11[t] -0.0189162889788047t  + e[t] \tabularnewline
\hline
\end{tabular}
%Source: https://freestatistics.org/blog/index.php?pk=14461&T=1

[TABLE]
[ROW][C]Multiple Linear Regression - Estimated Regression Equation[/C][/ROW]
[ROW][C]Y[t] =  +  146.931317512971 +  5.83579994896655X[t] +  0.101213765254304M1[t] -6.77126291530474M2[t] -15.6404133100038M3[t] -24.1513303118304M4[t] -27.4383806810127M5[t] -28.9741977423784M6[t] -31.3707148122497M7[t] -35.5184651899375M8[t] -40.832882234292M9[t] -42.8985325864632M10[t] -8.99154961380658M11[t] -0.0189162889788047t  + e[t][/C][/ROW]
[/TABLE]
Source: https://freestatistics.org/blog/index.php?pk=14461&T=1

Globally Unique Identifier (entire table): ba.freestatistics.org/blog/index.php?pk=14461&T=1

As an alternative you can also use a QR Code:  

The GUIDs for individual cells are displayed in the table below:

Multiple Linear Regression - Estimated Regression Equation
Y[t] = + 146.931317512971 + 5.83579994896655X[t] + 0.101213765254304M1[t] -6.77126291530474M2[t] -15.6404133100038M3[t] -24.1513303118304M4[t] -27.4383806810127M5[t] -28.9741977423784M6[t] -31.3707148122497M7[t] -35.5184651899375M8[t] -40.832882234292M9[t] -42.8985325864632M10[t] -8.99154961380658M11[t] -0.0189162889788047t + e[t]


Multiple Linear Regression - Ordinary Least Squares
VariableParameterS.D.T-STATH0: parameter = 02-tail p-value1-tail p-value
(Intercept)146.9313175129715.48820626.772200
X5.835799948966553.1480621.85380.0687730.034386
M10.1012137652543045.5283520.01830.9854550.492727
M2-6.771262915304745.709779-1.18590.2404130.120207
M3-15.64041331000386.097814-2.56490.0128830.006442
M4-24.15133031183045.435809-4.4434e-052e-05
M5-27.43838068101275.446938-5.03745e-062e-06
M6-28.97419774237845.461967-5.30472e-061e-06
M7-31.37071481224975.843621-5.36841e-061e-06
M8-35.51846518993755.835969-6.086100
M9-40.8328822342925.82882-7.005300
M10-42.89853258646325.44746-7.87500
M11-8.991549613806585.442336-1.65210.1038170.051908
t-0.01891628897880470.054725-0.34570.7308270.365414

\begin{tabular}{lllllllll}
\hline
Multiple Linear Regression - Ordinary Least Squares \tabularnewline
Variable & Parameter & S.D. & T-STATH0: parameter = 0 & 2-tail p-value & 1-tail p-value \tabularnewline
(Intercept) & 146.931317512971 & 5.488206 & 26.7722 & 0 & 0 \tabularnewline
X & 5.83579994896655 & 3.148062 & 1.8538 & 0.068773 & 0.034386 \tabularnewline
M1 & 0.101213765254304 & 5.528352 & 0.0183 & 0.985455 & 0.492727 \tabularnewline
M2 & -6.77126291530474 & 5.709779 & -1.1859 & 0.240413 & 0.120207 \tabularnewline
M3 & -15.6404133100038 & 6.097814 & -2.5649 & 0.012883 & 0.006442 \tabularnewline
M4 & -24.1513303118304 & 5.435809 & -4.443 & 4e-05 & 2e-05 \tabularnewline
M5 & -27.4383806810127 & 5.446938 & -5.0374 & 5e-06 & 2e-06 \tabularnewline
M6 & -28.9741977423784 & 5.461967 & -5.3047 & 2e-06 & 1e-06 \tabularnewline
M7 & -31.3707148122497 & 5.843621 & -5.3684 & 1e-06 & 1e-06 \tabularnewline
M8 & -35.5184651899375 & 5.835969 & -6.0861 & 0 & 0 \tabularnewline
M9 & -40.832882234292 & 5.82882 & -7.0053 & 0 & 0 \tabularnewline
M10 & -42.8985325864632 & 5.44746 & -7.875 & 0 & 0 \tabularnewline
M11 & -8.99154961380658 & 5.442336 & -1.6521 & 0.103817 & 0.051908 \tabularnewline
t & -0.0189162889788047 & 0.054725 & -0.3457 & 0.730827 & 0.365414 \tabularnewline
\hline
\end{tabular}
%Source: https://freestatistics.org/blog/index.php?pk=14461&T=2

[TABLE]
[ROW][C]Multiple Linear Regression - Ordinary Least Squares[/C][/ROW]
[ROW][C]Variable[/C][C]Parameter[/C][C]S.D.[/C][C]T-STATH0: parameter = 0[/C][C]2-tail p-value[/C][C]1-tail p-value[/C][/ROW]
[ROW][C](Intercept)[/C][C]146.931317512971[/C][C]5.488206[/C][C]26.7722[/C][C]0[/C][C]0[/C][/ROW]
[ROW][C]X[/C][C]5.83579994896655[/C][C]3.148062[/C][C]1.8538[/C][C]0.068773[/C][C]0.034386[/C][/ROW]
[ROW][C]M1[/C][C]0.101213765254304[/C][C]5.528352[/C][C]0.0183[/C][C]0.985455[/C][C]0.492727[/C][/ROW]
[ROW][C]M2[/C][C]-6.77126291530474[/C][C]5.709779[/C][C]-1.1859[/C][C]0.240413[/C][C]0.120207[/C][/ROW]
[ROW][C]M3[/C][C]-15.6404133100038[/C][C]6.097814[/C][C]-2.5649[/C][C]0.012883[/C][C]0.006442[/C][/ROW]
[ROW][C]M4[/C][C]-24.1513303118304[/C][C]5.435809[/C][C]-4.443[/C][C]4e-05[/C][C]2e-05[/C][/ROW]
[ROW][C]M5[/C][C]-27.4383806810127[/C][C]5.446938[/C][C]-5.0374[/C][C]5e-06[/C][C]2e-06[/C][/ROW]
[ROW][C]M6[/C][C]-28.9741977423784[/C][C]5.461967[/C][C]-5.3047[/C][C]2e-06[/C][C]1e-06[/C][/ROW]
[ROW][C]M7[/C][C]-31.3707148122497[/C][C]5.843621[/C][C]-5.3684[/C][C]1e-06[/C][C]1e-06[/C][/ROW]
[ROW][C]M8[/C][C]-35.5184651899375[/C][C]5.835969[/C][C]-6.0861[/C][C]0[/C][C]0[/C][/ROW]
[ROW][C]M9[/C][C]-40.832882234292[/C][C]5.82882[/C][C]-7.0053[/C][C]0[/C][C]0[/C][/ROW]
[ROW][C]M10[/C][C]-42.8985325864632[/C][C]5.44746[/C][C]-7.875[/C][C]0[/C][C]0[/C][/ROW]
[ROW][C]M11[/C][C]-8.99154961380658[/C][C]5.442336[/C][C]-1.6521[/C][C]0.103817[/C][C]0.051908[/C][/ROW]
[ROW][C]t[/C][C]-0.0189162889788047[/C][C]0.054725[/C][C]-0.3457[/C][C]0.730827[/C][C]0.365414[/C][/ROW]
[/TABLE]
Source: https://freestatistics.org/blog/index.php?pk=14461&T=2

Globally Unique Identifier (entire table): ba.freestatistics.org/blog/index.php?pk=14461&T=2

As an alternative you can also use a QR Code:  

The GUIDs for individual cells are displayed in the table below:

Multiple Linear Regression - Ordinary Least Squares
VariableParameterS.D.T-STATH0: parameter = 02-tail p-value1-tail p-value
(Intercept)146.9313175129715.48820626.772200
X5.835799948966553.1480621.85380.0687730.034386
M10.1012137652543045.5283520.01830.9854550.492727
M2-6.771262915304745.709779-1.18590.2404130.120207
M3-15.64041331000386.097814-2.56490.0128830.006442
M4-24.15133031183045.435809-4.4434e-052e-05
M5-27.43838068101275.446938-5.03745e-062e-06
M6-28.97419774237845.461967-5.30472e-061e-06
M7-31.37071481224975.843621-5.36841e-061e-06
M8-35.51846518993755.835969-6.086100
M9-40.8328822342925.82882-7.005300
M10-42.89853258646325.44746-7.87500
M11-8.991549613806585.442336-1.65210.1038170.051908
t-0.01891628897880470.054725-0.34570.7308270.365414


Multiple Linear Regression - Regression Statistics
Multiple R0.875657079533982
R-squared0.766775320937982
Adjusted R-squared0.715386832331097
F-TEST (value)14.9211494971900
F-TEST (DF numerator)13
F-TEST (DF denominator)59
p-value4.08562073062058e-14
Multiple Linear Regression - Residual Statistics
Residual Standard Deviation9.38451061286577
Sum Squared Residuals5196.07332713642

\begin{tabular}{lllllllll}
\hline
Multiple Linear Regression - Regression Statistics \tabularnewline
Multiple R & 0.875657079533982 \tabularnewline
R-squared & 0.766775320937982 \tabularnewline
Adjusted R-squared & 0.715386832331097 \tabularnewline
F-TEST (value) & 14.9211494971900 \tabularnewline
F-TEST (DF numerator) & 13 \tabularnewline
F-TEST (DF denominator) & 59 \tabularnewline
p-value & 4.08562073062058e-14 \tabularnewline
Multiple Linear Regression - Residual Statistics \tabularnewline
Residual Standard Deviation & 9.38451061286577 \tabularnewline
Sum Squared Residuals & 5196.07332713642 \tabularnewline
\hline
\end{tabular}
%Source: https://freestatistics.org/blog/index.php?pk=14461&T=3

[TABLE]
[ROW][C]Multiple Linear Regression - Regression Statistics[/C][/ROW]
[ROW][C]Multiple R[/C][C]0.875657079533982[/C][/ROW]
[ROW][C]R-squared[/C][C]0.766775320937982[/C][/ROW]
[ROW][C]Adjusted R-squared[/C][C]0.715386832331097[/C][/ROW]
[ROW][C]F-TEST (value)[/C][C]14.9211494971900[/C][/ROW]
[ROW][C]F-TEST (DF numerator)[/C][C]13[/C][/ROW]
[ROW][C]F-TEST (DF denominator)[/C][C]59[/C][/ROW]
[ROW][C]p-value[/C][C]4.08562073062058e-14[/C][/ROW]
[ROW][C]Multiple Linear Regression - Residual Statistics[/C][/ROW]
[ROW][C]Residual Standard Deviation[/C][C]9.38451061286577[/C][/ROW]
[ROW][C]Sum Squared Residuals[/C][C]5196.07332713642[/C][/ROW]
[/TABLE]
Source: https://freestatistics.org/blog/index.php?pk=14461&T=3

Globally Unique Identifier (entire table): ba.freestatistics.org/blog/index.php?pk=14461&T=3

As an alternative you can also use a QR Code:  

The GUIDs for individual cells are displayed in the table below:

Multiple Linear Regression - Regression Statistics
Multiple R0.875657079533982
R-squared0.766775320937982
Adjusted R-squared0.715386832331097
F-TEST (value)14.9211494971900
F-TEST (DF numerator)13
F-TEST (DF denominator)59
p-value4.08562073062058e-14
Multiple Linear Regression - Residual Statistics
Residual Standard Deviation9.38451061286577
Sum Squared Residuals5196.07332713642


Multiple Linear Regression - Actuals, Interpolation, and Residuals
Time or IndexActualsInterpolationForecastResidualsPrediction Error
1140152.849414938213-12.8494149382133
2132140.122222019709-8.12222201970856
3117131.234155336031-14.2341553360308
4114128.540121994192-14.5401219941919
5113125.234155336031-12.2341553360308
6110123.679421985686-13.6794219856863
7107115.428188677870-8.42818867786978
8103111.261522011203-8.26152201120301
998105.928188677870-7.92818867786968
1098109.679421985686-11.6794219856864
11137143.567488669364-6.56748866936416
12148146.7043220452251.29567795477467
13147146.7866195215010.213380478499176
14139145.731026500930-6.73102650092954
15130131.007159868285-1.00715986828514
16128128.313126526446-0.313126526446249
17127125.0071598682851.99284013171485
18123123.452426517941-0.45242651794067
19118115.2011932101242.79880678987595
20114116.870326492424-2.87032649242395
21108105.7011932101242.29880678987594
22111109.4524265179411.54757348205935
23151143.3404932016187.65950679838152
24159152.3131265264466.68687347355375
25158146.55962405375511.4403759462448
26148139.6682310842178.3317689157827
27138130.7801644005397.21983559946051
28137128.0861310587018.9138689412994
29136124.78016440053911.2198355994605
30133123.2254310501959.774568949805
31126120.8099976913455.19000230865507
32120110.8075310757129.19246892428826
33114105.4741977423788.5258022576216
34116109.2254310501956.774568949805
35153143.1134977338739.88650226612718
36162152.0861310587019.91386894129941
37161152.1684285349768.83157146502393
38149145.2770355654383.72296443456178
39139130.5531689327948.44683106720616
40135127.8591355909557.14086440904506
41130124.5531689327945.44683106720616
42127122.9984355824494.00156441755064
43122114.7472022746337.25279772536727
44117110.5805356079666.41946439203391
45112105.2472022746336.75279772536725
46113108.9984355824494.00156441755065
47149142.8865022661276.11349773387283
48157151.8591355909555.14086440904506
49157146.10563311826410.8943668817361
50147139.2142401487267.785759851274
51137130.3261734650486.67382653495182
52132127.6321401232094.36785987679072
53125124.3261734650480.67382653495182
54123116.9356401657376.06435983426286
55117114.5202068068872.47979319311292
56114110.3535401402203.64645985977957
57111110.8560067558540.143993244146354
58112102.9356401657379.06435983426287
59144142.6595067983811.34049320161849
60150151.632140123209-1.63214012320928
61149145.8786376505183.1213623494818
62134138.987244680980-4.98724468098035
63123130.099177997303-7.09917799730252
64116121.569344706497-5.56934470649707
65117124.099177997303-7.09917799730252
66111116.708644697991-5.70864469799149
67105114.293211339141-9.29321133914142
68102110.126544672475-8.12654467247477
6995104.793211339141-9.79321133914144
7093102.708644697991-9.70864469799148
71124142.432511330636-18.4325113306359
72130151.405144655464-21.4051446554636
73124145.651642182773-21.6516421827725

\begin{tabular}{lllllllll}
\hline
Multiple Linear Regression - Actuals, Interpolation, and Residuals \tabularnewline
Time or Index & Actuals & InterpolationForecast & ResidualsPrediction Error \tabularnewline
1 & 140 & 152.849414938213 & -12.8494149382133 \tabularnewline
2 & 132 & 140.122222019709 & -8.12222201970856 \tabularnewline
3 & 117 & 131.234155336031 & -14.2341553360308 \tabularnewline
4 & 114 & 128.540121994192 & -14.5401219941919 \tabularnewline
5 & 113 & 125.234155336031 & -12.2341553360308 \tabularnewline
6 & 110 & 123.679421985686 & -13.6794219856863 \tabularnewline
7 & 107 & 115.428188677870 & -8.42818867786978 \tabularnewline
8 & 103 & 111.261522011203 & -8.26152201120301 \tabularnewline
9 & 98 & 105.928188677870 & -7.92818867786968 \tabularnewline
10 & 98 & 109.679421985686 & -11.6794219856864 \tabularnewline
11 & 137 & 143.567488669364 & -6.56748866936416 \tabularnewline
12 & 148 & 146.704322045225 & 1.29567795477467 \tabularnewline
13 & 147 & 146.786619521501 & 0.213380478499176 \tabularnewline
14 & 139 & 145.731026500930 & -6.73102650092954 \tabularnewline
15 & 130 & 131.007159868285 & -1.00715986828514 \tabularnewline
16 & 128 & 128.313126526446 & -0.313126526446249 \tabularnewline
17 & 127 & 125.007159868285 & 1.99284013171485 \tabularnewline
18 & 123 & 123.452426517941 & -0.45242651794067 \tabularnewline
19 & 118 & 115.201193210124 & 2.79880678987595 \tabularnewline
20 & 114 & 116.870326492424 & -2.87032649242395 \tabularnewline
21 & 108 & 105.701193210124 & 2.29880678987594 \tabularnewline
22 & 111 & 109.452426517941 & 1.54757348205935 \tabularnewline
23 & 151 & 143.340493201618 & 7.65950679838152 \tabularnewline
24 & 159 & 152.313126526446 & 6.68687347355375 \tabularnewline
25 & 158 & 146.559624053755 & 11.4403759462448 \tabularnewline
26 & 148 & 139.668231084217 & 8.3317689157827 \tabularnewline
27 & 138 & 130.780164400539 & 7.21983559946051 \tabularnewline
28 & 137 & 128.086131058701 & 8.9138689412994 \tabularnewline
29 & 136 & 124.780164400539 & 11.2198355994605 \tabularnewline
30 & 133 & 123.225431050195 & 9.774568949805 \tabularnewline
31 & 126 & 120.809997691345 & 5.19000230865507 \tabularnewline
32 & 120 & 110.807531075712 & 9.19246892428826 \tabularnewline
33 & 114 & 105.474197742378 & 8.5258022576216 \tabularnewline
34 & 116 & 109.225431050195 & 6.774568949805 \tabularnewline
35 & 153 & 143.113497733873 & 9.88650226612718 \tabularnewline
36 & 162 & 152.086131058701 & 9.91386894129941 \tabularnewline
37 & 161 & 152.168428534976 & 8.83157146502393 \tabularnewline
38 & 149 & 145.277035565438 & 3.72296443456178 \tabularnewline
39 & 139 & 130.553168932794 & 8.44683106720616 \tabularnewline
40 & 135 & 127.859135590955 & 7.14086440904506 \tabularnewline
41 & 130 & 124.553168932794 & 5.44683106720616 \tabularnewline
42 & 127 & 122.998435582449 & 4.00156441755064 \tabularnewline
43 & 122 & 114.747202274633 & 7.25279772536727 \tabularnewline
44 & 117 & 110.580535607966 & 6.41946439203391 \tabularnewline
45 & 112 & 105.247202274633 & 6.75279772536725 \tabularnewline
46 & 113 & 108.998435582449 & 4.00156441755065 \tabularnewline
47 & 149 & 142.886502266127 & 6.11349773387283 \tabularnewline
48 & 157 & 151.859135590955 & 5.14086440904506 \tabularnewline
49 & 157 & 146.105633118264 & 10.8943668817361 \tabularnewline
50 & 147 & 139.214240148726 & 7.785759851274 \tabularnewline
51 & 137 & 130.326173465048 & 6.67382653495182 \tabularnewline
52 & 132 & 127.632140123209 & 4.36785987679072 \tabularnewline
53 & 125 & 124.326173465048 & 0.67382653495182 \tabularnewline
54 & 123 & 116.935640165737 & 6.06435983426286 \tabularnewline
55 & 117 & 114.520206806887 & 2.47979319311292 \tabularnewline
56 & 114 & 110.353540140220 & 3.64645985977957 \tabularnewline
57 & 111 & 110.856006755854 & 0.143993244146354 \tabularnewline
58 & 112 & 102.935640165737 & 9.06435983426287 \tabularnewline
59 & 144 & 142.659506798381 & 1.34049320161849 \tabularnewline
60 & 150 & 151.632140123209 & -1.63214012320928 \tabularnewline
61 & 149 & 145.878637650518 & 3.1213623494818 \tabularnewline
62 & 134 & 138.987244680980 & -4.98724468098035 \tabularnewline
63 & 123 & 130.099177997303 & -7.09917799730252 \tabularnewline
64 & 116 & 121.569344706497 & -5.56934470649707 \tabularnewline
65 & 117 & 124.099177997303 & -7.09917799730252 \tabularnewline
66 & 111 & 116.708644697991 & -5.70864469799149 \tabularnewline
67 & 105 & 114.293211339141 & -9.29321133914142 \tabularnewline
68 & 102 & 110.126544672475 & -8.12654467247477 \tabularnewline
69 & 95 & 104.793211339141 & -9.79321133914144 \tabularnewline
70 & 93 & 102.708644697991 & -9.70864469799148 \tabularnewline
71 & 124 & 142.432511330636 & -18.4325113306359 \tabularnewline
72 & 130 & 151.405144655464 & -21.4051446554636 \tabularnewline
73 & 124 & 145.651642182773 & -21.6516421827725 \tabularnewline
\hline
\end{tabular}
%Source: https://freestatistics.org/blog/index.php?pk=14461&T=4

[TABLE]
[ROW][C]Multiple Linear Regression - Actuals, Interpolation, and Residuals[/C][/ROW]
[ROW][C]Time or Index[/C][C]Actuals[/C][C]InterpolationForecast[/C][C]ResidualsPrediction Error[/C][/ROW]
[ROW][C]1[/C][C]140[/C][C]152.849414938213[/C][C]-12.8494149382133[/C][/ROW]
[ROW][C]2[/C][C]132[/C][C]140.122222019709[/C][C]-8.12222201970856[/C][/ROW]
[ROW][C]3[/C][C]117[/C][C]131.234155336031[/C][C]-14.2341553360308[/C][/ROW]
[ROW][C]4[/C][C]114[/C][C]128.540121994192[/C][C]-14.5401219941919[/C][/ROW]
[ROW][C]5[/C][C]113[/C][C]125.234155336031[/C][C]-12.2341553360308[/C][/ROW]
[ROW][C]6[/C][C]110[/C][C]123.679421985686[/C][C]-13.6794219856863[/C][/ROW]
[ROW][C]7[/C][C]107[/C][C]115.428188677870[/C][C]-8.42818867786978[/C][/ROW]
[ROW][C]8[/C][C]103[/C][C]111.261522011203[/C][C]-8.26152201120301[/C][/ROW]
[ROW][C]9[/C][C]98[/C][C]105.928188677870[/C][C]-7.92818867786968[/C][/ROW]
[ROW][C]10[/C][C]98[/C][C]109.679421985686[/C][C]-11.6794219856864[/C][/ROW]
[ROW][C]11[/C][C]137[/C][C]143.567488669364[/C][C]-6.56748866936416[/C][/ROW]
[ROW][C]12[/C][C]148[/C][C]146.704322045225[/C][C]1.29567795477467[/C][/ROW]
[ROW][C]13[/C][C]147[/C][C]146.786619521501[/C][C]0.213380478499176[/C][/ROW]
[ROW][C]14[/C][C]139[/C][C]145.731026500930[/C][C]-6.73102650092954[/C][/ROW]
[ROW][C]15[/C][C]130[/C][C]131.007159868285[/C][C]-1.00715986828514[/C][/ROW]
[ROW][C]16[/C][C]128[/C][C]128.313126526446[/C][C]-0.313126526446249[/C][/ROW]
[ROW][C]17[/C][C]127[/C][C]125.007159868285[/C][C]1.99284013171485[/C][/ROW]
[ROW][C]18[/C][C]123[/C][C]123.452426517941[/C][C]-0.45242651794067[/C][/ROW]
[ROW][C]19[/C][C]118[/C][C]115.201193210124[/C][C]2.79880678987595[/C][/ROW]
[ROW][C]20[/C][C]114[/C][C]116.870326492424[/C][C]-2.87032649242395[/C][/ROW]
[ROW][C]21[/C][C]108[/C][C]105.701193210124[/C][C]2.29880678987594[/C][/ROW]
[ROW][C]22[/C][C]111[/C][C]109.452426517941[/C][C]1.54757348205935[/C][/ROW]
[ROW][C]23[/C][C]151[/C][C]143.340493201618[/C][C]7.65950679838152[/C][/ROW]
[ROW][C]24[/C][C]159[/C][C]152.313126526446[/C][C]6.68687347355375[/C][/ROW]
[ROW][C]25[/C][C]158[/C][C]146.559624053755[/C][C]11.4403759462448[/C][/ROW]
[ROW][C]26[/C][C]148[/C][C]139.668231084217[/C][C]8.3317689157827[/C][/ROW]
[ROW][C]27[/C][C]138[/C][C]130.780164400539[/C][C]7.21983559946051[/C][/ROW]
[ROW][C]28[/C][C]137[/C][C]128.086131058701[/C][C]8.9138689412994[/C][/ROW]
[ROW][C]29[/C][C]136[/C][C]124.780164400539[/C][C]11.2198355994605[/C][/ROW]
[ROW][C]30[/C][C]133[/C][C]123.225431050195[/C][C]9.774568949805[/C][/ROW]
[ROW][C]31[/C][C]126[/C][C]120.809997691345[/C][C]5.19000230865507[/C][/ROW]
[ROW][C]32[/C][C]120[/C][C]110.807531075712[/C][C]9.19246892428826[/C][/ROW]
[ROW][C]33[/C][C]114[/C][C]105.474197742378[/C][C]8.5258022576216[/C][/ROW]
[ROW][C]34[/C][C]116[/C][C]109.225431050195[/C][C]6.774568949805[/C][/ROW]
[ROW][C]35[/C][C]153[/C][C]143.113497733873[/C][C]9.88650226612718[/C][/ROW]
[ROW][C]36[/C][C]162[/C][C]152.086131058701[/C][C]9.91386894129941[/C][/ROW]
[ROW][C]37[/C][C]161[/C][C]152.168428534976[/C][C]8.83157146502393[/C][/ROW]
[ROW][C]38[/C][C]149[/C][C]145.277035565438[/C][C]3.72296443456178[/C][/ROW]
[ROW][C]39[/C][C]139[/C][C]130.553168932794[/C][C]8.44683106720616[/C][/ROW]
[ROW][C]40[/C][C]135[/C][C]127.859135590955[/C][C]7.14086440904506[/C][/ROW]
[ROW][C]41[/C][C]130[/C][C]124.553168932794[/C][C]5.44683106720616[/C][/ROW]
[ROW][C]42[/C][C]127[/C][C]122.998435582449[/C][C]4.00156441755064[/C][/ROW]
[ROW][C]43[/C][C]122[/C][C]114.747202274633[/C][C]7.25279772536727[/C][/ROW]
[ROW][C]44[/C][C]117[/C][C]110.580535607966[/C][C]6.41946439203391[/C][/ROW]
[ROW][C]45[/C][C]112[/C][C]105.247202274633[/C][C]6.75279772536725[/C][/ROW]
[ROW][C]46[/C][C]113[/C][C]108.998435582449[/C][C]4.00156441755065[/C][/ROW]
[ROW][C]47[/C][C]149[/C][C]142.886502266127[/C][C]6.11349773387283[/C][/ROW]
[ROW][C]48[/C][C]157[/C][C]151.859135590955[/C][C]5.14086440904506[/C][/ROW]
[ROW][C]49[/C][C]157[/C][C]146.105633118264[/C][C]10.8943668817361[/C][/ROW]
[ROW][C]50[/C][C]147[/C][C]139.214240148726[/C][C]7.785759851274[/C][/ROW]
[ROW][C]51[/C][C]137[/C][C]130.326173465048[/C][C]6.67382653495182[/C][/ROW]
[ROW][C]52[/C][C]132[/C][C]127.632140123209[/C][C]4.36785987679072[/C][/ROW]
[ROW][C]53[/C][C]125[/C][C]124.326173465048[/C][C]0.67382653495182[/C][/ROW]
[ROW][C]54[/C][C]123[/C][C]116.935640165737[/C][C]6.06435983426286[/C][/ROW]
[ROW][C]55[/C][C]117[/C][C]114.520206806887[/C][C]2.47979319311292[/C][/ROW]
[ROW][C]56[/C][C]114[/C][C]110.353540140220[/C][C]3.64645985977957[/C][/ROW]
[ROW][C]57[/C][C]111[/C][C]110.856006755854[/C][C]0.143993244146354[/C][/ROW]
[ROW][C]58[/C][C]112[/C][C]102.935640165737[/C][C]9.06435983426287[/C][/ROW]
[ROW][C]59[/C][C]144[/C][C]142.659506798381[/C][C]1.34049320161849[/C][/ROW]
[ROW][C]60[/C][C]150[/C][C]151.632140123209[/C][C]-1.63214012320928[/C][/ROW]
[ROW][C]61[/C][C]149[/C][C]145.878637650518[/C][C]3.1213623494818[/C][/ROW]
[ROW][C]62[/C][C]134[/C][C]138.987244680980[/C][C]-4.98724468098035[/C][/ROW]
[ROW][C]63[/C][C]123[/C][C]130.099177997303[/C][C]-7.09917799730252[/C][/ROW]
[ROW][C]64[/C][C]116[/C][C]121.569344706497[/C][C]-5.56934470649707[/C][/ROW]
[ROW][C]65[/C][C]117[/C][C]124.099177997303[/C][C]-7.09917799730252[/C][/ROW]
[ROW][C]66[/C][C]111[/C][C]116.708644697991[/C][C]-5.70864469799149[/C][/ROW]
[ROW][C]67[/C][C]105[/C][C]114.293211339141[/C][C]-9.29321133914142[/C][/ROW]
[ROW][C]68[/C][C]102[/C][C]110.126544672475[/C][C]-8.12654467247477[/C][/ROW]
[ROW][C]69[/C][C]95[/C][C]104.793211339141[/C][C]-9.79321133914144[/C][/ROW]
[ROW][C]70[/C][C]93[/C][C]102.708644697991[/C][C]-9.70864469799148[/C][/ROW]
[ROW][C]71[/C][C]124[/C][C]142.432511330636[/C][C]-18.4325113306359[/C][/ROW]
[ROW][C]72[/C][C]130[/C][C]151.405144655464[/C][C]-21.4051446554636[/C][/ROW]
[ROW][C]73[/C][C]124[/C][C]145.651642182773[/C][C]-21.6516421827725[/C][/ROW]
[/TABLE]
Source: https://freestatistics.org/blog/index.php?pk=14461&T=4

Globally Unique Identifier (entire table): ba.freestatistics.org/blog/index.php?pk=14461&T=4

As an alternative you can also use a QR Code:  

The GUIDs for individual cells are displayed in the table below:

Multiple Linear Regression - Actuals, Interpolation, and Residuals
Time or IndexActualsInterpolationForecastResidualsPrediction Error
1140152.849414938213-12.8494149382133
2132140.122222019709-8.12222201970856
3117131.234155336031-14.2341553360308
4114128.540121994192-14.5401219941919
5113125.234155336031-12.2341553360308
6110123.679421985686-13.6794219856863
7107115.428188677870-8.42818867786978
8103111.261522011203-8.26152201120301
998105.928188677870-7.92818867786968
1098109.679421985686-11.6794219856864
11137143.567488669364-6.56748866936416
12148146.7043220452251.29567795477467
13147146.7866195215010.213380478499176
14139145.731026500930-6.73102650092954
15130131.007159868285-1.00715986828514
16128128.313126526446-0.313126526446249
17127125.0071598682851.99284013171485
18123123.452426517941-0.45242651794067
19118115.2011932101242.79880678987595
20114116.870326492424-2.87032649242395
21108105.7011932101242.29880678987594
22111109.4524265179411.54757348205935
23151143.3404932016187.65950679838152
24159152.3131265264466.68687347355375
25158146.55962405375511.4403759462448
26148139.6682310842178.3317689157827
27138130.7801644005397.21983559946051
28137128.0861310587018.9138689412994
29136124.78016440053911.2198355994605
30133123.2254310501959.774568949805
31126120.8099976913455.19000230865507
32120110.8075310757129.19246892428826
33114105.4741977423788.5258022576216
34116109.2254310501956.774568949805
35153143.1134977338739.88650226612718
36162152.0861310587019.91386894129941
37161152.1684285349768.83157146502393
38149145.2770355654383.72296443456178
39139130.5531689327948.44683106720616
40135127.8591355909557.14086440904506
41130124.5531689327945.44683106720616
42127122.9984355824494.00156441755064
43122114.7472022746337.25279772536727
44117110.5805356079666.41946439203391
45112105.2472022746336.75279772536725
46113108.9984355824494.00156441755065
47149142.8865022661276.11349773387283
48157151.8591355909555.14086440904506
49157146.10563311826410.8943668817361
50147139.2142401487267.785759851274
51137130.3261734650486.67382653495182
52132127.6321401232094.36785987679072
53125124.3261734650480.67382653495182
54123116.9356401657376.06435983426286
55117114.5202068068872.47979319311292
56114110.3535401402203.64645985977957
57111110.8560067558540.143993244146354
58112102.9356401657379.06435983426287
59144142.6595067983811.34049320161849
60150151.632140123209-1.63214012320928
61149145.8786376505183.1213623494818
62134138.987244680980-4.98724468098035
63123130.099177997303-7.09917799730252
64116121.569344706497-5.56934470649707
65117124.099177997303-7.09917799730252
66111116.708644697991-5.70864469799149
67105114.293211339141-9.29321133914142
68102110.126544672475-8.12654467247477
6995104.793211339141-9.79321133914144
7093102.708644697991-9.70864469799148
71124142.432511330636-18.4325113306359
72130151.405144655464-21.4051446554636
73124145.651642182773-21.6516421827725


Parameters (Session):
par1 = 1 ; par2 = Include Monthly Dummies ; par3 = Linear Trend ;
Parameters (R input):
par1 = 1 ; par2 = Include Monthly Dummies ; par3 = Linear Trend ;
R code (references can be found in the software module):
library(lattice)
par1 <- as.numeric(par1)
x <- t(y)
k <- length(x[1,])
n <- length(x[,1])
x1 <- cbind(x[,par1], x[,1:k!=par1])
mycolnames <- c(colnames(x)[par1], colnames(x)[1:k!=par1])
colnames(x1) <- mycolnames #colnames(x)[par1]
x <- x1
if (par3 == 'First Differences'){
x2 <- array(0, dim=c(n-1,k), dimnames=list(1:(n-1), paste('(1-B)',colnames(x),sep='')))
for (i in 1:n-1) {
for (j in 1:k) {
x2[i,j] <- x[i+1,j] - x[i,j]
}
}
x <- x2
}
if (par2 == 'Include Monthly Dummies'){
x2 <- array(0, dim=c(n,11), dimnames=list(1:n, paste('M', seq(1:11), sep ='')))
for (i in 1:11){
x2[seq(i,n,12),i] <- 1
}
x <- cbind(x, x2)
}
if (par2 == 'Include Quarterly Dummies'){
x2 <- array(0, dim=c(n,3), dimnames=list(1:n, paste('Q', seq(1:3), sep ='')))
for (i in 1:3){
x2[seq(i,n,4),i] <- 1
}
x <- cbind(x, x2)
}
k <- length(x[1,])
if (par3 == 'Linear Trend'){
x <- cbind(x, c(1:n))
colnames(x)[k+1] <- 't'
}
x
k <- length(x[1,])
df <- as.data.frame(x)
(mylm <- lm(df))
(mysum <- summary(mylm))
bitmap(file='test0.png')
plot(x[,1], type='l', main='Actuals and Interpolation', ylab='value of Actuals and Interpolation (dots)', xlab='time or index')
points(x[,1]-mysum$resid)
grid()
dev.off()
bitmap(file='test1.png')
plot(mysum$resid, type='b', pch=19, main='Residuals', ylab='value of Residuals', xlab='time or index')
grid()
dev.off()
bitmap(file='test2.png')
hist(mysum$resid, main='Residual Histogram', xlab='values of Residuals')
grid()
dev.off()
bitmap(file='test3.png')
densityplot(~mysum$resid,col='black',main='Residual Density Plot', xlab='values of Residuals')
dev.off()
bitmap(file='test4.png')
qqnorm(mysum$resid, main='Residual Normal Q-Q Plot')
grid()
dev.off()
(myerror <- as.ts(mysum$resid))
bitmap(file='test5.png')
dum <- cbind(lag(myerror,k=1),myerror)
dum
dum1 <- dum[2:length(myerror),]
dum1
z <- as.data.frame(dum1)
z
plot(z,main=paste('Residual Lag plot, lowess, and regression line'), ylab='values of Residuals', xlab='lagged values of Residuals')
lines(lowess(z))
abline(lm(z))
grid()
dev.off()
bitmap(file='test6.png')
acf(mysum$resid, lag.max=length(mysum$resid)/2, main='Residual Autocorrelation Function')
grid()
dev.off()
bitmap(file='test7.png')
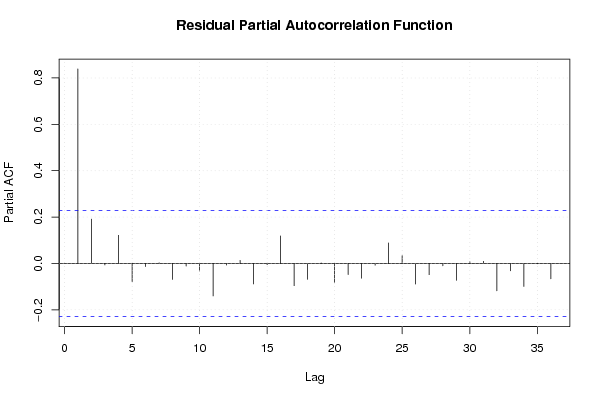
pacf(mysum$resid, lag.max=length(mysum$resid)/2, main='Residual Partial Autocorrelation Function')
grid()
dev.off()
bitmap(file='test8.png')
opar <- par(mfrow = c(2,2), oma = c(0, 0, 1.1, 0))
plot(mylm, las = 1, sub='Residual Diagnostics')
par(opar)
dev.off()
load(file='createtable')
a<-table.start()
a<-table.row.start(a)
a<-table.element(a, 'Multiple Linear Regression - Estimated Regression Equation', 1, TRUE)
a<-table.row.end(a)
myeq <- colnames(x)[1]
myeq <- paste(myeq, '[t] = ', sep='')
for (i in 1:k){
if (mysum$coefficients[i,1] > 0) myeq <- paste(myeq, '+', '')
myeq <- paste(myeq, mysum$coefficients[i,1], sep=' ')
if (rownames(mysum$coefficients)[i] != '(Intercept)') {
myeq <- paste(myeq, rownames(mysum$coefficients)[i], sep='')
if (rownames(mysum$coefficients)[i] != 't') myeq <- paste(myeq, '[t]', sep='')
}
}
myeq <- paste(myeq, ' + e[t]')
a<-table.row.start(a)
a<-table.element(a, myeq)
a<-table.row.end(a)
a<-table.end(a)
table.save(a,file='mytable1.tab')
a<-table.start()
a<-table.row.start(a)
a<-table.element(a,hyperlink('ols1.htm','Multiple Linear Regression - Ordinary Least Squares',''), 6, TRUE)
a<-table.row.end(a)
a<-table.row.start(a)
a<-table.element(a,'Variable',header=TRUE)
a<-table.element(a,'Parameter',header=TRUE)
a<-table.element(a,'S.D.',header=TRUE)
a<-table.element(a,'T-STAT
H0: parameter = 0',header=TRUE)
a<-table.element(a,'2-tail p-value',header=TRUE)
a<-table.element(a,'1-tail p-value',header=TRUE)
a<-table.row.end(a)
for (i in 1:k){
a<-table.row.start(a)
a<-table.element(a,rownames(mysum$coefficients)[i],header=TRUE)
a<-table.element(a,mysum$coefficients[i,1])
a<-table.element(a, round(mysum$coefficients[i,2],6))
a<-table.element(a, round(mysum$coefficients[i,3],4))
a<-table.element(a, round(mysum$coefficients[i,4],6))
a<-table.element(a, round(mysum$coefficients[i,4]/2,6))
a<-table.row.end(a)
}
a<-table.end(a)
table.save(a,file='mytable2.tab')
a<-table.start()
a<-table.row.start(a)
a<-table.element(a, 'Multiple Linear Regression - Regression Statistics', 2, TRUE)
a<-table.row.end(a)
a<-table.row.start(a)
a<-table.element(a, 'Multiple R',1,TRUE)
a<-table.element(a, sqrt(mysum$r.squared))
a<-table.row.end(a)
a<-table.row.start(a)
a<-table.element(a, 'R-squared',1,TRUE)
a<-table.element(a, mysum$r.squared)
a<-table.row.end(a)
a<-table.row.start(a)
a<-table.element(a, 'Adjusted R-squared',1,TRUE)
a<-table.element(a, mysum$adj.r.squared)
a<-table.row.end(a)
a<-table.row.start(a)
a<-table.element(a, 'F-TEST (value)',1,TRUE)
a<-table.element(a, mysum$fstatistic[1])
a<-table.row.end(a)
a<-table.row.start(a)
a<-table.element(a, 'F-TEST (DF numerator)',1,TRUE)
a<-table.element(a, mysum$fstatistic[2])
a<-table.row.end(a)
a<-table.row.start(a)
a<-table.element(a, 'F-TEST (DF denominator)',1,TRUE)
a<-table.element(a, mysum$fstatistic[3])
a<-table.row.end(a)
a<-table.row.start(a)
a<-table.element(a, 'p-value',1,TRUE)
a<-table.element(a, 1-pf(mysum$fstatistic[1],mysum$fstatistic[2],mysum$fstatistic[3]))
a<-table.row.end(a)
a<-table.row.start(a)
a<-table.element(a, 'Multiple Linear Regression - Residual Statistics', 2, TRUE)
a<-table.row.end(a)
a<-table.row.start(a)
a<-table.element(a, 'Residual Standard Deviation',1,TRUE)
a<-table.element(a, mysum$sigma)
a<-table.row.end(a)
a<-table.row.start(a)
a<-table.element(a, 'Sum Squared Residuals',1,TRUE)
a<-table.element(a, sum(myerror*myerror))
a<-table.row.end(a)
a<-table.end(a)
table.save(a,file='mytable3.tab')
a<-table.start()
a<-table.row.start(a)
a<-table.element(a, 'Multiple Linear Regression - Actuals, Interpolation, and Residuals', 4, TRUE)
a<-table.row.end(a)
a<-table.row.start(a)
a<-table.element(a, 'Time or Index', 1, TRUE)
a<-table.element(a, 'Actuals', 1, TRUE)
a<-table.element(a, 'Interpolation
Forecast', 1, TRUE)
a<-table.element(a, 'Residuals
Prediction Error', 1, TRUE)
a<-table.row.end(a)
for (i in 1:n) {
a<-table.row.start(a)
a<-table.element(a,i, 1, TRUE)
a<-table.element(a,x[i])
a<-table.element(a,x[i]-mysum$resid[i])
a<-table.element(a,mysum$resid[i])
a<-table.row.end(a)
}
a<-table.end(a)
table.save(a,file='mytable4.tab')