Free Statistics

of Irreproducible Research!

Author's title

Author*Unverified author*
R Software Modulerwasp_multipleregression.wasp
Title produced by softwareMultiple Regression
Date of computationThu, 15 Nov 2007 08:39:50 -0700
Cite this page as followsStatistical Computations at FreeStatistics.org, Office for Research Development and Education, URL https://freestatistics.org/blog/index.php?v=date/2007/Nov/15/t1195140894h1dlcc5cs0gmujn.htm/, Retrieved Sat, 04 May 2024 12:05:12 +0000
Statistical Computations at FreeStatistics.org, Office for Research Development and Education, URL https://freestatistics.org/blog/index.php?pk=14460, Retrieved Sat, 04 May 2024 12:05:12 +0000
QR Codes:

Original text written by user:
IsPrivate?No (this computation is public)
User-defined keywordsW9Q3G7
Estimated Impact187
Family? (F = Feedback message, R = changed R code, M = changed R Module, P = changed Parameters, D = changed Data)
-       [Multiple Regression] [multiple regressi...] [2007-11-15 15:39:50] [923db922542fbe09e7ff87bb31b2f310] [Current]
Feedback Forum

Post a new message
Dataseries X:
140	1
132	0
117	0
114	1
113	1
110	1
107	0
103	0
98	0
98	1
137	1
148	0
147	0
139	1
130	0
128	1
127	1
123	1
118	0
114	1
108	0
111	1
151	1
159	1
158	0
148	0
138	0
137	1
136	1
133	1
126	1
120	0
114	0
116	1
153	1
162	1
161	1
149	1
139	0
135	1
130	1
127	1
122	0
117	0
112	0
113	1
149	1
157	1
157	0
147	0
137	0
132	1
125	1
123	0
117	0
114	0
111	1
112	0
144	1
150	1
149	0
134	0
123	0
116	0
117	1
111	0
105	0
102	0
95	0
93	0
124	1
130	1
124	0


Summary of compuational transaction
Raw Inputview raw input (R code)
Raw Outputview raw output of R engine
Computing time3 seconds
R Server'Gwilym Jenkins' @ 72.249.127.135

\begin{tabular}{lllllllll}
\hline
Summary of compuational transaction \tabularnewline
Raw Input & view raw input (R code)  \tabularnewline
Raw Output & view raw output of R engine  \tabularnewline
Computing time & 3 seconds \tabularnewline
R Server & 'Gwilym Jenkins' @ 72.249.127.135 \tabularnewline
\hline
\end{tabular}
%Source: https://freestatistics.org/blog/index.php?pk=14460&T=0

[TABLE]
[ROW][C]Summary of compuational transaction[/C][/ROW]
[ROW][C]Raw Input[/C][C]view raw input (R code) [/C][/ROW]
[ROW][C]Raw Output[/C][C]view raw output of R engine [/C][/ROW]
[ROW][C]Computing time[/C][C]3 seconds[/C][/ROW]
[ROW][C]R Server[/C][C]'Gwilym Jenkins' @ 72.249.127.135[/C][/ROW]
[/TABLE]
Source: https://freestatistics.org/blog/index.php?pk=14460&T=0

Globally Unique Identifier (entire table): ba.freestatistics.org/blog/index.php?pk=14460&T=0

As an alternative you can also use a QR Code:  

The GUIDs for individual cells are displayed in the table below:

Summary of compuational transaction
Raw Inputview raw input (R code)
Raw Outputview raw output of R engine
Computing time3 seconds
R Server'Gwilym Jenkins' @ 72.249.127.135


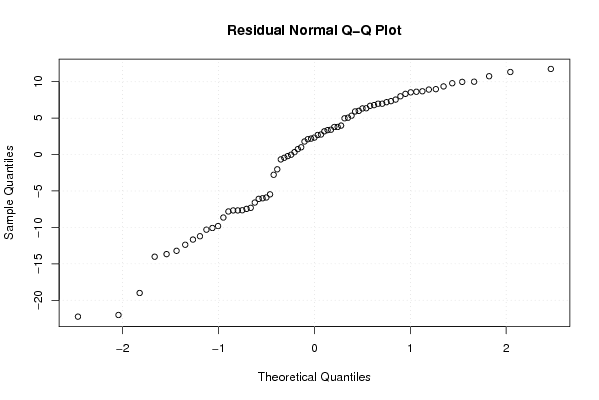
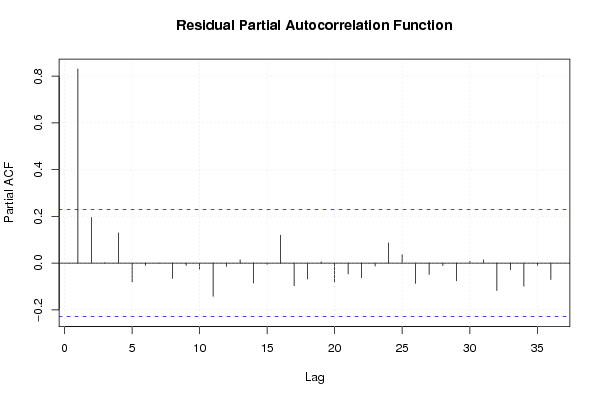
Multiple Linear Regression - Estimated Regression Equation
Y[t] = + 145.890405293631 + 6.13151364764265X[t] + 0.357733664185238M1[t] -6.43424317617864M2[t] -15.2237386269644M3[t] -24M4[t] -27.3552522746071M5[t] -28.8114143920596M6[t] -31.0789909015716M7[t] -35.2456575682382M8[t] -40.5789909015715M9[t] -42.8114143920596M10[t] -9.02191894127379M11[t] + e[t]

\begin{tabular}{lllllllll}
\hline
Multiple Linear Regression - Estimated Regression Equation \tabularnewline
Y[t] =  +  145.890405293631 +  6.13151364764265X[t] +  0.357733664185238M1[t] -6.43424317617864M2[t] -15.2237386269644M3[t] -24M4[t] -27.3552522746071M5[t] -28.8114143920596M6[t] -31.0789909015716M7[t] -35.2456575682382M8[t] -40.5789909015715M9[t] -42.8114143920596M10[t] -9.02191894127379M11[t]  + e[t] \tabularnewline
\hline
\end{tabular}
%Source: https://freestatistics.org/blog/index.php?pk=14460&T=1

[TABLE]
[ROW][C]Multiple Linear Regression - Estimated Regression Equation[/C][/ROW]
[ROW][C]Y[t] =  +  145.890405293631 +  6.13151364764265X[t] +  0.357733664185238M1[t] -6.43424317617864M2[t] -15.2237386269644M3[t] -24M4[t] -27.3552522746071M5[t] -28.8114143920596M6[t] -31.0789909015716M7[t] -35.2456575682382M8[t] -40.5789909015715M9[t] -42.8114143920596M10[t] -9.02191894127379M11[t]  + e[t][/C][/ROW]
[/TABLE]
Source: https://freestatistics.org/blog/index.php?pk=14460&T=1

Globally Unique Identifier (entire table): ba.freestatistics.org/blog/index.php?pk=14460&T=1

As an alternative you can also use a QR Code:  

The GUIDs for individual cells are displayed in the table below:

Multiple Linear Regression - Estimated Regression Equation
Y[t] = + 145.890405293631 + 6.13151364764265X[t] + 0.357733664185238M1[t] -6.43424317617864M2[t] -15.2237386269644M3[t] -24M4[t] -27.3552522746071M5[t] -28.8114143920596M6[t] -31.0789909015716M7[t] -35.2456575682382M8[t] -40.5789909015715M9[t] -42.8114143920596M10[t] -9.02191894127379M11[t] + e[t]


Multiple Linear Regression - Ordinary Least Squares
VariableParameterS.D.T-STATH0: parameter = 02-tail p-value1-tail p-value
(Intercept)145.8904052936314.55446232.032400
X6.131513647642653.0072772.03890.0458740.022937
M10.3577336641852385.437970.06580.9477680.473884
M2-6.434243176178645.584484-1.15220.2538240.126912
M3-15.22373862696445.933455-2.56570.0128120.006406
M4-245.378246-4.46243.6e-051.8e-05
M5-27.35525227460715.40155-5.06434e-062e-06
M6-28.81141439205965.40155-5.33392e-061e-06
M7-31.07899090157165.73977-5.41471e-061e-06
M8-35.24565756823825.73977-6.140600
M9-40.57899090157155.73977-7.069800
M10-42.81141439205965.40155-7.925800
M11-9.021918941273795.40155-1.67020.100080.05004

\begin{tabular}{lllllllll}
\hline
Multiple Linear Regression - Ordinary Least Squares \tabularnewline
Variable & Parameter & S.D. & T-STATH0: parameter = 0 & 2-tail p-value & 1-tail p-value \tabularnewline
(Intercept) & 145.890405293631 & 4.554462 & 32.0324 & 0 & 0 \tabularnewline
X & 6.13151364764265 & 3.007277 & 2.0389 & 0.045874 & 0.022937 \tabularnewline
M1 & 0.357733664185238 & 5.43797 & 0.0658 & 0.947768 & 0.473884 \tabularnewline
M2 & -6.43424317617864 & 5.584484 & -1.1522 & 0.253824 & 0.126912 \tabularnewline
M3 & -15.2237386269644 & 5.933455 & -2.5657 & 0.012812 & 0.006406 \tabularnewline
M4 & -24 & 5.378246 & -4.4624 & 3.6e-05 & 1.8e-05 \tabularnewline
M5 & -27.3552522746071 & 5.40155 & -5.0643 & 4e-06 & 2e-06 \tabularnewline
M6 & -28.8114143920596 & 5.40155 & -5.3339 & 2e-06 & 1e-06 \tabularnewline
M7 & -31.0789909015716 & 5.73977 & -5.4147 & 1e-06 & 1e-06 \tabularnewline
M8 & -35.2456575682382 & 5.73977 & -6.1406 & 0 & 0 \tabularnewline
M9 & -40.5789909015715 & 5.73977 & -7.0698 & 0 & 0 \tabularnewline
M10 & -42.8114143920596 & 5.40155 & -7.9258 & 0 & 0 \tabularnewline
M11 & -9.02191894127379 & 5.40155 & -1.6702 & 0.10008 & 0.05004 \tabularnewline
\hline
\end{tabular}
%Source: https://freestatistics.org/blog/index.php?pk=14460&T=2

[TABLE]
[ROW][C]Multiple Linear Regression - Ordinary Least Squares[/C][/ROW]
[ROW][C]Variable[/C][C]Parameter[/C][C]S.D.[/C][C]T-STATH0: parameter = 0[/C][C]2-tail p-value[/C][C]1-tail p-value[/C][/ROW]
[ROW][C](Intercept)[/C][C]145.890405293631[/C][C]4.554462[/C][C]32.0324[/C][C]0[/C][C]0[/C][/ROW]
[ROW][C]X[/C][C]6.13151364764265[/C][C]3.007277[/C][C]2.0389[/C][C]0.045874[/C][C]0.022937[/C][/ROW]
[ROW][C]M1[/C][C]0.357733664185238[/C][C]5.43797[/C][C]0.0658[/C][C]0.947768[/C][C]0.473884[/C][/ROW]
[ROW][C]M2[/C][C]-6.43424317617864[/C][C]5.584484[/C][C]-1.1522[/C][C]0.253824[/C][C]0.126912[/C][/ROW]
[ROW][C]M3[/C][C]-15.2237386269644[/C][C]5.933455[/C][C]-2.5657[/C][C]0.012812[/C][C]0.006406[/C][/ROW]
[ROW][C]M4[/C][C]-24[/C][C]5.378246[/C][C]-4.4624[/C][C]3.6e-05[/C][C]1.8e-05[/C][/ROW]
[ROW][C]M5[/C][C]-27.3552522746071[/C][C]5.40155[/C][C]-5.0643[/C][C]4e-06[/C][C]2e-06[/C][/ROW]
[ROW][C]M6[/C][C]-28.8114143920596[/C][C]5.40155[/C][C]-5.3339[/C][C]2e-06[/C][C]1e-06[/C][/ROW]
[ROW][C]M7[/C][C]-31.0789909015716[/C][C]5.73977[/C][C]-5.4147[/C][C]1e-06[/C][C]1e-06[/C][/ROW]
[ROW][C]M8[/C][C]-35.2456575682382[/C][C]5.73977[/C][C]-6.1406[/C][C]0[/C][C]0[/C][/ROW]
[ROW][C]M9[/C][C]-40.5789909015715[/C][C]5.73977[/C][C]-7.0698[/C][C]0[/C][C]0[/C][/ROW]
[ROW][C]M10[/C][C]-42.8114143920596[/C][C]5.40155[/C][C]-7.9258[/C][C]0[/C][C]0[/C][/ROW]
[ROW][C]M11[/C][C]-9.02191894127379[/C][C]5.40155[/C][C]-1.6702[/C][C]0.10008[/C][C]0.05004[/C][/ROW]
[/TABLE]
Source: https://freestatistics.org/blog/index.php?pk=14460&T=2

Globally Unique Identifier (entire table): ba.freestatistics.org/blog/index.php?pk=14460&T=2

As an alternative you can also use a QR Code:  

The GUIDs for individual cells are displayed in the table below:

Multiple Linear Regression - Ordinary Least Squares
VariableParameterS.D.T-STATH0: parameter = 02-tail p-value1-tail p-value
(Intercept)145.8904052936314.55446232.032400
X6.131513647642653.0072772.03890.0458740.022937
M10.3577336641852385.437970.06580.9477680.473884
M2-6.434243176178645.584484-1.15220.2538240.126912
M3-15.22373862696445.933455-2.56570.0128120.006406
M4-245.378246-4.46243.6e-051.8e-05
M5-27.35525227460715.40155-5.06434e-062e-06
M6-28.81141439205965.40155-5.33392e-061e-06
M7-31.07899090157165.73977-5.41471e-061e-06
M8-35.24565756823825.73977-6.140600
M9-40.57899090157155.73977-7.069800
M10-42.81141439205965.40155-7.925800
M11-9.021918941273795.40155-1.67020.100080.05004


Multiple Linear Regression - Regression Statistics
Multiple R0.875387351584385
R-squared0.766303015313923
Adjusted R-squared0.719563618376708
F-TEST (value)16.3952268434976
F-TEST (DF numerator)12
F-TEST (DF denominator)60
p-value1.03250741290140e-14
Multiple Linear Regression - Residual Statistics
Residual Standard Deviation9.31539581111443
Sum Squared Residuals5206.5959470637

\begin{tabular}{lllllllll}
\hline
Multiple Linear Regression - Regression Statistics \tabularnewline
Multiple R & 0.875387351584385 \tabularnewline
R-squared & 0.766303015313923 \tabularnewline
Adjusted R-squared & 0.719563618376708 \tabularnewline
F-TEST (value) & 16.3952268434976 \tabularnewline
F-TEST (DF numerator) & 12 \tabularnewline
F-TEST (DF denominator) & 60 \tabularnewline
p-value & 1.03250741290140e-14 \tabularnewline
Multiple Linear Regression - Residual Statistics \tabularnewline
Residual Standard Deviation & 9.31539581111443 \tabularnewline
Sum Squared Residuals & 5206.5959470637 \tabularnewline
\hline
\end{tabular}
%Source: https://freestatistics.org/blog/index.php?pk=14460&T=3

[TABLE]
[ROW][C]Multiple Linear Regression - Regression Statistics[/C][/ROW]
[ROW][C]Multiple R[/C][C]0.875387351584385[/C][/ROW]
[ROW][C]R-squared[/C][C]0.766303015313923[/C][/ROW]
[ROW][C]Adjusted R-squared[/C][C]0.719563618376708[/C][/ROW]
[ROW][C]F-TEST (value)[/C][C]16.3952268434976[/C][/ROW]
[ROW][C]F-TEST (DF numerator)[/C][C]12[/C][/ROW]
[ROW][C]F-TEST (DF denominator)[/C][C]60[/C][/ROW]
[ROW][C]p-value[/C][C]1.03250741290140e-14[/C][/ROW]
[ROW][C]Multiple Linear Regression - Residual Statistics[/C][/ROW]
[ROW][C]Residual Standard Deviation[/C][C]9.31539581111443[/C][/ROW]
[ROW][C]Sum Squared Residuals[/C][C]5206.5959470637[/C][/ROW]
[/TABLE]
Source: https://freestatistics.org/blog/index.php?pk=14460&T=3

Globally Unique Identifier (entire table): ba.freestatistics.org/blog/index.php?pk=14460&T=3

As an alternative you can also use a QR Code:  

The GUIDs for individual cells are displayed in the table below:

Multiple Linear Regression - Regression Statistics
Multiple R0.875387351584385
R-squared0.766303015313923
Adjusted R-squared0.719563618376708
F-TEST (value)16.3952268434976
F-TEST (DF numerator)12
F-TEST (DF denominator)60
p-value1.03250741290140e-14
Multiple Linear Regression - Residual Statistics
Residual Standard Deviation9.31539581111443
Sum Squared Residuals5206.5959470637


Multiple Linear Regression - Actuals, Interpolation, and Residuals
Time or IndexActualsInterpolationForecastResidualsPrediction Error
1140152.379652605459-12.3796526054593
2132139.456162117452-7.45616211745239
3117130.666666666667-13.6666666666667
4114128.021918941274-14.0219189412737
5113124.666666666667-11.6666666666667
6110123.210504549214-13.2105045492142
7107114.811414392060-7.81141439205963
8103110.644747725393-7.64474772539285
998105.311414392060-7.31141439205952
1098109.210504549214-11.2105045492143
11137143-6.00000000000002
12148145.8904052936312.10959470636889
13147146.2481389578160.751861042183654
14139145.587675765095-6.58767576509511
15130130.666666666667-0.666666666666664
16128128.021918941274-0.0219189412737837
17127124.6666666666672.33333333333333
18123123.210504549214-0.210504549214221
19118114.8114143920603.18858560794045
20114116.776261373036-2.77626137303555
21108105.3114143920602.68858560794044
22111109.2105045492141.78949545078580
231511438
24159152.0219189412746.97808105872622
25158146.24813895781611.7518610421837
26148139.4561621174528.54383788254755
27138130.6666666666677.33333333333334
28137128.0219189412748.97808105872621
29136124.66666666666711.3333333333333
30133123.2105045492149.78949545078578
31126120.9429280397025.05707196029781
32120110.6447477253939.3552522746071
33114105.3114143920608.68858560794044
34116109.2105045492146.78949545078579
3515314310
36162152.0219189412749.97808105872622
37161152.3796526054598.620347394541
38149145.5876757650953.41232423490489
39139130.6666666666678.33333333333334
40135128.0219189412746.97808105872621
41130124.6666666666675.33333333333333
42127123.2105045492143.78949545078578
43122114.8114143920607.18858560794046
44117110.6447477253936.3552522746071
45112105.3114143920606.68858560794044
46113109.2105045492143.78949545078579
471491436
48157152.0219189412744.97808105872621
49157146.24813895781610.7518610421837
50147139.4561621174527.54383788254755
51137130.6666666666676.33333333333333
52132128.0219189412743.97808105872621
53125124.6666666666670.333333333333333
54123117.0789909015725.92100909842843
55117114.8114143920602.18858560794045
56114110.6447477253933.3552522746071
57111111.442928039702-0.442928039702218
58112103.0789909015728.92100909842845
591441431.00000000000000
60150152.021918941274-2.02191894127378
61149146.2481389578162.75186104218366
62134139.456162117452-5.45616211745245
63123130.666666666667-7.66666666666666
64116121.890405293631-5.89040529363112
65117124.666666666667-7.66666666666667
66111117.078990901572-6.07899090157157
67105114.811414392060-9.81141439205955
68102110.644747725393-8.6447477253929
6995105.311414392060-10.3114143920596
7093103.078990901572-10.0789909015715
71124143-19
72130152.021918941274-22.0219189412738
73124146.248138957816-22.2481389578163

\begin{tabular}{lllllllll}
\hline
Multiple Linear Regression - Actuals, Interpolation, and Residuals \tabularnewline
Time or Index & Actuals & InterpolationForecast & ResidualsPrediction Error \tabularnewline
1 & 140 & 152.379652605459 & -12.3796526054593 \tabularnewline
2 & 132 & 139.456162117452 & -7.45616211745239 \tabularnewline
3 & 117 & 130.666666666667 & -13.6666666666667 \tabularnewline
4 & 114 & 128.021918941274 & -14.0219189412737 \tabularnewline
5 & 113 & 124.666666666667 & -11.6666666666667 \tabularnewline
6 & 110 & 123.210504549214 & -13.2105045492142 \tabularnewline
7 & 107 & 114.811414392060 & -7.81141439205963 \tabularnewline
8 & 103 & 110.644747725393 & -7.64474772539285 \tabularnewline
9 & 98 & 105.311414392060 & -7.31141439205952 \tabularnewline
10 & 98 & 109.210504549214 & -11.2105045492143 \tabularnewline
11 & 137 & 143 & -6.00000000000002 \tabularnewline
12 & 148 & 145.890405293631 & 2.10959470636889 \tabularnewline
13 & 147 & 146.248138957816 & 0.751861042183654 \tabularnewline
14 & 139 & 145.587675765095 & -6.58767576509511 \tabularnewline
15 & 130 & 130.666666666667 & -0.666666666666664 \tabularnewline
16 & 128 & 128.021918941274 & -0.0219189412737837 \tabularnewline
17 & 127 & 124.666666666667 & 2.33333333333333 \tabularnewline
18 & 123 & 123.210504549214 & -0.210504549214221 \tabularnewline
19 & 118 & 114.811414392060 & 3.18858560794045 \tabularnewline
20 & 114 & 116.776261373036 & -2.77626137303555 \tabularnewline
21 & 108 & 105.311414392060 & 2.68858560794044 \tabularnewline
22 & 111 & 109.210504549214 & 1.78949545078580 \tabularnewline
23 & 151 & 143 & 8 \tabularnewline
24 & 159 & 152.021918941274 & 6.97808105872622 \tabularnewline
25 & 158 & 146.248138957816 & 11.7518610421837 \tabularnewline
26 & 148 & 139.456162117452 & 8.54383788254755 \tabularnewline
27 & 138 & 130.666666666667 & 7.33333333333334 \tabularnewline
28 & 137 & 128.021918941274 & 8.97808105872621 \tabularnewline
29 & 136 & 124.666666666667 & 11.3333333333333 \tabularnewline
30 & 133 & 123.210504549214 & 9.78949545078578 \tabularnewline
31 & 126 & 120.942928039702 & 5.05707196029781 \tabularnewline
32 & 120 & 110.644747725393 & 9.3552522746071 \tabularnewline
33 & 114 & 105.311414392060 & 8.68858560794044 \tabularnewline
34 & 116 & 109.210504549214 & 6.78949545078579 \tabularnewline
35 & 153 & 143 & 10 \tabularnewline
36 & 162 & 152.021918941274 & 9.97808105872622 \tabularnewline
37 & 161 & 152.379652605459 & 8.620347394541 \tabularnewline
38 & 149 & 145.587675765095 & 3.41232423490489 \tabularnewline
39 & 139 & 130.666666666667 & 8.33333333333334 \tabularnewline
40 & 135 & 128.021918941274 & 6.97808105872621 \tabularnewline
41 & 130 & 124.666666666667 & 5.33333333333333 \tabularnewline
42 & 127 & 123.210504549214 & 3.78949545078578 \tabularnewline
43 & 122 & 114.811414392060 & 7.18858560794046 \tabularnewline
44 & 117 & 110.644747725393 & 6.3552522746071 \tabularnewline
45 & 112 & 105.311414392060 & 6.68858560794044 \tabularnewline
46 & 113 & 109.210504549214 & 3.78949545078579 \tabularnewline
47 & 149 & 143 & 6 \tabularnewline
48 & 157 & 152.021918941274 & 4.97808105872621 \tabularnewline
49 & 157 & 146.248138957816 & 10.7518610421837 \tabularnewline
50 & 147 & 139.456162117452 & 7.54383788254755 \tabularnewline
51 & 137 & 130.666666666667 & 6.33333333333333 \tabularnewline
52 & 132 & 128.021918941274 & 3.97808105872621 \tabularnewline
53 & 125 & 124.666666666667 & 0.333333333333333 \tabularnewline
54 & 123 & 117.078990901572 & 5.92100909842843 \tabularnewline
55 & 117 & 114.811414392060 & 2.18858560794045 \tabularnewline
56 & 114 & 110.644747725393 & 3.3552522746071 \tabularnewline
57 & 111 & 111.442928039702 & -0.442928039702218 \tabularnewline
58 & 112 & 103.078990901572 & 8.92100909842845 \tabularnewline
59 & 144 & 143 & 1.00000000000000 \tabularnewline
60 & 150 & 152.021918941274 & -2.02191894127378 \tabularnewline
61 & 149 & 146.248138957816 & 2.75186104218366 \tabularnewline
62 & 134 & 139.456162117452 & -5.45616211745245 \tabularnewline
63 & 123 & 130.666666666667 & -7.66666666666666 \tabularnewline
64 & 116 & 121.890405293631 & -5.89040529363112 \tabularnewline
65 & 117 & 124.666666666667 & -7.66666666666667 \tabularnewline
66 & 111 & 117.078990901572 & -6.07899090157157 \tabularnewline
67 & 105 & 114.811414392060 & -9.81141439205955 \tabularnewline
68 & 102 & 110.644747725393 & -8.6447477253929 \tabularnewline
69 & 95 & 105.311414392060 & -10.3114143920596 \tabularnewline
70 & 93 & 103.078990901572 & -10.0789909015715 \tabularnewline
71 & 124 & 143 & -19 \tabularnewline
72 & 130 & 152.021918941274 & -22.0219189412738 \tabularnewline
73 & 124 & 146.248138957816 & -22.2481389578163 \tabularnewline
\hline
\end{tabular}
%Source: https://freestatistics.org/blog/index.php?pk=14460&T=4

[TABLE]
[ROW][C]Multiple Linear Regression - Actuals, Interpolation, and Residuals[/C][/ROW]
[ROW][C]Time or Index[/C][C]Actuals[/C][C]InterpolationForecast[/C][C]ResidualsPrediction Error[/C][/ROW]
[ROW][C]1[/C][C]140[/C][C]152.379652605459[/C][C]-12.3796526054593[/C][/ROW]
[ROW][C]2[/C][C]132[/C][C]139.456162117452[/C][C]-7.45616211745239[/C][/ROW]
[ROW][C]3[/C][C]117[/C][C]130.666666666667[/C][C]-13.6666666666667[/C][/ROW]
[ROW][C]4[/C][C]114[/C][C]128.021918941274[/C][C]-14.0219189412737[/C][/ROW]
[ROW][C]5[/C][C]113[/C][C]124.666666666667[/C][C]-11.6666666666667[/C][/ROW]
[ROW][C]6[/C][C]110[/C][C]123.210504549214[/C][C]-13.2105045492142[/C][/ROW]
[ROW][C]7[/C][C]107[/C][C]114.811414392060[/C][C]-7.81141439205963[/C][/ROW]
[ROW][C]8[/C][C]103[/C][C]110.644747725393[/C][C]-7.64474772539285[/C][/ROW]
[ROW][C]9[/C][C]98[/C][C]105.311414392060[/C][C]-7.31141439205952[/C][/ROW]
[ROW][C]10[/C][C]98[/C][C]109.210504549214[/C][C]-11.2105045492143[/C][/ROW]
[ROW][C]11[/C][C]137[/C][C]143[/C][C]-6.00000000000002[/C][/ROW]
[ROW][C]12[/C][C]148[/C][C]145.890405293631[/C][C]2.10959470636889[/C][/ROW]
[ROW][C]13[/C][C]147[/C][C]146.248138957816[/C][C]0.751861042183654[/C][/ROW]
[ROW][C]14[/C][C]139[/C][C]145.587675765095[/C][C]-6.58767576509511[/C][/ROW]
[ROW][C]15[/C][C]130[/C][C]130.666666666667[/C][C]-0.666666666666664[/C][/ROW]
[ROW][C]16[/C][C]128[/C][C]128.021918941274[/C][C]-0.0219189412737837[/C][/ROW]
[ROW][C]17[/C][C]127[/C][C]124.666666666667[/C][C]2.33333333333333[/C][/ROW]
[ROW][C]18[/C][C]123[/C][C]123.210504549214[/C][C]-0.210504549214221[/C][/ROW]
[ROW][C]19[/C][C]118[/C][C]114.811414392060[/C][C]3.18858560794045[/C][/ROW]
[ROW][C]20[/C][C]114[/C][C]116.776261373036[/C][C]-2.77626137303555[/C][/ROW]
[ROW][C]21[/C][C]108[/C][C]105.311414392060[/C][C]2.68858560794044[/C][/ROW]
[ROW][C]22[/C][C]111[/C][C]109.210504549214[/C][C]1.78949545078580[/C][/ROW]
[ROW][C]23[/C][C]151[/C][C]143[/C][C]8[/C][/ROW]
[ROW][C]24[/C][C]159[/C][C]152.021918941274[/C][C]6.97808105872622[/C][/ROW]
[ROW][C]25[/C][C]158[/C][C]146.248138957816[/C][C]11.7518610421837[/C][/ROW]
[ROW][C]26[/C][C]148[/C][C]139.456162117452[/C][C]8.54383788254755[/C][/ROW]
[ROW][C]27[/C][C]138[/C][C]130.666666666667[/C][C]7.33333333333334[/C][/ROW]
[ROW][C]28[/C][C]137[/C][C]128.021918941274[/C][C]8.97808105872621[/C][/ROW]
[ROW][C]29[/C][C]136[/C][C]124.666666666667[/C][C]11.3333333333333[/C][/ROW]
[ROW][C]30[/C][C]133[/C][C]123.210504549214[/C][C]9.78949545078578[/C][/ROW]
[ROW][C]31[/C][C]126[/C][C]120.942928039702[/C][C]5.05707196029781[/C][/ROW]
[ROW][C]32[/C][C]120[/C][C]110.644747725393[/C][C]9.3552522746071[/C][/ROW]
[ROW][C]33[/C][C]114[/C][C]105.311414392060[/C][C]8.68858560794044[/C][/ROW]
[ROW][C]34[/C][C]116[/C][C]109.210504549214[/C][C]6.78949545078579[/C][/ROW]
[ROW][C]35[/C][C]153[/C][C]143[/C][C]10[/C][/ROW]
[ROW][C]36[/C][C]162[/C][C]152.021918941274[/C][C]9.97808105872622[/C][/ROW]
[ROW][C]37[/C][C]161[/C][C]152.379652605459[/C][C]8.620347394541[/C][/ROW]
[ROW][C]38[/C][C]149[/C][C]145.587675765095[/C][C]3.41232423490489[/C][/ROW]
[ROW][C]39[/C][C]139[/C][C]130.666666666667[/C][C]8.33333333333334[/C][/ROW]
[ROW][C]40[/C][C]135[/C][C]128.021918941274[/C][C]6.97808105872621[/C][/ROW]
[ROW][C]41[/C][C]130[/C][C]124.666666666667[/C][C]5.33333333333333[/C][/ROW]
[ROW][C]42[/C][C]127[/C][C]123.210504549214[/C][C]3.78949545078578[/C][/ROW]
[ROW][C]43[/C][C]122[/C][C]114.811414392060[/C][C]7.18858560794046[/C][/ROW]
[ROW][C]44[/C][C]117[/C][C]110.644747725393[/C][C]6.3552522746071[/C][/ROW]
[ROW][C]45[/C][C]112[/C][C]105.311414392060[/C][C]6.68858560794044[/C][/ROW]
[ROW][C]46[/C][C]113[/C][C]109.210504549214[/C][C]3.78949545078579[/C][/ROW]
[ROW][C]47[/C][C]149[/C][C]143[/C][C]6[/C][/ROW]
[ROW][C]48[/C][C]157[/C][C]152.021918941274[/C][C]4.97808105872621[/C][/ROW]
[ROW][C]49[/C][C]157[/C][C]146.248138957816[/C][C]10.7518610421837[/C][/ROW]
[ROW][C]50[/C][C]147[/C][C]139.456162117452[/C][C]7.54383788254755[/C][/ROW]
[ROW][C]51[/C][C]137[/C][C]130.666666666667[/C][C]6.33333333333333[/C][/ROW]
[ROW][C]52[/C][C]132[/C][C]128.021918941274[/C][C]3.97808105872621[/C][/ROW]
[ROW][C]53[/C][C]125[/C][C]124.666666666667[/C][C]0.333333333333333[/C][/ROW]
[ROW][C]54[/C][C]123[/C][C]117.078990901572[/C][C]5.92100909842843[/C][/ROW]
[ROW][C]55[/C][C]117[/C][C]114.811414392060[/C][C]2.18858560794045[/C][/ROW]
[ROW][C]56[/C][C]114[/C][C]110.644747725393[/C][C]3.3552522746071[/C][/ROW]
[ROW][C]57[/C][C]111[/C][C]111.442928039702[/C][C]-0.442928039702218[/C][/ROW]
[ROW][C]58[/C][C]112[/C][C]103.078990901572[/C][C]8.92100909842845[/C][/ROW]
[ROW][C]59[/C][C]144[/C][C]143[/C][C]1.00000000000000[/C][/ROW]
[ROW][C]60[/C][C]150[/C][C]152.021918941274[/C][C]-2.02191894127378[/C][/ROW]
[ROW][C]61[/C][C]149[/C][C]146.248138957816[/C][C]2.75186104218366[/C][/ROW]
[ROW][C]62[/C][C]134[/C][C]139.456162117452[/C][C]-5.45616211745245[/C][/ROW]
[ROW][C]63[/C][C]123[/C][C]130.666666666667[/C][C]-7.66666666666666[/C][/ROW]
[ROW][C]64[/C][C]116[/C][C]121.890405293631[/C][C]-5.89040529363112[/C][/ROW]
[ROW][C]65[/C][C]117[/C][C]124.666666666667[/C][C]-7.66666666666667[/C][/ROW]
[ROW][C]66[/C][C]111[/C][C]117.078990901572[/C][C]-6.07899090157157[/C][/ROW]
[ROW][C]67[/C][C]105[/C][C]114.811414392060[/C][C]-9.81141439205955[/C][/ROW]
[ROW][C]68[/C][C]102[/C][C]110.644747725393[/C][C]-8.6447477253929[/C][/ROW]
[ROW][C]69[/C][C]95[/C][C]105.311414392060[/C][C]-10.3114143920596[/C][/ROW]
[ROW][C]70[/C][C]93[/C][C]103.078990901572[/C][C]-10.0789909015715[/C][/ROW]
[ROW][C]71[/C][C]124[/C][C]143[/C][C]-19[/C][/ROW]
[ROW][C]72[/C][C]130[/C][C]152.021918941274[/C][C]-22.0219189412738[/C][/ROW]
[ROW][C]73[/C][C]124[/C][C]146.248138957816[/C][C]-22.2481389578163[/C][/ROW]
[/TABLE]
Source: https://freestatistics.org/blog/index.php?pk=14460&T=4

Globally Unique Identifier (entire table): ba.freestatistics.org/blog/index.php?pk=14460&T=4

As an alternative you can also use a QR Code:  

The GUIDs for individual cells are displayed in the table below:

Multiple Linear Regression - Actuals, Interpolation, and Residuals
Time or IndexActualsInterpolationForecastResidualsPrediction Error
1140152.379652605459-12.3796526054593
2132139.456162117452-7.45616211745239
3117130.666666666667-13.6666666666667
4114128.021918941274-14.0219189412737
5113124.666666666667-11.6666666666667
6110123.210504549214-13.2105045492142
7107114.811414392060-7.81141439205963
8103110.644747725393-7.64474772539285
998105.311414392060-7.31141439205952
1098109.210504549214-11.2105045492143
11137143-6.00000000000002
12148145.8904052936312.10959470636889
13147146.2481389578160.751861042183654
14139145.587675765095-6.58767576509511
15130130.666666666667-0.666666666666664
16128128.021918941274-0.0219189412737837
17127124.6666666666672.33333333333333
18123123.210504549214-0.210504549214221
19118114.8114143920603.18858560794045
20114116.776261373036-2.77626137303555
21108105.3114143920602.68858560794044
22111109.2105045492141.78949545078580
231511438
24159152.0219189412746.97808105872622
25158146.24813895781611.7518610421837
26148139.4561621174528.54383788254755
27138130.6666666666677.33333333333334
28137128.0219189412748.97808105872621
29136124.66666666666711.3333333333333
30133123.2105045492149.78949545078578
31126120.9429280397025.05707196029781
32120110.6447477253939.3552522746071
33114105.3114143920608.68858560794044
34116109.2105045492146.78949545078579
3515314310
36162152.0219189412749.97808105872622
37161152.3796526054598.620347394541
38149145.5876757650953.41232423490489
39139130.6666666666678.33333333333334
40135128.0219189412746.97808105872621
41130124.6666666666675.33333333333333
42127123.2105045492143.78949545078578
43122114.8114143920607.18858560794046
44117110.6447477253936.3552522746071
45112105.3114143920606.68858560794044
46113109.2105045492143.78949545078579
471491436
48157152.0219189412744.97808105872621
49157146.24813895781610.7518610421837
50147139.4561621174527.54383788254755
51137130.6666666666676.33333333333333
52132128.0219189412743.97808105872621
53125124.6666666666670.333333333333333
54123117.0789909015725.92100909842843
55117114.8114143920602.18858560794045
56114110.6447477253933.3552522746071
57111111.442928039702-0.442928039702218
58112103.0789909015728.92100909842845
591441431.00000000000000
60150152.021918941274-2.02191894127378
61149146.2481389578162.75186104218366
62134139.456162117452-5.45616211745245
63123130.666666666667-7.66666666666666
64116121.890405293631-5.89040529363112
65117124.666666666667-7.66666666666667
66111117.078990901572-6.07899090157157
67105114.811414392060-9.81141439205955
68102110.644747725393-8.6447477253929
6995105.311414392060-10.3114143920596
7093103.078990901572-10.0789909015715
71124143-19
72130152.021918941274-22.0219189412738
73124146.248138957816-22.2481389578163


Parameters (Session):
par1 = 1 ; par2 = Include Monthly Dummies ; par3 = Linear Trend ;
Parameters (R input):
par1 = 1 ; par2 = Include Monthly Dummies ; par3 = No Linear Trend ;
R code (references can be found in the software module):
library(lattice)
par1 <- as.numeric(par1)
x <- t(y)
k <- length(x[1,])
n <- length(x[,1])
x1 <- cbind(x[,par1], x[,1:k!=par1])
mycolnames <- c(colnames(x)[par1], colnames(x)[1:k!=par1])
colnames(x1) <- mycolnames #colnames(x)[par1]
x <- x1
if (par3 == 'First Differences'){
x2 <- array(0, dim=c(n-1,k), dimnames=list(1:(n-1), paste('(1-B)',colnames(x),sep='')))
for (i in 1:n-1) {
for (j in 1:k) {
x2[i,j] <- x[i+1,j] - x[i,j]
}
}
x <- x2
}
if (par2 == 'Include Monthly Dummies'){
x2 <- array(0, dim=c(n,11), dimnames=list(1:n, paste('M', seq(1:11), sep ='')))
for (i in 1:11){
x2[seq(i,n,12),i] <- 1
}
x <- cbind(x, x2)
}
if (par2 == 'Include Quarterly Dummies'){
x2 <- array(0, dim=c(n,3), dimnames=list(1:n, paste('Q', seq(1:3), sep ='')))
for (i in 1:3){
x2[seq(i,n,4),i] <- 1
}
x <- cbind(x, x2)
}
k <- length(x[1,])
if (par3 == 'Linear Trend'){
x <- cbind(x, c(1:n))
colnames(x)[k+1] <- 't'
}
x
k <- length(x[1,])
df <- as.data.frame(x)
(mylm <- lm(df))
(mysum <- summary(mylm))
bitmap(file='test0.png')
plot(x[,1], type='l', main='Actuals and Interpolation', ylab='value of Actuals and Interpolation (dots)', xlab='time or index')
points(x[,1]-mysum$resid)
grid()
dev.off()
bitmap(file='test1.png')
plot(mysum$resid, type='b', pch=19, main='Residuals', ylab='value of Residuals', xlab='time or index')
grid()
dev.off()
bitmap(file='test2.png')
hist(mysum$resid, main='Residual Histogram', xlab='values of Residuals')
grid()
dev.off()
bitmap(file='test3.png')
densityplot(~mysum$resid,col='black',main='Residual Density Plot', xlab='values of Residuals')
dev.off()
bitmap(file='test4.png')
qqnorm(mysum$resid, main='Residual Normal Q-Q Plot')
grid()
dev.off()
(myerror <- as.ts(mysum$resid))
bitmap(file='test5.png')
dum <- cbind(lag(myerror,k=1),myerror)
dum
dum1 <- dum[2:length(myerror),]
dum1
z <- as.data.frame(dum1)
z
plot(z,main=paste('Residual Lag plot, lowess, and regression line'), ylab='values of Residuals', xlab='lagged values of Residuals')
lines(lowess(z))
abline(lm(z))
grid()
dev.off()
bitmap(file='test6.png')
acf(mysum$resid, lag.max=length(mysum$resid)/2, main='Residual Autocorrelation Function')
grid()
dev.off()
bitmap(file='test7.png')
pacf(mysum$resid, lag.max=length(mysum$resid)/2, main='Residual Partial Autocorrelation Function')
grid()
dev.off()
bitmap(file='test8.png')
opar <- par(mfrow = c(2,2), oma = c(0, 0, 1.1, 0))
plot(mylm, las = 1, sub='Residual Diagnostics')
par(opar)
dev.off()
load(file='createtable')
a<-table.start()
a<-table.row.start(a)
a<-table.element(a, 'Multiple Linear Regression - Estimated Regression Equation', 1, TRUE)
a<-table.row.end(a)
myeq <- colnames(x)[1]
myeq <- paste(myeq, '[t] = ', sep='')
for (i in 1:k){
if (mysum$coefficients[i,1] > 0) myeq <- paste(myeq, '+', '')
myeq <- paste(myeq, mysum$coefficients[i,1], sep=' ')
if (rownames(mysum$coefficients)[i] != '(Intercept)') {
myeq <- paste(myeq, rownames(mysum$coefficients)[i], sep='')
if (rownames(mysum$coefficients)[i] != 't') myeq <- paste(myeq, '[t]', sep='')
}
}
myeq <- paste(myeq, ' + e[t]')
a<-table.row.start(a)
a<-table.element(a, myeq)
a<-table.row.end(a)
a<-table.end(a)
table.save(a,file='mytable1.tab')
a<-table.start()
a<-table.row.start(a)
a<-table.element(a,hyperlink('ols1.htm','Multiple Linear Regression - Ordinary Least Squares',''), 6, TRUE)
a<-table.row.end(a)
a<-table.row.start(a)
a<-table.element(a,'Variable',header=TRUE)
a<-table.element(a,'Parameter',header=TRUE)
a<-table.element(a,'S.D.',header=TRUE)
a<-table.element(a,'T-STAT
H0: parameter = 0',header=TRUE)
a<-table.element(a,'2-tail p-value',header=TRUE)
a<-table.element(a,'1-tail p-value',header=TRUE)
a<-table.row.end(a)
for (i in 1:k){
a<-table.row.start(a)
a<-table.element(a,rownames(mysum$coefficients)[i],header=TRUE)
a<-table.element(a,mysum$coefficients[i,1])
a<-table.element(a, round(mysum$coefficients[i,2],6))
a<-table.element(a, round(mysum$coefficients[i,3],4))
a<-table.element(a, round(mysum$coefficients[i,4],6))
a<-table.element(a, round(mysum$coefficients[i,4]/2,6))
a<-table.row.end(a)
}
a<-table.end(a)
table.save(a,file='mytable2.tab')
a<-table.start()
a<-table.row.start(a)
a<-table.element(a, 'Multiple Linear Regression - Regression Statistics', 2, TRUE)
a<-table.row.end(a)
a<-table.row.start(a)
a<-table.element(a, 'Multiple R',1,TRUE)
a<-table.element(a, sqrt(mysum$r.squared))
a<-table.row.end(a)
a<-table.row.start(a)
a<-table.element(a, 'R-squared',1,TRUE)
a<-table.element(a, mysum$r.squared)
a<-table.row.end(a)
a<-table.row.start(a)
a<-table.element(a, 'Adjusted R-squared',1,TRUE)
a<-table.element(a, mysum$adj.r.squared)
a<-table.row.end(a)
a<-table.row.start(a)
a<-table.element(a, 'F-TEST (value)',1,TRUE)
a<-table.element(a, mysum$fstatistic[1])
a<-table.row.end(a)
a<-table.row.start(a)
a<-table.element(a, 'F-TEST (DF numerator)',1,TRUE)
a<-table.element(a, mysum$fstatistic[2])
a<-table.row.end(a)
a<-table.row.start(a)
a<-table.element(a, 'F-TEST (DF denominator)',1,TRUE)
a<-table.element(a, mysum$fstatistic[3])
a<-table.row.end(a)
a<-table.row.start(a)
a<-table.element(a, 'p-value',1,TRUE)
a<-table.element(a, 1-pf(mysum$fstatistic[1],mysum$fstatistic[2],mysum$fstatistic[3]))
a<-table.row.end(a)
a<-table.row.start(a)
a<-table.element(a, 'Multiple Linear Regression - Residual Statistics', 2, TRUE)
a<-table.row.end(a)
a<-table.row.start(a)
a<-table.element(a, 'Residual Standard Deviation',1,TRUE)
a<-table.element(a, mysum$sigma)
a<-table.row.end(a)
a<-table.row.start(a)
a<-table.element(a, 'Sum Squared Residuals',1,TRUE)
a<-table.element(a, sum(myerror*myerror))
a<-table.row.end(a)
a<-table.end(a)
table.save(a,file='mytable3.tab')
a<-table.start()
a<-table.row.start(a)
a<-table.element(a, 'Multiple Linear Regression - Actuals, Interpolation, and Residuals', 4, TRUE)
a<-table.row.end(a)
a<-table.row.start(a)
a<-table.element(a, 'Time or Index', 1, TRUE)
a<-table.element(a, 'Actuals', 1, TRUE)
a<-table.element(a, 'Interpolation
Forecast', 1, TRUE)
a<-table.element(a, 'Residuals
Prediction Error', 1, TRUE)
a<-table.row.end(a)
for (i in 1:n) {
a<-table.row.start(a)
a<-table.element(a,i, 1, TRUE)
a<-table.element(a,x[i])
a<-table.element(a,x[i]-mysum$resid[i])
a<-table.element(a,mysum$resid[i])
a<-table.row.end(a)
}
a<-table.end(a)
table.save(a,file='mytable4.tab')