Free Statistics

of Irreproducible Research!

Author's title

Author*Unverified author*
R Software Modulerwasp_multipleregression.wasp
Title produced by softwareMultiple Regression
Date of computationThu, 15 Nov 2007 07:14:36 -0700
Cite this page as followsStatistical Computations at FreeStatistics.org, Office for Research Development and Education, URL https://freestatistics.org/blog/index.php?v=date/2007/Nov/15/t1195135995p82g5u78j8h7hp1.htm/, Retrieved Sat, 04 May 2024 08:12:57 +0000
Statistical Computations at FreeStatistics.org, Office for Research Development and Education, URL https://freestatistics.org/blog/index.php?pk=5455, Retrieved Sat, 04 May 2024 08:12:57 +0000
QR Codes:

Original text written by user:
IsPrivate?No (this computation is public)
User-defined keywords
Estimated Impact226
Family? (F = Feedback message, R = changed R code, M = changed R Module, P = changed Parameters, D = changed Data)
-       [Multiple Regression] [WS 8 - Q3 (2)] [2007-11-15 14:14:36] [52c41ae5b11545a88aa57081ae5e5ffc] [Current]
Feedback Forum

Post a new message
Dataseries X:
8.7	0
8.5	0
8.2	0
8.3	0
8	0
8.1	0
8.7	0
9.3	0
8.9	0
8.8	0
8.4	0
8.4	0
7.3	0
7.2	0
7	0
7	0
6.9	0
6.9	0
7.1	0
7.5	0
7.4	0
8.9	0
8.3	1
8.3	0
9	0
8.9	0
8.8	0
7.8	0
7.8	0
7.8	0
9.2	0
9.3	0
9.2	0
8.6	0
8.5	0
8.5	0
9	0
9	0
8.8	0
8	0
7.9	0
8.1	0
9.3	0
9.4	0
9.4	0
9.3	1
9	0
9.1	0
9.7	0
9.7	0
9.6	0
8.3	0
8.2	0
8.4	0
10.6	0
10.9	0
10.9	0
9.6	0
9.3	0
9.3	0
9.6	0
9.5	0
9.5	0
9	0
8.9	0
9	0
10.1	0
10.2	0
10.2	0
9.5	0
9.3	0
9.3	0
9.4	0
9.3	0
9.1	0
9	0
8.9	0
9	0
9.8	0
10	0
9.8	0
9.4	0
9	1
8.9	0
9.3	0
9.1	0
8.8	0
8.9	1
8.7	0
8.6	0
9.1	0
9.3	0
8.9	0


Summary of compuational transaction
Raw Inputview raw input (R code)
Raw Outputview raw output of R engine
Computing time3 seconds
R Server'Gwilym Jenkins' @ 72.249.127.135

\begin{tabular}{lllllllll}
\hline
Summary of compuational transaction \tabularnewline
Raw Input & view raw input (R code)  \tabularnewline
Raw Output & view raw output of R engine  \tabularnewline
Computing time & 3 seconds \tabularnewline
R Server & 'Gwilym Jenkins' @ 72.249.127.135 \tabularnewline
\hline
\end{tabular}
%Source: https://freestatistics.org/blog/index.php?pk=5455&T=0

[TABLE]
[ROW][C]Summary of compuational transaction[/C][/ROW]
[ROW][C]Raw Input[/C][C]view raw input (R code) [/C][/ROW]
[ROW][C]Raw Output[/C][C]view raw output of R engine [/C][/ROW]
[ROW][C]Computing time[/C][C]3 seconds[/C][/ROW]
[ROW][C]R Server[/C][C]'Gwilym Jenkins' @ 72.249.127.135[/C][/ROW]
[/TABLE]
Source: https://freestatistics.org/blog/index.php?pk=5455&T=0

Globally Unique Identifier (entire table): ba.freestatistics.org/blog/index.php?pk=5455&T=0

As an alternative you can also use a QR Code:  

The GUIDs for individual cells are displayed in the table below:

Summary of compuational transaction
Raw Inputview raw input (R code)
Raw Outputview raw output of R engine
Computing time3 seconds
R Server'Gwilym Jenkins' @ 72.249.127.135


Multiple Linear Regression - Estimated Regression Equation
Vrouw[t] = + 8.82857142857143 + 0.125988700564972x[t] + 0.171428571428568M1[t] + 0.0714285714285723M2[t] -0.103571428571428M3[t] -0.55682001614205M4[t] -0.666071428571428M5[t] -0.591071428571429M6[t] + 0.408928571428572M7[t] + 0.658928571428573M8[t] + 0.508928571428572M9[t] + 0.310573042776433M10[t] -0.0359967715899913M11[t] + e[t]

\begin{tabular}{lllllllll}
\hline
Multiple Linear Regression - Estimated Regression Equation \tabularnewline
Vrouw[t] =  +  8.82857142857143 +  0.125988700564972x[t] +  0.171428571428568M1[t] +  0.0714285714285723M2[t] -0.103571428571428M3[t] -0.55682001614205M4[t] -0.666071428571428M5[t] -0.591071428571429M6[t] +  0.408928571428572M7[t] +  0.658928571428573M8[t] +  0.508928571428572M9[t] +  0.310573042776433M10[t] -0.0359967715899913M11[t]  + e[t] \tabularnewline
\hline
\end{tabular}
%Source: https://freestatistics.org/blog/index.php?pk=5455&T=1

[TABLE]
[ROW][C]Multiple Linear Regression - Estimated Regression Equation[/C][/ROW]
[ROW][C]Vrouw[t] =  +  8.82857142857143 +  0.125988700564972x[t] +  0.171428571428568M1[t] +  0.0714285714285723M2[t] -0.103571428571428M3[t] -0.55682001614205M4[t] -0.666071428571428M5[t] -0.591071428571429M6[t] +  0.408928571428572M7[t] +  0.658928571428573M8[t] +  0.508928571428572M9[t] +  0.310573042776433M10[t] -0.0359967715899913M11[t]  + e[t][/C][/ROW]
[/TABLE]
Source: https://freestatistics.org/blog/index.php?pk=5455&T=1

Globally Unique Identifier (entire table): ba.freestatistics.org/blog/index.php?pk=5455&T=1

As an alternative you can also use a QR Code:  

The GUIDs for individual cells are displayed in the table below:

Multiple Linear Regression - Estimated Regression Equation
Vrouw[t] = + 8.82857142857143 + 0.125988700564972x[t] + 0.171428571428568M1[t] + 0.0714285714285723M2[t] -0.103571428571428M3[t] -0.55682001614205M4[t] -0.666071428571428M5[t] -0.591071428571429M6[t] + 0.408928571428572M7[t] + 0.658928571428573M8[t] + 0.508928571428572M9[t] + 0.310573042776433M10[t] -0.0359967715899913M11[t] + e[t]


Multiple Linear Regression - Ordinary Least Squares
VariableParameterS.D.T-STATH0: parameter = 02-tail p-value1-tail p-value
(Intercept)8.828571428571430.29344930.085500
x0.1259887005649720.4367070.28850.7737120.386856
M10.1714285714285680.4018220.42660.6707960.335398
M20.07142857142857230.4018220.17780.859360.42968
M3-0.1035714285714280.401822-0.25780.7972580.398629
M4-0.556820016142050.405513-1.37310.173550.086775
M5-0.6660714285714280.401822-1.65760.1013090.050655
M6-0.5910714285714290.401822-1.4710.145220.07261
M70.4089285714285720.4018221.01770.3118950.155948
M80.6589285714285730.4018221.63990.1049630.052481
M90.5089285714285720.4018221.26660.2089910.104495
M100.3105730427764330.4196630.74010.4614340.230717
M11-0.03599677158999130.433352-0.08310.9340070.467003

\begin{tabular}{lllllllll}
\hline
Multiple Linear Regression - Ordinary Least Squares \tabularnewline
Variable & Parameter & S.D. & T-STATH0: parameter = 0 & 2-tail p-value & 1-tail p-value \tabularnewline
(Intercept) & 8.82857142857143 & 0.293449 & 30.0855 & 0 & 0 \tabularnewline
x & 0.125988700564972 & 0.436707 & 0.2885 & 0.773712 & 0.386856 \tabularnewline
M1 & 0.171428571428568 & 0.401822 & 0.4266 & 0.670796 & 0.335398 \tabularnewline
M2 & 0.0714285714285723 & 0.401822 & 0.1778 & 0.85936 & 0.42968 \tabularnewline
M3 & -0.103571428571428 & 0.401822 & -0.2578 & 0.797258 & 0.398629 \tabularnewline
M4 & -0.55682001614205 & 0.405513 & -1.3731 & 0.17355 & 0.086775 \tabularnewline
M5 & -0.666071428571428 & 0.401822 & -1.6576 & 0.101309 & 0.050655 \tabularnewline
M6 & -0.591071428571429 & 0.401822 & -1.471 & 0.14522 & 0.07261 \tabularnewline
M7 & 0.408928571428572 & 0.401822 & 1.0177 & 0.311895 & 0.155948 \tabularnewline
M8 & 0.658928571428573 & 0.401822 & 1.6399 & 0.104963 & 0.052481 \tabularnewline
M9 & 0.508928571428572 & 0.401822 & 1.2666 & 0.208991 & 0.104495 \tabularnewline
M10 & 0.310573042776433 & 0.419663 & 0.7401 & 0.461434 & 0.230717 \tabularnewline
M11 & -0.0359967715899913 & 0.433352 & -0.0831 & 0.934007 & 0.467003 \tabularnewline
\hline
\end{tabular}
%Source: https://freestatistics.org/blog/index.php?pk=5455&T=2

[TABLE]
[ROW][C]Multiple Linear Regression - Ordinary Least Squares[/C][/ROW]
[ROW][C]Variable[/C][C]Parameter[/C][C]S.D.[/C][C]T-STATH0: parameter = 0[/C][C]2-tail p-value[/C][C]1-tail p-value[/C][/ROW]
[ROW][C](Intercept)[/C][C]8.82857142857143[/C][C]0.293449[/C][C]30.0855[/C][C]0[/C][C]0[/C][/ROW]
[ROW][C]x[/C][C]0.125988700564972[/C][C]0.436707[/C][C]0.2885[/C][C]0.773712[/C][C]0.386856[/C][/ROW]
[ROW][C]M1[/C][C]0.171428571428568[/C][C]0.401822[/C][C]0.4266[/C][C]0.670796[/C][C]0.335398[/C][/ROW]
[ROW][C]M2[/C][C]0.0714285714285723[/C][C]0.401822[/C][C]0.1778[/C][C]0.85936[/C][C]0.42968[/C][/ROW]
[ROW][C]M3[/C][C]-0.103571428571428[/C][C]0.401822[/C][C]-0.2578[/C][C]0.797258[/C][C]0.398629[/C][/ROW]
[ROW][C]M4[/C][C]-0.55682001614205[/C][C]0.405513[/C][C]-1.3731[/C][C]0.17355[/C][C]0.086775[/C][/ROW]
[ROW][C]M5[/C][C]-0.666071428571428[/C][C]0.401822[/C][C]-1.6576[/C][C]0.101309[/C][C]0.050655[/C][/ROW]
[ROW][C]M6[/C][C]-0.591071428571429[/C][C]0.401822[/C][C]-1.471[/C][C]0.14522[/C][C]0.07261[/C][/ROW]
[ROW][C]M7[/C][C]0.408928571428572[/C][C]0.401822[/C][C]1.0177[/C][C]0.311895[/C][C]0.155948[/C][/ROW]
[ROW][C]M8[/C][C]0.658928571428573[/C][C]0.401822[/C][C]1.6399[/C][C]0.104963[/C][C]0.052481[/C][/ROW]
[ROW][C]M9[/C][C]0.508928571428572[/C][C]0.401822[/C][C]1.2666[/C][C]0.208991[/C][C]0.104495[/C][/ROW]
[ROW][C]M10[/C][C]0.310573042776433[/C][C]0.419663[/C][C]0.7401[/C][C]0.461434[/C][C]0.230717[/C][/ROW]
[ROW][C]M11[/C][C]-0.0359967715899913[/C][C]0.433352[/C][C]-0.0831[/C][C]0.934007[/C][C]0.467003[/C][/ROW]
[/TABLE]
Source: https://freestatistics.org/blog/index.php?pk=5455&T=2

Globally Unique Identifier (entire table): ba.freestatistics.org/blog/index.php?pk=5455&T=2

As an alternative you can also use a QR Code:  

The GUIDs for individual cells are displayed in the table below:

Multiple Linear Regression - Ordinary Least Squares
VariableParameterS.D.T-STATH0: parameter = 02-tail p-value1-tail p-value
(Intercept)8.828571428571430.29344930.085500
x0.1259887005649720.4367070.28850.7737120.386856
M10.1714285714285680.4018220.42660.6707960.335398
M20.07142857142857230.4018220.17780.859360.42968
M3-0.1035714285714280.401822-0.25780.7972580.398629
M4-0.556820016142050.405513-1.37310.173550.086775
M5-0.6660714285714280.401822-1.65760.1013090.050655
M6-0.5910714285714290.401822-1.4710.145220.07261
M70.4089285714285720.4018221.01770.3118950.155948
M80.6589285714285730.4018221.63990.1049630.052481
M90.5089285714285720.4018221.26660.2089910.104495
M100.3105730427764330.4196630.74010.4614340.230717
M11-0.03599677158999130.433352-0.08310.9340070.467003


Multiple Linear Regression - Regression Statistics
Multiple R0.507267902262373
R-squared0.257320724665668
Adjusted R-squared0.145918833365518
F-TEST (value)2.30984161635434
F-TEST (DF numerator)12
F-TEST (DF denominator)80
p-value0.0137721805425719
Multiple Linear Regression - Residual Statistics
Residual Standard Deviation0.776394260228902
Sum Squared Residuals48.2230437853107

\begin{tabular}{lllllllll}
\hline
Multiple Linear Regression - Regression Statistics \tabularnewline
Multiple R & 0.507267902262373 \tabularnewline
R-squared & 0.257320724665668 \tabularnewline
Adjusted R-squared & 0.145918833365518 \tabularnewline
F-TEST (value) & 2.30984161635434 \tabularnewline
F-TEST (DF numerator) & 12 \tabularnewline
F-TEST (DF denominator) & 80 \tabularnewline
p-value & 0.0137721805425719 \tabularnewline
Multiple Linear Regression - Residual Statistics \tabularnewline
Residual Standard Deviation & 0.776394260228902 \tabularnewline
Sum Squared Residuals & 48.2230437853107 \tabularnewline
\hline
\end{tabular}
%Source: https://freestatistics.org/blog/index.php?pk=5455&T=3

[TABLE]
[ROW][C]Multiple Linear Regression - Regression Statistics[/C][/ROW]
[ROW][C]Multiple R[/C][C]0.507267902262373[/C][/ROW]
[ROW][C]R-squared[/C][C]0.257320724665668[/C][/ROW]
[ROW][C]Adjusted R-squared[/C][C]0.145918833365518[/C][/ROW]
[ROW][C]F-TEST (value)[/C][C]2.30984161635434[/C][/ROW]
[ROW][C]F-TEST (DF numerator)[/C][C]12[/C][/ROW]
[ROW][C]F-TEST (DF denominator)[/C][C]80[/C][/ROW]
[ROW][C]p-value[/C][C]0.0137721805425719[/C][/ROW]
[ROW][C]Multiple Linear Regression - Residual Statistics[/C][/ROW]
[ROW][C]Residual Standard Deviation[/C][C]0.776394260228902[/C][/ROW]
[ROW][C]Sum Squared Residuals[/C][C]48.2230437853107[/C][/ROW]
[/TABLE]
Source: https://freestatistics.org/blog/index.php?pk=5455&T=3

Globally Unique Identifier (entire table): ba.freestatistics.org/blog/index.php?pk=5455&T=3

As an alternative you can also use a QR Code:  

The GUIDs for individual cells are displayed in the table below:

Multiple Linear Regression - Regression Statistics
Multiple R0.507267902262373
R-squared0.257320724665668
Adjusted R-squared0.145918833365518
F-TEST (value)2.30984161635434
F-TEST (DF numerator)12
F-TEST (DF denominator)80
p-value0.0137721805425719
Multiple Linear Regression - Residual Statistics
Residual Standard Deviation0.776394260228902
Sum Squared Residuals48.2230437853107


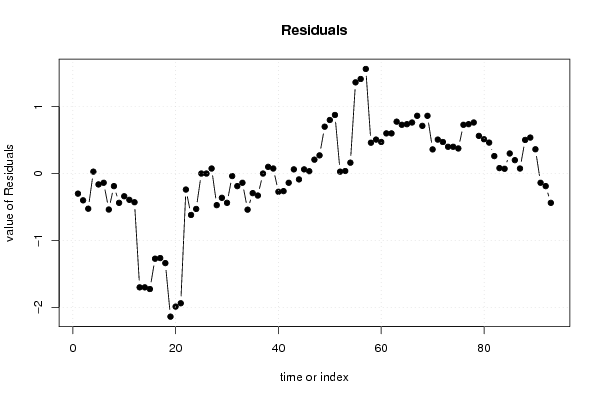
Multiple Linear Regression - Actuals, Interpolation, and Residuals
Time or IndexActualsInterpolationForecastResidualsPrediction Error
18.79.00000000000002-0.300000000000019
28.58.9-0.399999999999999
38.28.725-0.524999999999999
48.38.271751412429380.028248587570621
588.1625-0.1625
68.18.2375-0.137499999999999
78.79.2375-0.537500000000001
89.39.4875-0.187499999999997
98.99.3375-0.4375
108.89.13914447134786-0.339144471347862
118.48.79257465698144-0.392574656981437
128.48.82857142857143-0.428571428571428
137.39-1.70000000000000
147.28.9-1.7
1578.725-1.725
1678.27175141242938-1.27175141242938
176.98.1625-1.2625
186.98.2375-1.3375
197.19.2375-2.1375
207.59.4875-1.9875
217.49.3375-1.9375
228.99.13914447134786-0.239144471347861
238.38.9185633575464-0.618563357546409
248.38.82857142857143-0.528571428571428
25992.49106291150269e-15
268.98.91.52655665885959e-16
278.88.7250.0750000000000004
287.88.27175141242938-0.471751412429379
297.88.1625-0.3625
307.88.2375-0.4375
319.29.2375-0.0375000000000007
329.39.4875-0.1875
339.29.3375-0.137500000000001
348.69.13914447134786-0.539144471347861
358.58.79257465698144-0.292574656981437
368.58.82857142857143-0.328571428571428
37992.49106291150269e-15
3898.90.0999999999999998
398.88.7250.0750000000000004
4088.27175141242938-0.271751412429379
417.98.1625-0.262500000000000
428.18.2375-0.137500000000000
439.39.23750.0625000000000007
449.49.4875-0.0875000000000004
459.49.33750.0625000000000001
469.39.265133171912830.0348668280871676
4798.792574656981440.207425343018563
489.18.828571428571430.271428571428572
499.790.700000000000002
509.78.90.799999999999999
519.68.7250.875
528.38.271751412429380.0282485875706221
538.28.16250.0374999999999993
548.48.23750.162500000000000
5510.69.23751.3625
5610.99.48751.4125
5710.99.33751.5625
589.69.139144471347860.460855528652139
599.38.792574656981440.507425343018564
609.38.828571428571430.471428571428573
619.690.600000000000002
629.58.90.6
639.58.7250.775
6498.271751412429380.728248587570621
658.98.16250.7375
6698.23750.7625
6710.19.23750.8625
6810.29.48750.712499999999999
6910.29.33750.8625
709.59.139144471347860.360855528652139
719.38.792574656981440.507425343018564
729.38.828571428571430.471428571428573
739.490.400000000000003
749.38.90.400000000000000
759.18.7250.374999999999999
7698.271751412429380.728248587570621
778.98.16250.7375
7898.23750.7625
799.89.23750.562500000000001
80109.48750.512500000000000
819.89.33750.4625
829.49.139144471347860.260855528652139
8398.91856335754640.0814366424535907
848.98.828571428571430.0714285714285721
859.390.300000000000003
869.18.90.199999999999999
878.88.7250.0750000000000004
888.98.397740112994350.50225988700565
898.78.16250.537499999999999
908.68.23750.362499999999999
919.19.2375-0.137500000000000
929.39.4875-0.1875
938.99.3375-0.4375

\begin{tabular}{lllllllll}
\hline
Multiple Linear Regression - Actuals, Interpolation, and Residuals \tabularnewline
Time or Index & Actuals & InterpolationForecast & ResidualsPrediction Error \tabularnewline
1 & 8.7 & 9.00000000000002 & -0.300000000000019 \tabularnewline
2 & 8.5 & 8.9 & -0.399999999999999 \tabularnewline
3 & 8.2 & 8.725 & -0.524999999999999 \tabularnewline
4 & 8.3 & 8.27175141242938 & 0.028248587570621 \tabularnewline
5 & 8 & 8.1625 & -0.1625 \tabularnewline
6 & 8.1 & 8.2375 & -0.137499999999999 \tabularnewline
7 & 8.7 & 9.2375 & -0.537500000000001 \tabularnewline
8 & 9.3 & 9.4875 & -0.187499999999997 \tabularnewline
9 & 8.9 & 9.3375 & -0.4375 \tabularnewline
10 & 8.8 & 9.13914447134786 & -0.339144471347862 \tabularnewline
11 & 8.4 & 8.79257465698144 & -0.392574656981437 \tabularnewline
12 & 8.4 & 8.82857142857143 & -0.428571428571428 \tabularnewline
13 & 7.3 & 9 & -1.70000000000000 \tabularnewline
14 & 7.2 & 8.9 & -1.7 \tabularnewline
15 & 7 & 8.725 & -1.725 \tabularnewline
16 & 7 & 8.27175141242938 & -1.27175141242938 \tabularnewline
17 & 6.9 & 8.1625 & -1.2625 \tabularnewline
18 & 6.9 & 8.2375 & -1.3375 \tabularnewline
19 & 7.1 & 9.2375 & -2.1375 \tabularnewline
20 & 7.5 & 9.4875 & -1.9875 \tabularnewline
21 & 7.4 & 9.3375 & -1.9375 \tabularnewline
22 & 8.9 & 9.13914447134786 & -0.239144471347861 \tabularnewline
23 & 8.3 & 8.9185633575464 & -0.618563357546409 \tabularnewline
24 & 8.3 & 8.82857142857143 & -0.528571428571428 \tabularnewline
25 & 9 & 9 & 2.49106291150269e-15 \tabularnewline
26 & 8.9 & 8.9 & 1.52655665885959e-16 \tabularnewline
27 & 8.8 & 8.725 & 0.0750000000000004 \tabularnewline
28 & 7.8 & 8.27175141242938 & -0.471751412429379 \tabularnewline
29 & 7.8 & 8.1625 & -0.3625 \tabularnewline
30 & 7.8 & 8.2375 & -0.4375 \tabularnewline
31 & 9.2 & 9.2375 & -0.0375000000000007 \tabularnewline
32 & 9.3 & 9.4875 & -0.1875 \tabularnewline
33 & 9.2 & 9.3375 & -0.137500000000001 \tabularnewline
34 & 8.6 & 9.13914447134786 & -0.539144471347861 \tabularnewline
35 & 8.5 & 8.79257465698144 & -0.292574656981437 \tabularnewline
36 & 8.5 & 8.82857142857143 & -0.328571428571428 \tabularnewline
37 & 9 & 9 & 2.49106291150269e-15 \tabularnewline
38 & 9 & 8.9 & 0.0999999999999998 \tabularnewline
39 & 8.8 & 8.725 & 0.0750000000000004 \tabularnewline
40 & 8 & 8.27175141242938 & -0.271751412429379 \tabularnewline
41 & 7.9 & 8.1625 & -0.262500000000000 \tabularnewline
42 & 8.1 & 8.2375 & -0.137500000000000 \tabularnewline
43 & 9.3 & 9.2375 & 0.0625000000000007 \tabularnewline
44 & 9.4 & 9.4875 & -0.0875000000000004 \tabularnewline
45 & 9.4 & 9.3375 & 0.0625000000000001 \tabularnewline
46 & 9.3 & 9.26513317191283 & 0.0348668280871676 \tabularnewline
47 & 9 & 8.79257465698144 & 0.207425343018563 \tabularnewline
48 & 9.1 & 8.82857142857143 & 0.271428571428572 \tabularnewline
49 & 9.7 & 9 & 0.700000000000002 \tabularnewline
50 & 9.7 & 8.9 & 0.799999999999999 \tabularnewline
51 & 9.6 & 8.725 & 0.875 \tabularnewline
52 & 8.3 & 8.27175141242938 & 0.0282485875706221 \tabularnewline
53 & 8.2 & 8.1625 & 0.0374999999999993 \tabularnewline
54 & 8.4 & 8.2375 & 0.162500000000000 \tabularnewline
55 & 10.6 & 9.2375 & 1.3625 \tabularnewline
56 & 10.9 & 9.4875 & 1.4125 \tabularnewline
57 & 10.9 & 9.3375 & 1.5625 \tabularnewline
58 & 9.6 & 9.13914447134786 & 0.460855528652139 \tabularnewline
59 & 9.3 & 8.79257465698144 & 0.507425343018564 \tabularnewline
60 & 9.3 & 8.82857142857143 & 0.471428571428573 \tabularnewline
61 & 9.6 & 9 & 0.600000000000002 \tabularnewline
62 & 9.5 & 8.9 & 0.6 \tabularnewline
63 & 9.5 & 8.725 & 0.775 \tabularnewline
64 & 9 & 8.27175141242938 & 0.728248587570621 \tabularnewline
65 & 8.9 & 8.1625 & 0.7375 \tabularnewline
66 & 9 & 8.2375 & 0.7625 \tabularnewline
67 & 10.1 & 9.2375 & 0.8625 \tabularnewline
68 & 10.2 & 9.4875 & 0.712499999999999 \tabularnewline
69 & 10.2 & 9.3375 & 0.8625 \tabularnewline
70 & 9.5 & 9.13914447134786 & 0.360855528652139 \tabularnewline
71 & 9.3 & 8.79257465698144 & 0.507425343018564 \tabularnewline
72 & 9.3 & 8.82857142857143 & 0.471428571428573 \tabularnewline
73 & 9.4 & 9 & 0.400000000000003 \tabularnewline
74 & 9.3 & 8.9 & 0.400000000000000 \tabularnewline
75 & 9.1 & 8.725 & 0.374999999999999 \tabularnewline
76 & 9 & 8.27175141242938 & 0.728248587570621 \tabularnewline
77 & 8.9 & 8.1625 & 0.7375 \tabularnewline
78 & 9 & 8.2375 & 0.7625 \tabularnewline
79 & 9.8 & 9.2375 & 0.562500000000001 \tabularnewline
80 & 10 & 9.4875 & 0.512500000000000 \tabularnewline
81 & 9.8 & 9.3375 & 0.4625 \tabularnewline
82 & 9.4 & 9.13914447134786 & 0.260855528652139 \tabularnewline
83 & 9 & 8.9185633575464 & 0.0814366424535907 \tabularnewline
84 & 8.9 & 8.82857142857143 & 0.0714285714285721 \tabularnewline
85 & 9.3 & 9 & 0.300000000000003 \tabularnewline
86 & 9.1 & 8.9 & 0.199999999999999 \tabularnewline
87 & 8.8 & 8.725 & 0.0750000000000004 \tabularnewline
88 & 8.9 & 8.39774011299435 & 0.50225988700565 \tabularnewline
89 & 8.7 & 8.1625 & 0.537499999999999 \tabularnewline
90 & 8.6 & 8.2375 & 0.362499999999999 \tabularnewline
91 & 9.1 & 9.2375 & -0.137500000000000 \tabularnewline
92 & 9.3 & 9.4875 & -0.1875 \tabularnewline
93 & 8.9 & 9.3375 & -0.4375 \tabularnewline
\hline
\end{tabular}
%Source: https://freestatistics.org/blog/index.php?pk=5455&T=4

[TABLE]
[ROW][C]Multiple Linear Regression - Actuals, Interpolation, and Residuals[/C][/ROW]
[ROW][C]Time or Index[/C][C]Actuals[/C][C]InterpolationForecast[/C][C]ResidualsPrediction Error[/C][/ROW]
[ROW][C]1[/C][C]8.7[/C][C]9.00000000000002[/C][C]-0.300000000000019[/C][/ROW]
[ROW][C]2[/C][C]8.5[/C][C]8.9[/C][C]-0.399999999999999[/C][/ROW]
[ROW][C]3[/C][C]8.2[/C][C]8.725[/C][C]-0.524999999999999[/C][/ROW]
[ROW][C]4[/C][C]8.3[/C][C]8.27175141242938[/C][C]0.028248587570621[/C][/ROW]
[ROW][C]5[/C][C]8[/C][C]8.1625[/C][C]-0.1625[/C][/ROW]
[ROW][C]6[/C][C]8.1[/C][C]8.2375[/C][C]-0.137499999999999[/C][/ROW]
[ROW][C]7[/C][C]8.7[/C][C]9.2375[/C][C]-0.537500000000001[/C][/ROW]
[ROW][C]8[/C][C]9.3[/C][C]9.4875[/C][C]-0.187499999999997[/C][/ROW]
[ROW][C]9[/C][C]8.9[/C][C]9.3375[/C][C]-0.4375[/C][/ROW]
[ROW][C]10[/C][C]8.8[/C][C]9.13914447134786[/C][C]-0.339144471347862[/C][/ROW]
[ROW][C]11[/C][C]8.4[/C][C]8.79257465698144[/C][C]-0.392574656981437[/C][/ROW]
[ROW][C]12[/C][C]8.4[/C][C]8.82857142857143[/C][C]-0.428571428571428[/C][/ROW]
[ROW][C]13[/C][C]7.3[/C][C]9[/C][C]-1.70000000000000[/C][/ROW]
[ROW][C]14[/C][C]7.2[/C][C]8.9[/C][C]-1.7[/C][/ROW]
[ROW][C]15[/C][C]7[/C][C]8.725[/C][C]-1.725[/C][/ROW]
[ROW][C]16[/C][C]7[/C][C]8.27175141242938[/C][C]-1.27175141242938[/C][/ROW]
[ROW][C]17[/C][C]6.9[/C][C]8.1625[/C][C]-1.2625[/C][/ROW]
[ROW][C]18[/C][C]6.9[/C][C]8.2375[/C][C]-1.3375[/C][/ROW]
[ROW][C]19[/C][C]7.1[/C][C]9.2375[/C][C]-2.1375[/C][/ROW]
[ROW][C]20[/C][C]7.5[/C][C]9.4875[/C][C]-1.9875[/C][/ROW]
[ROW][C]21[/C][C]7.4[/C][C]9.3375[/C][C]-1.9375[/C][/ROW]
[ROW][C]22[/C][C]8.9[/C][C]9.13914447134786[/C][C]-0.239144471347861[/C][/ROW]
[ROW][C]23[/C][C]8.3[/C][C]8.9185633575464[/C][C]-0.618563357546409[/C][/ROW]
[ROW][C]24[/C][C]8.3[/C][C]8.82857142857143[/C][C]-0.528571428571428[/C][/ROW]
[ROW][C]25[/C][C]9[/C][C]9[/C][C]2.49106291150269e-15[/C][/ROW]
[ROW][C]26[/C][C]8.9[/C][C]8.9[/C][C]1.52655665885959e-16[/C][/ROW]
[ROW][C]27[/C][C]8.8[/C][C]8.725[/C][C]0.0750000000000004[/C][/ROW]
[ROW][C]28[/C][C]7.8[/C][C]8.27175141242938[/C][C]-0.471751412429379[/C][/ROW]
[ROW][C]29[/C][C]7.8[/C][C]8.1625[/C][C]-0.3625[/C][/ROW]
[ROW][C]30[/C][C]7.8[/C][C]8.2375[/C][C]-0.4375[/C][/ROW]
[ROW][C]31[/C][C]9.2[/C][C]9.2375[/C][C]-0.0375000000000007[/C][/ROW]
[ROW][C]32[/C][C]9.3[/C][C]9.4875[/C][C]-0.1875[/C][/ROW]
[ROW][C]33[/C][C]9.2[/C][C]9.3375[/C][C]-0.137500000000001[/C][/ROW]
[ROW][C]34[/C][C]8.6[/C][C]9.13914447134786[/C][C]-0.539144471347861[/C][/ROW]
[ROW][C]35[/C][C]8.5[/C][C]8.79257465698144[/C][C]-0.292574656981437[/C][/ROW]
[ROW][C]36[/C][C]8.5[/C][C]8.82857142857143[/C][C]-0.328571428571428[/C][/ROW]
[ROW][C]37[/C][C]9[/C][C]9[/C][C]2.49106291150269e-15[/C][/ROW]
[ROW][C]38[/C][C]9[/C][C]8.9[/C][C]0.0999999999999998[/C][/ROW]
[ROW][C]39[/C][C]8.8[/C][C]8.725[/C][C]0.0750000000000004[/C][/ROW]
[ROW][C]40[/C][C]8[/C][C]8.27175141242938[/C][C]-0.271751412429379[/C][/ROW]
[ROW][C]41[/C][C]7.9[/C][C]8.1625[/C][C]-0.262500000000000[/C][/ROW]
[ROW][C]42[/C][C]8.1[/C][C]8.2375[/C][C]-0.137500000000000[/C][/ROW]
[ROW][C]43[/C][C]9.3[/C][C]9.2375[/C][C]0.0625000000000007[/C][/ROW]
[ROW][C]44[/C][C]9.4[/C][C]9.4875[/C][C]-0.0875000000000004[/C][/ROW]
[ROW][C]45[/C][C]9.4[/C][C]9.3375[/C][C]0.0625000000000001[/C][/ROW]
[ROW][C]46[/C][C]9.3[/C][C]9.26513317191283[/C][C]0.0348668280871676[/C][/ROW]
[ROW][C]47[/C][C]9[/C][C]8.79257465698144[/C][C]0.207425343018563[/C][/ROW]
[ROW][C]48[/C][C]9.1[/C][C]8.82857142857143[/C][C]0.271428571428572[/C][/ROW]
[ROW][C]49[/C][C]9.7[/C][C]9[/C][C]0.700000000000002[/C][/ROW]
[ROW][C]50[/C][C]9.7[/C][C]8.9[/C][C]0.799999999999999[/C][/ROW]
[ROW][C]51[/C][C]9.6[/C][C]8.725[/C][C]0.875[/C][/ROW]
[ROW][C]52[/C][C]8.3[/C][C]8.27175141242938[/C][C]0.0282485875706221[/C][/ROW]
[ROW][C]53[/C][C]8.2[/C][C]8.1625[/C][C]0.0374999999999993[/C][/ROW]
[ROW][C]54[/C][C]8.4[/C][C]8.2375[/C][C]0.162500000000000[/C][/ROW]
[ROW][C]55[/C][C]10.6[/C][C]9.2375[/C][C]1.3625[/C][/ROW]
[ROW][C]56[/C][C]10.9[/C][C]9.4875[/C][C]1.4125[/C][/ROW]
[ROW][C]57[/C][C]10.9[/C][C]9.3375[/C][C]1.5625[/C][/ROW]
[ROW][C]58[/C][C]9.6[/C][C]9.13914447134786[/C][C]0.460855528652139[/C][/ROW]
[ROW][C]59[/C][C]9.3[/C][C]8.79257465698144[/C][C]0.507425343018564[/C][/ROW]
[ROW][C]60[/C][C]9.3[/C][C]8.82857142857143[/C][C]0.471428571428573[/C][/ROW]
[ROW][C]61[/C][C]9.6[/C][C]9[/C][C]0.600000000000002[/C][/ROW]
[ROW][C]62[/C][C]9.5[/C][C]8.9[/C][C]0.6[/C][/ROW]
[ROW][C]63[/C][C]9.5[/C][C]8.725[/C][C]0.775[/C][/ROW]
[ROW][C]64[/C][C]9[/C][C]8.27175141242938[/C][C]0.728248587570621[/C][/ROW]
[ROW][C]65[/C][C]8.9[/C][C]8.1625[/C][C]0.7375[/C][/ROW]
[ROW][C]66[/C][C]9[/C][C]8.2375[/C][C]0.7625[/C][/ROW]
[ROW][C]67[/C][C]10.1[/C][C]9.2375[/C][C]0.8625[/C][/ROW]
[ROW][C]68[/C][C]10.2[/C][C]9.4875[/C][C]0.712499999999999[/C][/ROW]
[ROW][C]69[/C][C]10.2[/C][C]9.3375[/C][C]0.8625[/C][/ROW]
[ROW][C]70[/C][C]9.5[/C][C]9.13914447134786[/C][C]0.360855528652139[/C][/ROW]
[ROW][C]71[/C][C]9.3[/C][C]8.79257465698144[/C][C]0.507425343018564[/C][/ROW]
[ROW][C]72[/C][C]9.3[/C][C]8.82857142857143[/C][C]0.471428571428573[/C][/ROW]
[ROW][C]73[/C][C]9.4[/C][C]9[/C][C]0.400000000000003[/C][/ROW]
[ROW][C]74[/C][C]9.3[/C][C]8.9[/C][C]0.400000000000000[/C][/ROW]
[ROW][C]75[/C][C]9.1[/C][C]8.725[/C][C]0.374999999999999[/C][/ROW]
[ROW][C]76[/C][C]9[/C][C]8.27175141242938[/C][C]0.728248587570621[/C][/ROW]
[ROW][C]77[/C][C]8.9[/C][C]8.1625[/C][C]0.7375[/C][/ROW]
[ROW][C]78[/C][C]9[/C][C]8.2375[/C][C]0.7625[/C][/ROW]
[ROW][C]79[/C][C]9.8[/C][C]9.2375[/C][C]0.562500000000001[/C][/ROW]
[ROW][C]80[/C][C]10[/C][C]9.4875[/C][C]0.512500000000000[/C][/ROW]
[ROW][C]81[/C][C]9.8[/C][C]9.3375[/C][C]0.4625[/C][/ROW]
[ROW][C]82[/C][C]9.4[/C][C]9.13914447134786[/C][C]0.260855528652139[/C][/ROW]
[ROW][C]83[/C][C]9[/C][C]8.9185633575464[/C][C]0.0814366424535907[/C][/ROW]
[ROW][C]84[/C][C]8.9[/C][C]8.82857142857143[/C][C]0.0714285714285721[/C][/ROW]
[ROW][C]85[/C][C]9.3[/C][C]9[/C][C]0.300000000000003[/C][/ROW]
[ROW][C]86[/C][C]9.1[/C][C]8.9[/C][C]0.199999999999999[/C][/ROW]
[ROW][C]87[/C][C]8.8[/C][C]8.725[/C][C]0.0750000000000004[/C][/ROW]
[ROW][C]88[/C][C]8.9[/C][C]8.39774011299435[/C][C]0.50225988700565[/C][/ROW]
[ROW][C]89[/C][C]8.7[/C][C]8.1625[/C][C]0.537499999999999[/C][/ROW]
[ROW][C]90[/C][C]8.6[/C][C]8.2375[/C][C]0.362499999999999[/C][/ROW]
[ROW][C]91[/C][C]9.1[/C][C]9.2375[/C][C]-0.137500000000000[/C][/ROW]
[ROW][C]92[/C][C]9.3[/C][C]9.4875[/C][C]-0.1875[/C][/ROW]
[ROW][C]93[/C][C]8.9[/C][C]9.3375[/C][C]-0.4375[/C][/ROW]
[/TABLE]
Source: https://freestatistics.org/blog/index.php?pk=5455&T=4

Globally Unique Identifier (entire table): ba.freestatistics.org/blog/index.php?pk=5455&T=4

As an alternative you can also use a QR Code:  

The GUIDs for individual cells are displayed in the table below:

Multiple Linear Regression - Actuals, Interpolation, and Residuals
Time or IndexActualsInterpolationForecastResidualsPrediction Error
18.79.00000000000002-0.300000000000019
28.58.9-0.399999999999999
38.28.725-0.524999999999999
48.38.271751412429380.028248587570621
588.1625-0.1625
68.18.2375-0.137499999999999
78.79.2375-0.537500000000001
89.39.4875-0.187499999999997
98.99.3375-0.4375
108.89.13914447134786-0.339144471347862
118.48.79257465698144-0.392574656981437
128.48.82857142857143-0.428571428571428
137.39-1.70000000000000
147.28.9-1.7
1578.725-1.725
1678.27175141242938-1.27175141242938
176.98.1625-1.2625
186.98.2375-1.3375
197.19.2375-2.1375
207.59.4875-1.9875
217.49.3375-1.9375
228.99.13914447134786-0.239144471347861
238.38.9185633575464-0.618563357546409
248.38.82857142857143-0.528571428571428
25992.49106291150269e-15
268.98.91.52655665885959e-16
278.88.7250.0750000000000004
287.88.27175141242938-0.471751412429379
297.88.1625-0.3625
307.88.2375-0.4375
319.29.2375-0.0375000000000007
329.39.4875-0.1875
339.29.3375-0.137500000000001
348.69.13914447134786-0.539144471347861
358.58.79257465698144-0.292574656981437
368.58.82857142857143-0.328571428571428
37992.49106291150269e-15
3898.90.0999999999999998
398.88.7250.0750000000000004
4088.27175141242938-0.271751412429379
417.98.1625-0.262500000000000
428.18.2375-0.137500000000000
439.39.23750.0625000000000007
449.49.4875-0.0875000000000004
459.49.33750.0625000000000001
469.39.265133171912830.0348668280871676
4798.792574656981440.207425343018563
489.18.828571428571430.271428571428572
499.790.700000000000002
509.78.90.799999999999999
519.68.7250.875
528.38.271751412429380.0282485875706221
538.28.16250.0374999999999993
548.48.23750.162500000000000
5510.69.23751.3625
5610.99.48751.4125
5710.99.33751.5625
589.69.139144471347860.460855528652139
599.38.792574656981440.507425343018564
609.38.828571428571430.471428571428573
619.690.600000000000002
629.58.90.6
639.58.7250.775
6498.271751412429380.728248587570621
658.98.16250.7375
6698.23750.7625
6710.19.23750.8625
6810.29.48750.712499999999999
6910.29.33750.8625
709.59.139144471347860.360855528652139
719.38.792574656981440.507425343018564
729.38.828571428571430.471428571428573
739.490.400000000000003
749.38.90.400000000000000
759.18.7250.374999999999999
7698.271751412429380.728248587570621
778.98.16250.7375
7898.23750.7625
799.89.23750.562500000000001
80109.48750.512500000000000
819.89.33750.4625
829.49.139144471347860.260855528652139
8398.91856335754640.0814366424535907
848.98.828571428571430.0714285714285721
859.390.300000000000003
869.18.90.199999999999999
878.88.7250.0750000000000004
888.98.397740112994350.50225988700565
898.78.16250.537499999999999
908.68.23750.362499999999999
919.19.2375-0.137500000000000
929.39.4875-0.1875
938.99.3375-0.4375


Parameters (Session):
par1 = 1 ; par2 = Include Monthly Dummies ; par3 = No Linear Trend ;
Parameters (R input):
par1 = 1 ; par2 = Include Monthly Dummies ; par3 = No Linear Trend ;
R code (references can be found in the software module):
library(lattice)
par1 <- as.numeric(par1)
x <- t(y)
k <- length(x[1,])
n <- length(x[,1])
x1 <- cbind(x[,par1], x[,1:k!=par1])
mycolnames <- c(colnames(x)[par1], colnames(x)[1:k!=par1])
colnames(x1) <- mycolnames #colnames(x)[par1]
x <- x1
if (par3 == 'First Differences'){
x2 <- array(0, dim=c(n-1,k), dimnames=list(1:(n-1), paste('(1-B)',colnames(x),sep='')))
for (i in 1:n-1) {
for (j in 1:k) {
x2[i,j] <- x[i+1,j] - x[i,j]
}
}
x <- x2
}
if (par2 == 'Include Monthly Dummies'){
x2 <- array(0, dim=c(n,11), dimnames=list(1:n, paste('M', seq(1:11), sep ='')))
for (i in 1:11){
x2[seq(i,n,12),i] <- 1
}
x <- cbind(x, x2)
}
if (par2 == 'Include Quarterly Dummies'){
x2 <- array(0, dim=c(n,3), dimnames=list(1:n, paste('Q', seq(1:3), sep ='')))
for (i in 1:3){
x2[seq(i,n,4),i] <- 1
}
x <- cbind(x, x2)
}
k <- length(x[1,])
if (par3 == 'Linear Trend'){
x <- cbind(x, c(1:n))
colnames(x)[k+1] <- 't'
}
x
k <- length(x[1,])
df <- as.data.frame(x)
(mylm <- lm(df))
(mysum <- summary(mylm))
bitmap(file='test0.png')
plot(x[,1], type='l', main='Actuals and Interpolation', ylab='value of Actuals and Interpolation (dots)', xlab='time or index')
points(x[,1]-mysum$resid)
grid()
dev.off()
bitmap(file='test1.png')
plot(mysum$resid, type='b', pch=19, main='Residuals', ylab='value of Residuals', xlab='time or index')
grid()
dev.off()
bitmap(file='test2.png')
hist(mysum$resid, main='Residual Histogram', xlab='values of Residuals')
grid()
dev.off()
bitmap(file='test3.png')
densityplot(~mysum$resid,col='black',main='Residual Density Plot', xlab='values of Residuals')
dev.off()
bitmap(file='test4.png')
qqnorm(mysum$resid, main='Residual Normal Q-Q Plot')
grid()
dev.off()
(myerror <- as.ts(mysum$resid))
bitmap(file='test5.png')
dum <- cbind(lag(myerror,k=1),myerror)
dum
dum1 <- dum[2:length(myerror),]
dum1
z <- as.data.frame(dum1)
z
plot(z,main=paste('Residual Lag plot, lowess, and regression line'), ylab='values of Residuals', xlab='lagged values of Residuals')
lines(lowess(z))
abline(lm(z))
grid()
dev.off()
bitmap(file='test6.png')
acf(mysum$resid, lag.max=length(mysum$resid)/2, main='Residual Autocorrelation Function')
grid()
dev.off()
bitmap(file='test7.png')
pacf(mysum$resid, lag.max=length(mysum$resid)/2, main='Residual Partial Autocorrelation Function')
grid()
dev.off()
bitmap(file='test8.png')
opar <- par(mfrow = c(2,2), oma = c(0, 0, 1.1, 0))
plot(mylm, las = 1, sub='Residual Diagnostics')
par(opar)
dev.off()
load(file='createtable')
a<-table.start()
a<-table.row.start(a)
a<-table.element(a, 'Multiple Linear Regression - Estimated Regression Equation', 1, TRUE)
a<-table.row.end(a)
myeq <- colnames(x)[1]
myeq <- paste(myeq, '[t] = ', sep='')
for (i in 1:k){
if (mysum$coefficients[i,1] > 0) myeq <- paste(myeq, '+', '')
myeq <- paste(myeq, mysum$coefficients[i,1], sep=' ')
if (rownames(mysum$coefficients)[i] != '(Intercept)') {
myeq <- paste(myeq, rownames(mysum$coefficients)[i], sep='')
if (rownames(mysum$coefficients)[i] != 't') myeq <- paste(myeq, '[t]', sep='')
}
}
myeq <- paste(myeq, ' + e[t]')
a<-table.row.start(a)
a<-table.element(a, myeq)
a<-table.row.end(a)
a<-table.end(a)
table.save(a,file='mytable1.tab')
a<-table.start()
a<-table.row.start(a)
a<-table.element(a,hyperlink('ols1.htm','Multiple Linear Regression - Ordinary Least Squares',''), 6, TRUE)
a<-table.row.end(a)
a<-table.row.start(a)
a<-table.element(a,'Variable',header=TRUE)
a<-table.element(a,'Parameter',header=TRUE)
a<-table.element(a,'S.D.',header=TRUE)
a<-table.element(a,'T-STAT
H0: parameter = 0',header=TRUE)
a<-table.element(a,'2-tail p-value',header=TRUE)
a<-table.element(a,'1-tail p-value',header=TRUE)
a<-table.row.end(a)
for (i in 1:k){
a<-table.row.start(a)
a<-table.element(a,rownames(mysum$coefficients)[i],header=TRUE)
a<-table.element(a,mysum$coefficients[i,1])
a<-table.element(a, round(mysum$coefficients[i,2],6))
a<-table.element(a, round(mysum$coefficients[i,3],4))
a<-table.element(a, round(mysum$coefficients[i,4],6))
a<-table.element(a, round(mysum$coefficients[i,4]/2,6))
a<-table.row.end(a)
}
a<-table.end(a)
table.save(a,file='mytable2.tab')
a<-table.start()
a<-table.row.start(a)
a<-table.element(a, 'Multiple Linear Regression - Regression Statistics', 2, TRUE)
a<-table.row.end(a)
a<-table.row.start(a)
a<-table.element(a, 'Multiple R',1,TRUE)
a<-table.element(a, sqrt(mysum$r.squared))
a<-table.row.end(a)
a<-table.row.start(a)
a<-table.element(a, 'R-squared',1,TRUE)
a<-table.element(a, mysum$r.squared)
a<-table.row.end(a)
a<-table.row.start(a)
a<-table.element(a, 'Adjusted R-squared',1,TRUE)
a<-table.element(a, mysum$adj.r.squared)
a<-table.row.end(a)
a<-table.row.start(a)
a<-table.element(a, 'F-TEST (value)',1,TRUE)
a<-table.element(a, mysum$fstatistic[1])
a<-table.row.end(a)
a<-table.row.start(a)
a<-table.element(a, 'F-TEST (DF numerator)',1,TRUE)
a<-table.element(a, mysum$fstatistic[2])
a<-table.row.end(a)
a<-table.row.start(a)
a<-table.element(a, 'F-TEST (DF denominator)',1,TRUE)
a<-table.element(a, mysum$fstatistic[3])
a<-table.row.end(a)
a<-table.row.start(a)
a<-table.element(a, 'p-value',1,TRUE)
a<-table.element(a, 1-pf(mysum$fstatistic[1],mysum$fstatistic[2],mysum$fstatistic[3]))
a<-table.row.end(a)
a<-table.row.start(a)
a<-table.element(a, 'Multiple Linear Regression - Residual Statistics', 2, TRUE)
a<-table.row.end(a)
a<-table.row.start(a)
a<-table.element(a, 'Residual Standard Deviation',1,TRUE)
a<-table.element(a, mysum$sigma)
a<-table.row.end(a)
a<-table.row.start(a)
a<-table.element(a, 'Sum Squared Residuals',1,TRUE)
a<-table.element(a, sum(myerror*myerror))
a<-table.row.end(a)
a<-table.end(a)
table.save(a,file='mytable3.tab')
a<-table.start()
a<-table.row.start(a)
a<-table.element(a, 'Multiple Linear Regression - Actuals, Interpolation, and Residuals', 4, TRUE)
a<-table.row.end(a)
a<-table.row.start(a)
a<-table.element(a, 'Time or Index', 1, TRUE)
a<-table.element(a, 'Actuals', 1, TRUE)
a<-table.element(a, 'Interpolation
Forecast', 1, TRUE)
a<-table.element(a, 'Residuals
Prediction Error', 1, TRUE)
a<-table.row.end(a)
for (i in 1:n) {
a<-table.row.start(a)
a<-table.element(a,i, 1, TRUE)
a<-table.element(a,x[i])
a<-table.element(a,x[i]-mysum$resid[i])
a<-table.element(a,mysum$resid[i])
a<-table.row.end(a)
}
a<-table.end(a)
table.save(a,file='mytable4.tab')