Free Statistics

of Irreproducible Research!

Author's title

Author*Unverified author*
R Software Modulerwasp_multipleregression.wasp
Title produced by softwareMultiple Regression
Date of computationThu, 15 Nov 2007 06:08:32 -0700
Cite this page as followsStatistical Computations at FreeStatistics.org, Office for Research Development and Education, URL https://freestatistics.org/blog/index.php?v=date/2007/Nov/15/t1195131813cw1zrw591m3ywa3.htm/, Retrieved Sat, 04 May 2024 11:05:20 +0000
Statistical Computations at FreeStatistics.org, Office for Research Development and Education, URL https://freestatistics.org/blog/index.php?pk=14457, Retrieved Sat, 04 May 2024 11:05:20 +0000
QR Codes:

Original text written by user:
IsPrivate?No (this computation is public)
User-defined keywords
Estimated Impact239
Family? (F = Feedback message, R = changed R code, M = changed R Module, P = changed Parameters, D = changed Data)
-       [Multiple Regression] [-25 tov economisc...] [2007-11-15 13:08:32] [c56f8008888e950480d69a6e2ce38f45] [Current]
Feedback Forum

Post a new message
Dataseries X:
140	-1
132	-2
117	-2
114	-1
113	1
110	1
107	1
103	1
98	1
98	1
137	0
148	-1
147	-1
139	-1
130	-1
128	-1
127	-2
123	-2
118	-2
114	-1
108	-1
111	-1
151	-1
159	-1
158	-1
148	-1
138	0
137	0
136	1
133	1
126	1
120	1
114	-1
116	1
153	-1
162	1
161	0
149	-1
139	-1
135	-1
130	-1
127	-1
122	1
117	-1
112	-2
113	-2
149	-2
157	-1
157	-2
147	-1
137	-1
132	-1
125	-1
123	-1
117	-1
114	-1
111	-1
112	-1
144	0
150	-1
149	-1
134	1
123	1
116	-1
117	-1
111	0
105	-1
102	1
95	1
93	1
124	0
130	-1
124	-1


Summary of compuational transaction
Raw Inputview raw input (R code)
Raw Outputview raw output of R engine
Computing time5 seconds
R Server'Gwilym Jenkins' @ 72.249.127.135

\begin{tabular}{lllllllll}
\hline
Summary of compuational transaction \tabularnewline
Raw Input & view raw input (R code)  \tabularnewline
Raw Output & view raw output of R engine  \tabularnewline
Computing time & 5 seconds \tabularnewline
R Server & 'Gwilym Jenkins' @ 72.249.127.135 \tabularnewline
\hline
\end{tabular}
%Source: https://freestatistics.org/blog/index.php?pk=14457&T=0

[TABLE]
[ROW][C]Summary of compuational transaction[/C][/ROW]
[ROW][C]Raw Input[/C][C]view raw input (R code) [/C][/ROW]
[ROW][C]Raw Output[/C][C]view raw output of R engine [/C][/ROW]
[ROW][C]Computing time[/C][C]5 seconds[/C][/ROW]
[ROW][C]R Server[/C][C]'Gwilym Jenkins' @ 72.249.127.135[/C][/ROW]
[/TABLE]
Source: https://freestatistics.org/blog/index.php?pk=14457&T=0

Globally Unique Identifier (entire table): ba.freestatistics.org/blog/index.php?pk=14457&T=0

As an alternative you can also use a QR Code:  

The GUIDs for individual cells are displayed in the table below:

Summary of compuational transaction
Raw Inputview raw input (R code)
Raw Outputview raw output of R engine
Computing time5 seconds
R Server'Gwilym Jenkins' @ 72.249.127.135


Multiple Linear Regression - Estimated Regression Equation
<25[t] = + 151.992990089437 -1.43908629441624eco[t] -3.71212173532696M1[t] -10.2047003234457M2[t] -20.7517006802721M3[t] -24.6117298019038M4[t] -26.4188824429941M5[t] -29.6325494664871M6[t] -34.6795498233134M7[t] -38.5598835134731M8[t] -44.5662747332435M9[t] -43.2067607076672M10[t] -8.04648526077097M11[t] -0.0464852607709747t + e[t]

\begin{tabular}{lllllllll}
\hline
Multiple Linear Regression - Estimated Regression Equation \tabularnewline
<25[t] =  +  151.992990089437 -1.43908629441624eco[t] -3.71212173532696M1[t] -10.2047003234457M2[t] -20.7517006802721M3[t] -24.6117298019038M4[t] -26.4188824429941M5[t] -29.6325494664871M6[t] -34.6795498233134M7[t] -38.5598835134731M8[t] -44.5662747332435M9[t] -43.2067607076672M10[t] -8.04648526077097M11[t] -0.0464852607709747t  + e[t] \tabularnewline
\hline
\end{tabular}
%Source: https://freestatistics.org/blog/index.php?pk=14457&T=1

[TABLE]
[ROW][C]Multiple Linear Regression - Estimated Regression Equation[/C][/ROW]
[ROW][C]<25[t] =  +  151.992990089437 -1.43908629441624eco[t] -3.71212173532696M1[t] -10.2047003234457M2[t] -20.7517006802721M3[t] -24.6117298019038M4[t] -26.4188824429941M5[t] -29.6325494664871M6[t] -34.6795498233134M7[t] -38.5598835134731M8[t] -44.5662747332435M9[t] -43.2067607076672M10[t] -8.04648526077097M11[t] -0.0464852607709747t  + e[t][/C][/ROW]
[/TABLE]
Source: https://freestatistics.org/blog/index.php?pk=14457&T=1

Globally Unique Identifier (entire table): ba.freestatistics.org/blog/index.php?pk=14457&T=1

As an alternative you can also use a QR Code:  

The GUIDs for individual cells are displayed in the table below:

Multiple Linear Regression - Estimated Regression Equation
<25[t] = + 151.992990089437 -1.43908629441624eco[t] -3.71212173532696M1[t] -10.2047003234457M2[t] -20.7517006802721M3[t] -24.6117298019038M4[t] -26.4188824429941M5[t] -29.6325494664871M6[t] -34.6795498233134M7[t] -38.5598835134731M8[t] -44.5662747332435M9[t] -43.2067607076672M10[t] -8.04648526077097M11[t] -0.0464852607709747t + e[t]


Multiple Linear Regression - Ordinary Least Squares
VariableParameterS.D.T-STATH0: parameter = 02-tail p-value1-tail p-value
(Intercept)151.9929900894374.56221233.315600
eco-1.439086294416241.176507-1.22320.2261230.113061
M1-3.712121735326965.325328-0.69710.4884970.244249
M2-10.20470032344575.53377-1.84410.0701950.035097
M3-20.75170068027215.525375-3.75570.0003980.000199
M4-24.61172980190385.52445-4.45513.8e-051.9e-05
M5-26.41888244299415.520563-4.78551.2e-056e-06
M6-29.63254946648715.527635-5.36081e-061e-06
M7-34.67954982331345.542157-6.257400
M8-38.55988351347315.564071-6.930200
M9-44.56627473324355.510182-8.08800
M10-43.20676070766725.536731-7.803700
M11-8.046485260770975.504612-1.46180.149110.074555
t-0.04648526077097470.053503-0.86880.3884620.194231

\begin{tabular}{lllllllll}
\hline
Multiple Linear Regression - Ordinary Least Squares \tabularnewline
Variable & Parameter & S.D. & T-STATH0: parameter = 0 & 2-tail p-value & 1-tail p-value \tabularnewline
(Intercept) & 151.992990089437 & 4.562212 & 33.3156 & 0 & 0 \tabularnewline
eco & -1.43908629441624 & 1.176507 & -1.2232 & 0.226123 & 0.113061 \tabularnewline
M1 & -3.71212173532696 & 5.325328 & -0.6971 & 0.488497 & 0.244249 \tabularnewline
M2 & -10.2047003234457 & 5.53377 & -1.8441 & 0.070195 & 0.035097 \tabularnewline
M3 & -20.7517006802721 & 5.525375 & -3.7557 & 0.000398 & 0.000199 \tabularnewline
M4 & -24.6117298019038 & 5.52445 & -4.4551 & 3.8e-05 & 1.9e-05 \tabularnewline
M5 & -26.4188824429941 & 5.520563 & -4.7855 & 1.2e-05 & 6e-06 \tabularnewline
M6 & -29.6325494664871 & 5.527635 & -5.3608 & 1e-06 & 1e-06 \tabularnewline
M7 & -34.6795498233134 & 5.542157 & -6.2574 & 0 & 0 \tabularnewline
M8 & -38.5598835134731 & 5.564071 & -6.9302 & 0 & 0 \tabularnewline
M9 & -44.5662747332435 & 5.510182 & -8.088 & 0 & 0 \tabularnewline
M10 & -43.2067607076672 & 5.536731 & -7.8037 & 0 & 0 \tabularnewline
M11 & -8.04648526077097 & 5.504612 & -1.4618 & 0.14911 & 0.074555 \tabularnewline
t & -0.0464852607709747 & 0.053503 & -0.8688 & 0.388462 & 0.194231 \tabularnewline
\hline
\end{tabular}
%Source: https://freestatistics.org/blog/index.php?pk=14457&T=2

[TABLE]
[ROW][C]Multiple Linear Regression - Ordinary Least Squares[/C][/ROW]
[ROW][C]Variable[/C][C]Parameter[/C][C]S.D.[/C][C]T-STATH0: parameter = 0[/C][C]2-tail p-value[/C][C]1-tail p-value[/C][/ROW]
[ROW][C](Intercept)[/C][C]151.992990089437[/C][C]4.562212[/C][C]33.3156[/C][C]0[/C][C]0[/C][/ROW]
[ROW][C]eco[/C][C]-1.43908629441624[/C][C]1.176507[/C][C]-1.2232[/C][C]0.226123[/C][C]0.113061[/C][/ROW]
[ROW][C]M1[/C][C]-3.71212173532696[/C][C]5.325328[/C][C]-0.6971[/C][C]0.488497[/C][C]0.244249[/C][/ROW]
[ROW][C]M2[/C][C]-10.2047003234457[/C][C]5.53377[/C][C]-1.8441[/C][C]0.070195[/C][C]0.035097[/C][/ROW]
[ROW][C]M3[/C][C]-20.7517006802721[/C][C]5.525375[/C][C]-3.7557[/C][C]0.000398[/C][C]0.000199[/C][/ROW]
[ROW][C]M4[/C][C]-24.6117298019038[/C][C]5.52445[/C][C]-4.4551[/C][C]3.8e-05[/C][C]1.9e-05[/C][/ROW]
[ROW][C]M5[/C][C]-26.4188824429941[/C][C]5.520563[/C][C]-4.7855[/C][C]1.2e-05[/C][C]6e-06[/C][/ROW]
[ROW][C]M6[/C][C]-29.6325494664871[/C][C]5.527635[/C][C]-5.3608[/C][C]1e-06[/C][C]1e-06[/C][/ROW]
[ROW][C]M7[/C][C]-34.6795498233134[/C][C]5.542157[/C][C]-6.2574[/C][C]0[/C][C]0[/C][/ROW]
[ROW][C]M8[/C][C]-38.5598835134731[/C][C]5.564071[/C][C]-6.9302[/C][C]0[/C][C]0[/C][/ROW]
[ROW][C]M9[/C][C]-44.5662747332435[/C][C]5.510182[/C][C]-8.088[/C][C]0[/C][C]0[/C][/ROW]
[ROW][C]M10[/C][C]-43.2067607076672[/C][C]5.536731[/C][C]-7.8037[/C][C]0[/C][C]0[/C][/ROW]
[ROW][C]M11[/C][C]-8.04648526077097[/C][C]5.504612[/C][C]-1.4618[/C][C]0.14911[/C][C]0.074555[/C][/ROW]
[ROW][C]t[/C][C]-0.0464852607709747[/C][C]0.053503[/C][C]-0.8688[/C][C]0.388462[/C][C]0.194231[/C][/ROW]
[/TABLE]
Source: https://freestatistics.org/blog/index.php?pk=14457&T=2

Globally Unique Identifier (entire table): ba.freestatistics.org/blog/index.php?pk=14457&T=2

As an alternative you can also use a QR Code:  

The GUIDs for individual cells are displayed in the table below:

Multiple Linear Regression - Ordinary Least Squares
VariableParameterS.D.T-STATH0: parameter = 02-tail p-value1-tail p-value
(Intercept)151.9929900894374.56221233.315600
eco-1.439086294416241.176507-1.22320.2261230.113061
M1-3.712121735326965.325328-0.69710.4884970.244249
M2-10.20470032344575.53377-1.84410.0701950.035097
M3-20.75170068027215.525375-3.75570.0003980.000199
M4-24.61172980190385.52445-4.45513.8e-051.9e-05
M5-26.41888244299415.520563-4.78551.2e-056e-06
M6-29.63254946648715.527635-5.36081e-061e-06
M7-34.67954982331345.542157-6.257400
M8-38.55988351347315.564071-6.930200
M9-44.56627473324355.510182-8.08800
M10-43.20676070766725.536731-7.803700
M11-8.046485260770975.504612-1.46180.149110.074555
t-0.04648526077097470.053503-0.86880.3884620.194231


Multiple Linear Regression - Regression Statistics
Multiple R0.871375398871458
R-squared0.759295085758392
Adjusted R-squared0.706258409739054
F-TEST (value)14.316415408114
F-TEST (DF numerator)13
F-TEST (DF denominator)59
p-value9.83657599817889e-14
Multiple Linear Regression - Residual Statistics
Residual Standard Deviation9.53381798208228
Sum Squared Residuals5362.72743361305

\begin{tabular}{lllllllll}
\hline
Multiple Linear Regression - Regression Statistics \tabularnewline
Multiple R & 0.871375398871458 \tabularnewline
R-squared & 0.759295085758392 \tabularnewline
Adjusted R-squared & 0.706258409739054 \tabularnewline
F-TEST (value) & 14.316415408114 \tabularnewline
F-TEST (DF numerator) & 13 \tabularnewline
F-TEST (DF denominator) & 59 \tabularnewline
p-value & 9.83657599817889e-14 \tabularnewline
Multiple Linear Regression - Residual Statistics \tabularnewline
Residual Standard Deviation & 9.53381798208228 \tabularnewline
Sum Squared Residuals & 5362.72743361305 \tabularnewline
\hline
\end{tabular}
%Source: https://freestatistics.org/blog/index.php?pk=14457&T=3

[TABLE]
[ROW][C]Multiple Linear Regression - Regression Statistics[/C][/ROW]
[ROW][C]Multiple R[/C][C]0.871375398871458[/C][/ROW]
[ROW][C]R-squared[/C][C]0.759295085758392[/C][/ROW]
[ROW][C]Adjusted R-squared[/C][C]0.706258409739054[/C][/ROW]
[ROW][C]F-TEST (value)[/C][C]14.316415408114[/C][/ROW]
[ROW][C]F-TEST (DF numerator)[/C][C]13[/C][/ROW]
[ROW][C]F-TEST (DF denominator)[/C][C]59[/C][/ROW]
[ROW][C]p-value[/C][C]9.83657599817889e-14[/C][/ROW]
[ROW][C]Multiple Linear Regression - Residual Statistics[/C][/ROW]
[ROW][C]Residual Standard Deviation[/C][C]9.53381798208228[/C][/ROW]
[ROW][C]Sum Squared Residuals[/C][C]5362.72743361305[/C][/ROW]
[/TABLE]
Source: https://freestatistics.org/blog/index.php?pk=14457&T=3

Globally Unique Identifier (entire table): ba.freestatistics.org/blog/index.php?pk=14457&T=3

As an alternative you can also use a QR Code:  

The GUIDs for individual cells are displayed in the table below:

Multiple Linear Regression - Regression Statistics
Multiple R0.871375398871458
R-squared0.759295085758392
Adjusted R-squared0.706258409739054
F-TEST (value)14.316415408114
F-TEST (DF numerator)13
F-TEST (DF denominator)59
p-value9.83657599817889e-14
Multiple Linear Regression - Residual Statistics
Residual Standard Deviation9.53381798208228
Sum Squared Residuals5362.72743361305


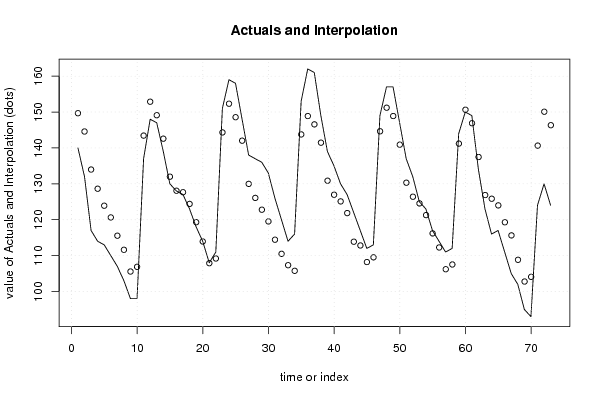
Multiple Linear Regression - Actuals, Interpolation, and Residuals
Time or IndexActualsInterpolationForecastResidualsPrediction Error
1140149.673469387755-9.67346938775538
2132144.573491833282-12.5734918332815
3117133.980006215684-16.9800062156843
4114128.634405538865-14.6344055388653
5113123.902595048172-10.9025950481715
6110120.642442763908-10.6424427639076
7107115.548957146310-8.54895714631028
8103111.622138195380-8.62213819537963
998105.569261714838-7.5692617148382
1098106.882290479644-8.88229047964363
11137143.435166960185-6.43516696018508
12148152.874253254601-4.87425325460132
13147149.115646258503-2.11564625850336
14139142.576582409614-3.57658240961359
15130131.983096792016-1.98309679201628
16128128.076582409614-0.076582409613576
17127127.662030802169-0.662030802168579
18123124.401878517905-1.40187851790461
19118119.308392900307-1.30839290030731
20114113.9424876549600.057512345039542
21108107.8896111744190.110388825580997
22111109.2026399392241.79736006077559
23151144.3164301253506.68356987465038
24159152.3164301253506.68356987465039
25158148.5578231292529.44217687074835
26148142.0187592803625.98124071963811
27138129.9861873683488.01381263165165
28137126.07967298594610.9203270140544
29136122.78694878966813.2130512103318
30133119.52679650540413.4732034945958
31126114.43331088780711.5666891121931
32120110.5064919368769.49350806312371
33114107.3317880451676.66821195483269
34116105.76664422114010.2333557788598
35153143.7586069960989.24139300390207
36162148.88043440726513.1195655927346
37161146.56091370558414.4390862944163
38149141.4609361511107.5390638488898
39139130.8674505335138.1325494664871
40135126.9609361511108.03906384888981
41130125.1072982492494.89270175075106
42127121.8471459649855.15285403501503
43122113.8754877585558.12451224144479
44117112.8268413964574.17315860354293
45112108.2130512103323.78694878966816
46113109.5260799751373.47392002486274
47149144.6398701612624.36012983873753
48157151.2007838668465.79921613315379
49157148.8812631651658.1187368348355
50147140.9031130218596.0968869781415
51137130.3096274042616.69037259573881
52132126.4031130218585.59688697814151
53125124.5494751199970.450524880002751
54123121.2893228357331.71067716426672
55117116.1958372181360.804162781864004
56114112.2690182672051.73098173279463
57111106.2161417866644.78385821333609
58112107.5291705514694.47082944853068
59144141.2038744431782.7961255568217
60150150.642960737595-0.64296073759453
61149146.8843537414972.11564625850344
62134137.467117303774-3.46711730377433
63123126.873631686177-3.87363168617702
64116125.845289892607-9.8452898926068
65117123.991651990746-6.99165199074555
66111119.292413412065-8.29241341206535
67105115.638014088884-10.6380140888843
68102108.833022549121-6.83302254912119
6995102.780146068580-7.78014606857973
7093104.093174833385-11.0931748333851
71124140.646051313927-16.6460513139266
72130150.085137608343-20.0851376083428
73124146.326530612245-22.3265306122449

\begin{tabular}{lllllllll}
\hline
Multiple Linear Regression - Actuals, Interpolation, and Residuals \tabularnewline
Time or Index & Actuals & InterpolationForecast & ResidualsPrediction Error \tabularnewline
1 & 140 & 149.673469387755 & -9.67346938775538 \tabularnewline
2 & 132 & 144.573491833282 & -12.5734918332815 \tabularnewline
3 & 117 & 133.980006215684 & -16.9800062156843 \tabularnewline
4 & 114 & 128.634405538865 & -14.6344055388653 \tabularnewline
5 & 113 & 123.902595048172 & -10.9025950481715 \tabularnewline
6 & 110 & 120.642442763908 & -10.6424427639076 \tabularnewline
7 & 107 & 115.548957146310 & -8.54895714631028 \tabularnewline
8 & 103 & 111.622138195380 & -8.62213819537963 \tabularnewline
9 & 98 & 105.569261714838 & -7.5692617148382 \tabularnewline
10 & 98 & 106.882290479644 & -8.88229047964363 \tabularnewline
11 & 137 & 143.435166960185 & -6.43516696018508 \tabularnewline
12 & 148 & 152.874253254601 & -4.87425325460132 \tabularnewline
13 & 147 & 149.115646258503 & -2.11564625850336 \tabularnewline
14 & 139 & 142.576582409614 & -3.57658240961359 \tabularnewline
15 & 130 & 131.983096792016 & -1.98309679201628 \tabularnewline
16 & 128 & 128.076582409614 & -0.076582409613576 \tabularnewline
17 & 127 & 127.662030802169 & -0.662030802168579 \tabularnewline
18 & 123 & 124.401878517905 & -1.40187851790461 \tabularnewline
19 & 118 & 119.308392900307 & -1.30839290030731 \tabularnewline
20 & 114 & 113.942487654960 & 0.057512345039542 \tabularnewline
21 & 108 & 107.889611174419 & 0.110388825580997 \tabularnewline
22 & 111 & 109.202639939224 & 1.79736006077559 \tabularnewline
23 & 151 & 144.316430125350 & 6.68356987465038 \tabularnewline
24 & 159 & 152.316430125350 & 6.68356987465039 \tabularnewline
25 & 158 & 148.557823129252 & 9.44217687074835 \tabularnewline
26 & 148 & 142.018759280362 & 5.98124071963811 \tabularnewline
27 & 138 & 129.986187368348 & 8.01381263165165 \tabularnewline
28 & 137 & 126.079672985946 & 10.9203270140544 \tabularnewline
29 & 136 & 122.786948789668 & 13.2130512103318 \tabularnewline
30 & 133 & 119.526796505404 & 13.4732034945958 \tabularnewline
31 & 126 & 114.433310887807 & 11.5666891121931 \tabularnewline
32 & 120 & 110.506491936876 & 9.49350806312371 \tabularnewline
33 & 114 & 107.331788045167 & 6.66821195483269 \tabularnewline
34 & 116 & 105.766644221140 & 10.2333557788598 \tabularnewline
35 & 153 & 143.758606996098 & 9.24139300390207 \tabularnewline
36 & 162 & 148.880434407265 & 13.1195655927346 \tabularnewline
37 & 161 & 146.560913705584 & 14.4390862944163 \tabularnewline
38 & 149 & 141.460936151110 & 7.5390638488898 \tabularnewline
39 & 139 & 130.867450533513 & 8.1325494664871 \tabularnewline
40 & 135 & 126.960936151110 & 8.03906384888981 \tabularnewline
41 & 130 & 125.107298249249 & 4.89270175075106 \tabularnewline
42 & 127 & 121.847145964985 & 5.15285403501503 \tabularnewline
43 & 122 & 113.875487758555 & 8.12451224144479 \tabularnewline
44 & 117 & 112.826841396457 & 4.17315860354293 \tabularnewline
45 & 112 & 108.213051210332 & 3.78694878966816 \tabularnewline
46 & 113 & 109.526079975137 & 3.47392002486274 \tabularnewline
47 & 149 & 144.639870161262 & 4.36012983873753 \tabularnewline
48 & 157 & 151.200783866846 & 5.79921613315379 \tabularnewline
49 & 157 & 148.881263165165 & 8.1187368348355 \tabularnewline
50 & 147 & 140.903113021859 & 6.0968869781415 \tabularnewline
51 & 137 & 130.309627404261 & 6.69037259573881 \tabularnewline
52 & 132 & 126.403113021858 & 5.59688697814151 \tabularnewline
53 & 125 & 124.549475119997 & 0.450524880002751 \tabularnewline
54 & 123 & 121.289322835733 & 1.71067716426672 \tabularnewline
55 & 117 & 116.195837218136 & 0.804162781864004 \tabularnewline
56 & 114 & 112.269018267205 & 1.73098173279463 \tabularnewline
57 & 111 & 106.216141786664 & 4.78385821333609 \tabularnewline
58 & 112 & 107.529170551469 & 4.47082944853068 \tabularnewline
59 & 144 & 141.203874443178 & 2.7961255568217 \tabularnewline
60 & 150 & 150.642960737595 & -0.64296073759453 \tabularnewline
61 & 149 & 146.884353741497 & 2.11564625850344 \tabularnewline
62 & 134 & 137.467117303774 & -3.46711730377433 \tabularnewline
63 & 123 & 126.873631686177 & -3.87363168617702 \tabularnewline
64 & 116 & 125.845289892607 & -9.8452898926068 \tabularnewline
65 & 117 & 123.991651990746 & -6.99165199074555 \tabularnewline
66 & 111 & 119.292413412065 & -8.29241341206535 \tabularnewline
67 & 105 & 115.638014088884 & -10.6380140888843 \tabularnewline
68 & 102 & 108.833022549121 & -6.83302254912119 \tabularnewline
69 & 95 & 102.780146068580 & -7.78014606857973 \tabularnewline
70 & 93 & 104.093174833385 & -11.0931748333851 \tabularnewline
71 & 124 & 140.646051313927 & -16.6460513139266 \tabularnewline
72 & 130 & 150.085137608343 & -20.0851376083428 \tabularnewline
73 & 124 & 146.326530612245 & -22.3265306122449 \tabularnewline
\hline
\end{tabular}
%Source: https://freestatistics.org/blog/index.php?pk=14457&T=4

[TABLE]
[ROW][C]Multiple Linear Regression - Actuals, Interpolation, and Residuals[/C][/ROW]
[ROW][C]Time or Index[/C][C]Actuals[/C][C]InterpolationForecast[/C][C]ResidualsPrediction Error[/C][/ROW]
[ROW][C]1[/C][C]140[/C][C]149.673469387755[/C][C]-9.67346938775538[/C][/ROW]
[ROW][C]2[/C][C]132[/C][C]144.573491833282[/C][C]-12.5734918332815[/C][/ROW]
[ROW][C]3[/C][C]117[/C][C]133.980006215684[/C][C]-16.9800062156843[/C][/ROW]
[ROW][C]4[/C][C]114[/C][C]128.634405538865[/C][C]-14.6344055388653[/C][/ROW]
[ROW][C]5[/C][C]113[/C][C]123.902595048172[/C][C]-10.9025950481715[/C][/ROW]
[ROW][C]6[/C][C]110[/C][C]120.642442763908[/C][C]-10.6424427639076[/C][/ROW]
[ROW][C]7[/C][C]107[/C][C]115.548957146310[/C][C]-8.54895714631028[/C][/ROW]
[ROW][C]8[/C][C]103[/C][C]111.622138195380[/C][C]-8.62213819537963[/C][/ROW]
[ROW][C]9[/C][C]98[/C][C]105.569261714838[/C][C]-7.5692617148382[/C][/ROW]
[ROW][C]10[/C][C]98[/C][C]106.882290479644[/C][C]-8.88229047964363[/C][/ROW]
[ROW][C]11[/C][C]137[/C][C]143.435166960185[/C][C]-6.43516696018508[/C][/ROW]
[ROW][C]12[/C][C]148[/C][C]152.874253254601[/C][C]-4.87425325460132[/C][/ROW]
[ROW][C]13[/C][C]147[/C][C]149.115646258503[/C][C]-2.11564625850336[/C][/ROW]
[ROW][C]14[/C][C]139[/C][C]142.576582409614[/C][C]-3.57658240961359[/C][/ROW]
[ROW][C]15[/C][C]130[/C][C]131.983096792016[/C][C]-1.98309679201628[/C][/ROW]
[ROW][C]16[/C][C]128[/C][C]128.076582409614[/C][C]-0.076582409613576[/C][/ROW]
[ROW][C]17[/C][C]127[/C][C]127.662030802169[/C][C]-0.662030802168579[/C][/ROW]
[ROW][C]18[/C][C]123[/C][C]124.401878517905[/C][C]-1.40187851790461[/C][/ROW]
[ROW][C]19[/C][C]118[/C][C]119.308392900307[/C][C]-1.30839290030731[/C][/ROW]
[ROW][C]20[/C][C]114[/C][C]113.942487654960[/C][C]0.057512345039542[/C][/ROW]
[ROW][C]21[/C][C]108[/C][C]107.889611174419[/C][C]0.110388825580997[/C][/ROW]
[ROW][C]22[/C][C]111[/C][C]109.202639939224[/C][C]1.79736006077559[/C][/ROW]
[ROW][C]23[/C][C]151[/C][C]144.316430125350[/C][C]6.68356987465038[/C][/ROW]
[ROW][C]24[/C][C]159[/C][C]152.316430125350[/C][C]6.68356987465039[/C][/ROW]
[ROW][C]25[/C][C]158[/C][C]148.557823129252[/C][C]9.44217687074835[/C][/ROW]
[ROW][C]26[/C][C]148[/C][C]142.018759280362[/C][C]5.98124071963811[/C][/ROW]
[ROW][C]27[/C][C]138[/C][C]129.986187368348[/C][C]8.01381263165165[/C][/ROW]
[ROW][C]28[/C][C]137[/C][C]126.079672985946[/C][C]10.9203270140544[/C][/ROW]
[ROW][C]29[/C][C]136[/C][C]122.786948789668[/C][C]13.2130512103318[/C][/ROW]
[ROW][C]30[/C][C]133[/C][C]119.526796505404[/C][C]13.4732034945958[/C][/ROW]
[ROW][C]31[/C][C]126[/C][C]114.433310887807[/C][C]11.5666891121931[/C][/ROW]
[ROW][C]32[/C][C]120[/C][C]110.506491936876[/C][C]9.49350806312371[/C][/ROW]
[ROW][C]33[/C][C]114[/C][C]107.331788045167[/C][C]6.66821195483269[/C][/ROW]
[ROW][C]34[/C][C]116[/C][C]105.766644221140[/C][C]10.2333557788598[/C][/ROW]
[ROW][C]35[/C][C]153[/C][C]143.758606996098[/C][C]9.24139300390207[/C][/ROW]
[ROW][C]36[/C][C]162[/C][C]148.880434407265[/C][C]13.1195655927346[/C][/ROW]
[ROW][C]37[/C][C]161[/C][C]146.560913705584[/C][C]14.4390862944163[/C][/ROW]
[ROW][C]38[/C][C]149[/C][C]141.460936151110[/C][C]7.5390638488898[/C][/ROW]
[ROW][C]39[/C][C]139[/C][C]130.867450533513[/C][C]8.1325494664871[/C][/ROW]
[ROW][C]40[/C][C]135[/C][C]126.960936151110[/C][C]8.03906384888981[/C][/ROW]
[ROW][C]41[/C][C]130[/C][C]125.107298249249[/C][C]4.89270175075106[/C][/ROW]
[ROW][C]42[/C][C]127[/C][C]121.847145964985[/C][C]5.15285403501503[/C][/ROW]
[ROW][C]43[/C][C]122[/C][C]113.875487758555[/C][C]8.12451224144479[/C][/ROW]
[ROW][C]44[/C][C]117[/C][C]112.826841396457[/C][C]4.17315860354293[/C][/ROW]
[ROW][C]45[/C][C]112[/C][C]108.213051210332[/C][C]3.78694878966816[/C][/ROW]
[ROW][C]46[/C][C]113[/C][C]109.526079975137[/C][C]3.47392002486274[/C][/ROW]
[ROW][C]47[/C][C]149[/C][C]144.639870161262[/C][C]4.36012983873753[/C][/ROW]
[ROW][C]48[/C][C]157[/C][C]151.200783866846[/C][C]5.79921613315379[/C][/ROW]
[ROW][C]49[/C][C]157[/C][C]148.881263165165[/C][C]8.1187368348355[/C][/ROW]
[ROW][C]50[/C][C]147[/C][C]140.903113021859[/C][C]6.0968869781415[/C][/ROW]
[ROW][C]51[/C][C]137[/C][C]130.309627404261[/C][C]6.69037259573881[/C][/ROW]
[ROW][C]52[/C][C]132[/C][C]126.403113021858[/C][C]5.59688697814151[/C][/ROW]
[ROW][C]53[/C][C]125[/C][C]124.549475119997[/C][C]0.450524880002751[/C][/ROW]
[ROW][C]54[/C][C]123[/C][C]121.289322835733[/C][C]1.71067716426672[/C][/ROW]
[ROW][C]55[/C][C]117[/C][C]116.195837218136[/C][C]0.804162781864004[/C][/ROW]
[ROW][C]56[/C][C]114[/C][C]112.269018267205[/C][C]1.73098173279463[/C][/ROW]
[ROW][C]57[/C][C]111[/C][C]106.216141786664[/C][C]4.78385821333609[/C][/ROW]
[ROW][C]58[/C][C]112[/C][C]107.529170551469[/C][C]4.47082944853068[/C][/ROW]
[ROW][C]59[/C][C]144[/C][C]141.203874443178[/C][C]2.7961255568217[/C][/ROW]
[ROW][C]60[/C][C]150[/C][C]150.642960737595[/C][C]-0.64296073759453[/C][/ROW]
[ROW][C]61[/C][C]149[/C][C]146.884353741497[/C][C]2.11564625850344[/C][/ROW]
[ROW][C]62[/C][C]134[/C][C]137.467117303774[/C][C]-3.46711730377433[/C][/ROW]
[ROW][C]63[/C][C]123[/C][C]126.873631686177[/C][C]-3.87363168617702[/C][/ROW]
[ROW][C]64[/C][C]116[/C][C]125.845289892607[/C][C]-9.8452898926068[/C][/ROW]
[ROW][C]65[/C][C]117[/C][C]123.991651990746[/C][C]-6.99165199074555[/C][/ROW]
[ROW][C]66[/C][C]111[/C][C]119.292413412065[/C][C]-8.29241341206535[/C][/ROW]
[ROW][C]67[/C][C]105[/C][C]115.638014088884[/C][C]-10.6380140888843[/C][/ROW]
[ROW][C]68[/C][C]102[/C][C]108.833022549121[/C][C]-6.83302254912119[/C][/ROW]
[ROW][C]69[/C][C]95[/C][C]102.780146068580[/C][C]-7.78014606857973[/C][/ROW]
[ROW][C]70[/C][C]93[/C][C]104.093174833385[/C][C]-11.0931748333851[/C][/ROW]
[ROW][C]71[/C][C]124[/C][C]140.646051313927[/C][C]-16.6460513139266[/C][/ROW]
[ROW][C]72[/C][C]130[/C][C]150.085137608343[/C][C]-20.0851376083428[/C][/ROW]
[ROW][C]73[/C][C]124[/C][C]146.326530612245[/C][C]-22.3265306122449[/C][/ROW]
[/TABLE]
Source: https://freestatistics.org/blog/index.php?pk=14457&T=4

Globally Unique Identifier (entire table): ba.freestatistics.org/blog/index.php?pk=14457&T=4

As an alternative you can also use a QR Code:  

The GUIDs for individual cells are displayed in the table below:

Multiple Linear Regression - Actuals, Interpolation, and Residuals
Time or IndexActualsInterpolationForecastResidualsPrediction Error
1140149.673469387755-9.67346938775538
2132144.573491833282-12.5734918332815
3117133.980006215684-16.9800062156843
4114128.634405538865-14.6344055388653
5113123.902595048172-10.9025950481715
6110120.642442763908-10.6424427639076
7107115.548957146310-8.54895714631028
8103111.622138195380-8.62213819537963
998105.569261714838-7.5692617148382
1098106.882290479644-8.88229047964363
11137143.435166960185-6.43516696018508
12148152.874253254601-4.87425325460132
13147149.115646258503-2.11564625850336
14139142.576582409614-3.57658240961359
15130131.983096792016-1.98309679201628
16128128.076582409614-0.076582409613576
17127127.662030802169-0.662030802168579
18123124.401878517905-1.40187851790461
19118119.308392900307-1.30839290030731
20114113.9424876549600.057512345039542
21108107.8896111744190.110388825580997
22111109.2026399392241.79736006077559
23151144.3164301253506.68356987465038
24159152.3164301253506.68356987465039
25158148.5578231292529.44217687074835
26148142.0187592803625.98124071963811
27138129.9861873683488.01381263165165
28137126.07967298594610.9203270140544
29136122.78694878966813.2130512103318
30133119.52679650540413.4732034945958
31126114.43331088780711.5666891121931
32120110.5064919368769.49350806312371
33114107.3317880451676.66821195483269
34116105.76664422114010.2333557788598
35153143.7586069960989.24139300390207
36162148.88043440726513.1195655927346
37161146.56091370558414.4390862944163
38149141.4609361511107.5390638488898
39139130.8674505335138.1325494664871
40135126.9609361511108.03906384888981
41130125.1072982492494.89270175075106
42127121.8471459649855.15285403501503
43122113.8754877585558.12451224144479
44117112.8268413964574.17315860354293
45112108.2130512103323.78694878966816
46113109.5260799751373.47392002486274
47149144.6398701612624.36012983873753
48157151.2007838668465.79921613315379
49157148.8812631651658.1187368348355
50147140.9031130218596.0968869781415
51137130.3096274042616.69037259573881
52132126.4031130218585.59688697814151
53125124.5494751199970.450524880002751
54123121.2893228357331.71067716426672
55117116.1958372181360.804162781864004
56114112.2690182672051.73098173279463
57111106.2161417866644.78385821333609
58112107.5291705514694.47082944853068
59144141.2038744431782.7961255568217
60150150.642960737595-0.64296073759453
61149146.8843537414972.11564625850344
62134137.467117303774-3.46711730377433
63123126.873631686177-3.87363168617702
64116125.845289892607-9.8452898926068
65117123.991651990746-6.99165199074555
66111119.292413412065-8.29241341206535
67105115.638014088884-10.6380140888843
68102108.833022549121-6.83302254912119
6995102.780146068580-7.78014606857973
7093104.093174833385-11.0931748333851
71124140.646051313927-16.6460513139266
72130150.085137608343-20.0851376083428
73124146.326530612245-22.3265306122449


Parameters (Session):
par1 = 1 ; par2 = Include Monthly Dummies ; par3 = Linear Trend ;
Parameters (R input):
par1 = 1 ; par2 = Include Monthly Dummies ; par3 = Linear Trend ;
R code (references can be found in the software module):
library(lattice)
par1 <- as.numeric(par1)
x <- t(y)
k <- length(x[1,])
n <- length(x[,1])
x1 <- cbind(x[,par1], x[,1:k!=par1])
mycolnames <- c(colnames(x)[par1], colnames(x)[1:k!=par1])
colnames(x1) <- mycolnames #colnames(x)[par1]
x <- x1
if (par3 == 'First Differences'){
x2 <- array(0, dim=c(n-1,k), dimnames=list(1:(n-1), paste('(1-B)',colnames(x),sep='')))
for (i in 1:n-1) {
for (j in 1:k) {
x2[i,j] <- x[i+1,j] - x[i,j]
}
}
x <- x2
}
if (par2 == 'Include Monthly Dummies'){
x2 <- array(0, dim=c(n,11), dimnames=list(1:n, paste('M', seq(1:11), sep ='')))
for (i in 1:11){
x2[seq(i,n,12),i] <- 1
}
x <- cbind(x, x2)
}
if (par2 == 'Include Quarterly Dummies'){
x2 <- array(0, dim=c(n,3), dimnames=list(1:n, paste('Q', seq(1:3), sep ='')))
for (i in 1:3){
x2[seq(i,n,4),i] <- 1
}
x <- cbind(x, x2)
}
k <- length(x[1,])
if (par3 == 'Linear Trend'){
x <- cbind(x, c(1:n))
colnames(x)[k+1] <- 't'
}
x
k <- length(x[1,])
df <- as.data.frame(x)
(mylm <- lm(df))
(mysum <- summary(mylm))
bitmap(file='test0.png')
plot(x[,1], type='l', main='Actuals and Interpolation', ylab='value of Actuals and Interpolation (dots)', xlab='time or index')
points(x[,1]-mysum$resid)
grid()
dev.off()
bitmap(file='test1.png')
plot(mysum$resid, type='b', pch=19, main='Residuals', ylab='value of Residuals', xlab='time or index')
grid()
dev.off()
bitmap(file='test2.png')
hist(mysum$resid, main='Residual Histogram', xlab='values of Residuals')
grid()
dev.off()
bitmap(file='test3.png')
densityplot(~mysum$resid,col='black',main='Residual Density Plot', xlab='values of Residuals')
dev.off()
bitmap(file='test4.png')
qqnorm(mysum$resid, main='Residual Normal Q-Q Plot')
grid()
dev.off()
(myerror <- as.ts(mysum$resid))
bitmap(file='test5.png')
dum <- cbind(lag(myerror,k=1),myerror)
dum
dum1 <- dum[2:length(myerror),]
dum1
z <- as.data.frame(dum1)
z
plot(z,main=paste('Residual Lag plot, lowess, and regression line'), ylab='values of Residuals', xlab='lagged values of Residuals')
lines(lowess(z))
abline(lm(z))
grid()
dev.off()
bitmap(file='test6.png')
acf(mysum$resid, lag.max=length(mysum$resid)/2, main='Residual Autocorrelation Function')
grid()
dev.off()
bitmap(file='test7.png')
pacf(mysum$resid, lag.max=length(mysum$resid)/2, main='Residual Partial Autocorrelation Function')
grid()
dev.off()
bitmap(file='test8.png')
opar <- par(mfrow = c(2,2), oma = c(0, 0, 1.1, 0))
plot(mylm, las = 1, sub='Residual Diagnostics')
par(opar)
dev.off()
load(file='createtable')
a<-table.start()
a<-table.row.start(a)
a<-table.element(a, 'Multiple Linear Regression - Estimated Regression Equation', 1, TRUE)
a<-table.row.end(a)
myeq <- colnames(x)[1]
myeq <- paste(myeq, '[t] = ', sep='')
for (i in 1:k){
if (mysum$coefficients[i,1] > 0) myeq <- paste(myeq, '+', '')
myeq <- paste(myeq, mysum$coefficients[i,1], sep=' ')
if (rownames(mysum$coefficients)[i] != '(Intercept)') {
myeq <- paste(myeq, rownames(mysum$coefficients)[i], sep='')
if (rownames(mysum$coefficients)[i] != 't') myeq <- paste(myeq, '[t]', sep='')
}
}
myeq <- paste(myeq, ' + e[t]')
a<-table.row.start(a)
a<-table.element(a, myeq)
a<-table.row.end(a)
a<-table.end(a)
table.save(a,file='mytable1.tab')
a<-table.start()
a<-table.row.start(a)
a<-table.element(a,hyperlink('ols1.htm','Multiple Linear Regression - Ordinary Least Squares',''), 6, TRUE)
a<-table.row.end(a)
a<-table.row.start(a)
a<-table.element(a,'Variable',header=TRUE)
a<-table.element(a,'Parameter',header=TRUE)
a<-table.element(a,'S.D.',header=TRUE)
a<-table.element(a,'T-STAT
H0: parameter = 0',header=TRUE)
a<-table.element(a,'2-tail p-value',header=TRUE)
a<-table.element(a,'1-tail p-value',header=TRUE)
a<-table.row.end(a)
for (i in 1:k){
a<-table.row.start(a)
a<-table.element(a,rownames(mysum$coefficients)[i],header=TRUE)
a<-table.element(a,mysum$coefficients[i,1])
a<-table.element(a, round(mysum$coefficients[i,2],6))
a<-table.element(a, round(mysum$coefficients[i,3],4))
a<-table.element(a, round(mysum$coefficients[i,4],6))
a<-table.element(a, round(mysum$coefficients[i,4]/2,6))
a<-table.row.end(a)
}
a<-table.end(a)
table.save(a,file='mytable2.tab')
a<-table.start()
a<-table.row.start(a)
a<-table.element(a, 'Multiple Linear Regression - Regression Statistics', 2, TRUE)
a<-table.row.end(a)
a<-table.row.start(a)
a<-table.element(a, 'Multiple R',1,TRUE)
a<-table.element(a, sqrt(mysum$r.squared))
a<-table.row.end(a)
a<-table.row.start(a)
a<-table.element(a, 'R-squared',1,TRUE)
a<-table.element(a, mysum$r.squared)
a<-table.row.end(a)
a<-table.row.start(a)
a<-table.element(a, 'Adjusted R-squared',1,TRUE)
a<-table.element(a, mysum$adj.r.squared)
a<-table.row.end(a)
a<-table.row.start(a)
a<-table.element(a, 'F-TEST (value)',1,TRUE)
a<-table.element(a, mysum$fstatistic[1])
a<-table.row.end(a)
a<-table.row.start(a)
a<-table.element(a, 'F-TEST (DF numerator)',1,TRUE)
a<-table.element(a, mysum$fstatistic[2])
a<-table.row.end(a)
a<-table.row.start(a)
a<-table.element(a, 'F-TEST (DF denominator)',1,TRUE)
a<-table.element(a, mysum$fstatistic[3])
a<-table.row.end(a)
a<-table.row.start(a)
a<-table.element(a, 'p-value',1,TRUE)
a<-table.element(a, 1-pf(mysum$fstatistic[1],mysum$fstatistic[2],mysum$fstatistic[3]))
a<-table.row.end(a)
a<-table.row.start(a)
a<-table.element(a, 'Multiple Linear Regression - Residual Statistics', 2, TRUE)
a<-table.row.end(a)
a<-table.row.start(a)
a<-table.element(a, 'Residual Standard Deviation',1,TRUE)
a<-table.element(a, mysum$sigma)
a<-table.row.end(a)
a<-table.row.start(a)
a<-table.element(a, 'Sum Squared Residuals',1,TRUE)
a<-table.element(a, sum(myerror*myerror))
a<-table.row.end(a)
a<-table.end(a)
table.save(a,file='mytable3.tab')
a<-table.start()
a<-table.row.start(a)
a<-table.element(a, 'Multiple Linear Regression - Actuals, Interpolation, and Residuals', 4, TRUE)
a<-table.row.end(a)
a<-table.row.start(a)
a<-table.element(a, 'Time or Index', 1, TRUE)
a<-table.element(a, 'Actuals', 1, TRUE)
a<-table.element(a, 'Interpolation
Forecast', 1, TRUE)
a<-table.element(a, 'Residuals
Prediction Error', 1, TRUE)
a<-table.row.end(a)
for (i in 1:n) {
a<-table.row.start(a)
a<-table.element(a,i, 1, TRUE)
a<-table.element(a,x[i])
a<-table.element(a,x[i]-mysum$resid[i])
a<-table.element(a,mysum$resid[i])
a<-table.row.end(a)
}
a<-table.end(a)
table.save(a,file='mytable4.tab')