Free Statistics

of Irreproducible Research!

Author's title

Author*Unverified author*
R Software Modulerwasp_multipleregression.wasp
Title produced by softwareMultiple Regression
Date of computationThu, 15 Nov 2007 05:19:38 -0700
Cite this page as followsStatistical Computations at FreeStatistics.org, Office for Research Development and Education, URL https://freestatistics.org/blog/index.php?v=date/2007/Nov/15/t1195128846fa3o30aiwajf4b2.htm/, Retrieved Sat, 04 May 2024 16:41:27 +0000
Statistical Computations at FreeStatistics.org, Office for Research Development and Education, URL https://freestatistics.org/blog/index.php?pk=14450, Retrieved Sat, 04 May 2024 16:41:27 +0000
QR Codes:

Original text written by user:
IsPrivate?No (this computation is public)
User-defined keywordsWorkshop 6, question 3, Workshop 6, question 3, multiple lineair regression, seasonality
Estimated Impact247
Family? (F = Feedback message, R = changed R code, M = changed R Module, P = changed Parameters, D = changed Data)
-       [Multiple Regression] [Workshop 6, quest...] [2007-11-15 12:19:38] [7ed974668de91e1c5af8c06b343b508b] [Current]
-  MPD    [Multiple Regression] [] [2010-11-21 14:25:16] [74be16979710d4c4e7c6647856088456]
Feedback Forum

Post a new message
Dataseries X:
108.4	106.7
117	100.6
103.8	101.2
100.8	93.1
110.6	84.2
104	85.8
112.6	91.8
107.3	92.4
98.9	80.3
109.8	79.7
104.9	62.5
102.2	57.1
123.9	100.8
124.9	100.7
112.7	86.2
121.9	83.2
100.6	71.7
104.3	77.5
120.4	89.8
107.5	80.3
102.9	78.7
125.6	93.8
107.5	57.6
108.8	60.6
128.4	91
121.1	85.3
119.5	77.4
128.7	77.3
108.7	68.3
105.5	69.9
119.8	81.7
111.3	75.1
110.6	69.9
120.1	84
97.5	54.3
107.7	60
127.3	89.9
117.2	77
119.8	85.3
116.2	77.6
111	69.2
112.4	75.5
130.6	85.7
109.1	72.2
118.8	79.9
123.9	85.3
101.6	52.2
112.8	61.2
128	82.4
129.6	85.4
125.8	78.2
119.5	70.2
115.7	70.2
113.6	69.3
129.7	77.5
112	66.1
116.8	69
126.3	75.3
112.9	58.2
115.9	59.7


Summary of compuational transaction
Raw Inputview raw input (R code)
Raw Outputview raw output of R engine
Computing time3 seconds
R Server'Gwilym Jenkins' @ 72.249.127.135

\begin{tabular}{lllllllll}
\hline
Summary of compuational transaction \tabularnewline
Raw Input & view raw input (R code)  \tabularnewline
Raw Output & view raw output of R engine  \tabularnewline
Computing time & 3 seconds \tabularnewline
R Server & 'Gwilym Jenkins' @ 72.249.127.135 \tabularnewline
\hline
\end{tabular}
%Source: https://freestatistics.org/blog/index.php?pk=14450&T=0

[TABLE]
[ROW][C]Summary of compuational transaction[/C][/ROW]
[ROW][C]Raw Input[/C][C]view raw input (R code) [/C][/ROW]
[ROW][C]Raw Output[/C][C]view raw output of R engine [/C][/ROW]
[ROW][C]Computing time[/C][C]3 seconds[/C][/ROW]
[ROW][C]R Server[/C][C]'Gwilym Jenkins' @ 72.249.127.135[/C][/ROW]
[/TABLE]
Source: https://freestatistics.org/blog/index.php?pk=14450&T=0

Globally Unique Identifier (entire table): ba.freestatistics.org/blog/index.php?pk=14450&T=0

As an alternative you can also use a QR Code:  

The GUIDs for individual cells are displayed in the table below:

Summary of compuational transaction
Raw Inputview raw input (R code)
Raw Outputview raw output of R engine
Computing time3 seconds
R Server'Gwilym Jenkins' @ 72.249.127.135


Multiple Linear Regression - Estimated Regression Equation
Y[t] = + 108.556757497134 -0.44607926102607X[t] + 40.5602074612777M1[t] + 35.6470691776054M2[t] + 28.9911821454183M3[t] + 24.101869332547M4[t] + 12.9286273182358M5[t] + 15.2019595232404M6[t] + 31.4414814898826M7[t] + 17.4821568295589M8[t] + 15.8935295113231M9[t] + 29.101284183564M10[t] -4.81196460071992M11[t] + e[t]

\begin{tabular}{lllllllll}
\hline
Multiple Linear Regression - Estimated Regression Equation \tabularnewline
Y[t] =  +  108.556757497134 -0.44607926102607X[t] +  40.5602074612777M1[t] +  35.6470691776054M2[t] +  28.9911821454183M3[t] +  24.101869332547M4[t] +  12.9286273182358M5[t] +  15.2019595232404M6[t] +  31.4414814898826M7[t] +  17.4821568295589M8[t] +  15.8935295113231M9[t] +  29.101284183564M10[t] -4.81196460071992M11[t]  + e[t] \tabularnewline
\hline
\end{tabular}
%Source: https://freestatistics.org/blog/index.php?pk=14450&T=1

[TABLE]
[ROW][C]Multiple Linear Regression - Estimated Regression Equation[/C][/ROW]
[ROW][C]Y[t] =  +  108.556757497134 -0.44607926102607X[t] +  40.5602074612777M1[t] +  35.6470691776054M2[t] +  28.9911821454183M3[t] +  24.101869332547M4[t] +  12.9286273182358M5[t] +  15.2019595232404M6[t] +  31.4414814898826M7[t] +  17.4821568295589M8[t] +  15.8935295113231M9[t] +  29.101284183564M10[t] -4.81196460071992M11[t]  + e[t][/C][/ROW]
[/TABLE]
Source: https://freestatistics.org/blog/index.php?pk=14450&T=1

Globally Unique Identifier (entire table): ba.freestatistics.org/blog/index.php?pk=14450&T=1

As an alternative you can also use a QR Code:  

The GUIDs for individual cells are displayed in the table below:

Multiple Linear Regression - Estimated Regression Equation
Y[t] = + 108.556757497134 -0.44607926102607X[t] + 40.5602074612777M1[t] + 35.6470691776054M2[t] + 28.9911821454183M3[t] + 24.101869332547M4[t] + 12.9286273182358M5[t] + 15.2019595232404M6[t] + 31.4414814898826M7[t] + 17.4821568295589M8[t] + 15.8935295113231M9[t] + 29.101284183564M10[t] -4.81196460071992M11[t] + e[t]


Multiple Linear Regression - Ordinary Least Squares
VariableParameterS.D.T-STATH0: parameter = 02-tail p-value1-tail p-value
(Intercept)108.55675749713416.2176216.693800
X-0.446079261026070.145379-3.06840.0035670.001783
M140.56020746127774.8331128.392200
M235.64706917760544.7615487.486400
M328.99118214541834.5132446.423600
M424.1018693325474.5511525.29583e-062e-06
M512.92862731823584.4023972.93670.0051230.002561
M615.20195952324044.4078783.44880.0011980.000599
M731.44148148988264.7989286.551800
M817.48215682955894.402343.97110.0002440.000122
M915.89352951132314.402373.61020.0007410.00037
M1029.1012841835644.7174126.168900
M11-4.811964600719924.452839-1.08070.2853660.142683

\begin{tabular}{lllllllll}
\hline
Multiple Linear Regression - Ordinary Least Squares \tabularnewline
Variable & Parameter & S.D. & T-STATH0: parameter = 0 & 2-tail p-value & 1-tail p-value \tabularnewline
(Intercept) & 108.556757497134 & 16.217621 & 6.6938 & 0 & 0 \tabularnewline
X & -0.44607926102607 & 0.145379 & -3.0684 & 0.003567 & 0.001783 \tabularnewline
M1 & 40.5602074612777 & 4.833112 & 8.3922 & 0 & 0 \tabularnewline
M2 & 35.6470691776054 & 4.761548 & 7.4864 & 0 & 0 \tabularnewline
M3 & 28.9911821454183 & 4.513244 & 6.4236 & 0 & 0 \tabularnewline
M4 & 24.101869332547 & 4.551152 & 5.2958 & 3e-06 & 2e-06 \tabularnewline
M5 & 12.9286273182358 & 4.402397 & 2.9367 & 0.005123 & 0.002561 \tabularnewline
M6 & 15.2019595232404 & 4.407878 & 3.4488 & 0.001198 & 0.000599 \tabularnewline
M7 & 31.4414814898826 & 4.798928 & 6.5518 & 0 & 0 \tabularnewline
M8 & 17.4821568295589 & 4.40234 & 3.9711 & 0.000244 & 0.000122 \tabularnewline
M9 & 15.8935295113231 & 4.40237 & 3.6102 & 0.000741 & 0.00037 \tabularnewline
M10 & 29.101284183564 & 4.717412 & 6.1689 & 0 & 0 \tabularnewline
M11 & -4.81196460071992 & 4.452839 & -1.0807 & 0.285366 & 0.142683 \tabularnewline
\hline
\end{tabular}
%Source: https://freestatistics.org/blog/index.php?pk=14450&T=2

[TABLE]
[ROW][C]Multiple Linear Regression - Ordinary Least Squares[/C][/ROW]
[ROW][C]Variable[/C][C]Parameter[/C][C]S.D.[/C][C]T-STATH0: parameter = 0[/C][C]2-tail p-value[/C][C]1-tail p-value[/C][/ROW]
[ROW][C](Intercept)[/C][C]108.556757497134[/C][C]16.217621[/C][C]6.6938[/C][C]0[/C][C]0[/C][/ROW]
[ROW][C]X[/C][C]-0.44607926102607[/C][C]0.145379[/C][C]-3.0684[/C][C]0.003567[/C][C]0.001783[/C][/ROW]
[ROW][C]M1[/C][C]40.5602074612777[/C][C]4.833112[/C][C]8.3922[/C][C]0[/C][C]0[/C][/ROW]
[ROW][C]M2[/C][C]35.6470691776054[/C][C]4.761548[/C][C]7.4864[/C][C]0[/C][C]0[/C][/ROW]
[ROW][C]M3[/C][C]28.9911821454183[/C][C]4.513244[/C][C]6.4236[/C][C]0[/C][C]0[/C][/ROW]
[ROW][C]M4[/C][C]24.101869332547[/C][C]4.551152[/C][C]5.2958[/C][C]3e-06[/C][C]2e-06[/C][/ROW]
[ROW][C]M5[/C][C]12.9286273182358[/C][C]4.402397[/C][C]2.9367[/C][C]0.005123[/C][C]0.002561[/C][/ROW]
[ROW][C]M6[/C][C]15.2019595232404[/C][C]4.407878[/C][C]3.4488[/C][C]0.001198[/C][C]0.000599[/C][/ROW]
[ROW][C]M7[/C][C]31.4414814898826[/C][C]4.798928[/C][C]6.5518[/C][C]0[/C][C]0[/C][/ROW]
[ROW][C]M8[/C][C]17.4821568295589[/C][C]4.40234[/C][C]3.9711[/C][C]0.000244[/C][C]0.000122[/C][/ROW]
[ROW][C]M9[/C][C]15.8935295113231[/C][C]4.40237[/C][C]3.6102[/C][C]0.000741[/C][C]0.00037[/C][/ROW]
[ROW][C]M10[/C][C]29.101284183564[/C][C]4.717412[/C][C]6.1689[/C][C]0[/C][C]0[/C][/ROW]
[ROW][C]M11[/C][C]-4.81196460071992[/C][C]4.452839[/C][C]-1.0807[/C][C]0.285366[/C][C]0.142683[/C][/ROW]
[/TABLE]
Source: https://freestatistics.org/blog/index.php?pk=14450&T=2

Globally Unique Identifier (entire table): ba.freestatistics.org/blog/index.php?pk=14450&T=2

As an alternative you can also use a QR Code:  

The GUIDs for individual cells are displayed in the table below:

Multiple Linear Regression - Ordinary Least Squares
VariableParameterS.D.T-STATH0: parameter = 02-tail p-value1-tail p-value
(Intercept)108.55675749713416.2176216.693800
X-0.446079261026070.145379-3.06840.0035670.001783
M140.56020746127774.8331128.392200
M235.64706917760544.7615487.486400
M328.99118214541834.5132446.423600
M424.1018693325474.5511525.29583e-062e-06
M512.92862731823584.4023972.93670.0051230.002561
M615.20195952324044.4078783.44880.0011980.000599
M731.44148148988264.7989286.551800
M817.48215682955894.402343.97110.0002440.000122
M915.89352951132314.402373.61020.0007410.00037
M1029.1012841835644.7174126.168900
M11-4.811964600719924.452839-1.08070.2853660.142683


Multiple Linear Regression - Regression Statistics
Multiple R0.87286876382315
R-squared0.761899878858152
Adjusted R-squared0.701108358566617
F-TEST (value)12.532995970562
F-TEST (DF numerator)12
F-TEST (DF denominator)47
p-value6.69052591106833e-11
Multiple Linear Regression - Residual Statistics
Residual Standard Deviation6.96070391037835
Sum Squared Residuals2277.21574961396

\begin{tabular}{lllllllll}
\hline
Multiple Linear Regression - Regression Statistics \tabularnewline
Multiple R & 0.87286876382315 \tabularnewline
R-squared & 0.761899878858152 \tabularnewline
Adjusted R-squared & 0.701108358566617 \tabularnewline
F-TEST (value) & 12.532995970562 \tabularnewline
F-TEST (DF numerator) & 12 \tabularnewline
F-TEST (DF denominator) & 47 \tabularnewline
p-value & 6.69052591106833e-11 \tabularnewline
Multiple Linear Regression - Residual Statistics \tabularnewline
Residual Standard Deviation & 6.96070391037835 \tabularnewline
Sum Squared Residuals & 2277.21574961396 \tabularnewline
\hline
\end{tabular}
%Source: https://freestatistics.org/blog/index.php?pk=14450&T=3

[TABLE]
[ROW][C]Multiple Linear Regression - Regression Statistics[/C][/ROW]
[ROW][C]Multiple R[/C][C]0.87286876382315[/C][/ROW]
[ROW][C]R-squared[/C][C]0.761899878858152[/C][/ROW]
[ROW][C]Adjusted R-squared[/C][C]0.701108358566617[/C][/ROW]
[ROW][C]F-TEST (value)[/C][C]12.532995970562[/C][/ROW]
[ROW][C]F-TEST (DF numerator)[/C][C]12[/C][/ROW]
[ROW][C]F-TEST (DF denominator)[/C][C]47[/C][/ROW]
[ROW][C]p-value[/C][C]6.69052591106833e-11[/C][/ROW]
[ROW][C]Multiple Linear Regression - Residual Statistics[/C][/ROW]
[ROW][C]Residual Standard Deviation[/C][C]6.96070391037835[/C][/ROW]
[ROW][C]Sum Squared Residuals[/C][C]2277.21574961396[/C][/ROW]
[/TABLE]
Source: https://freestatistics.org/blog/index.php?pk=14450&T=3

Globally Unique Identifier (entire table): ba.freestatistics.org/blog/index.php?pk=14450&T=3

As an alternative you can also use a QR Code:  

The GUIDs for individual cells are displayed in the table below:

Multiple Linear Regression - Regression Statistics
Multiple R0.87286876382315
R-squared0.761899878858152
Adjusted R-squared0.701108358566617
F-TEST (value)12.532995970562
F-TEST (DF numerator)12
F-TEST (DF denominator)47
p-value6.69052591106833e-11
Multiple Linear Regression - Residual Statistics
Residual Standard Deviation6.96070391037835
Sum Squared Residuals2277.21574961396


Multiple Linear Regression - Actuals, Interpolation, and Residuals
Time or IndexActualsInterpolationForecastResidualsPrediction Error
1106.7100.7619730631865.93802693681423
2100.692.01255313468938.5874468653107
3101.291.24491234804649.9550876519536
493.187.69383731825335.4061626817467
584.272.149018545886612.0509814541133
685.877.36647387366328.43352612633676
791.889.76971419548122.03028580451877
892.478.174609618595814.2253903814042
980.380.3330480929789-0.0330480929789354
1079.788.6785388200356-8.9785388200356
1162.556.95107841477955.54892158522053
1257.162.9674570202698-5.8674570202698
13100.893.84774451728186.95225548271823
14100.788.488526972583412.2114730274167
1586.287.2748069249144-1.07480692491437
1683.278.28156491060324.91843508939681
1771.776.6098111561473-4.90981115614733
1877.577.23265009535540.267349904644579
1989.886.29029595947793.50970404052213
2080.378.08539376639062.21460623360942
2178.778.54873104887470.151268951125325
2293.881.630486495823712.1695135041763
2357.655.79127233611171.80872766388830
2460.660.02333389749770.576666102502276
259191.8403878426645-0.840387842664454
2685.390.1836281644824-4.88362816448243
2777.484.2414679499371-6.8414679499371
2877.375.24822593562592.05177406437407
2968.372.9965691418362-4.69656914183617
3069.976.6973549821241-6.79735498212413
3181.786.5579435160935-4.85794351609352
3275.176.3902925744915-1.29029257449151
3369.975.113920738974-5.21392073897393
348484.0839224314671-0.0839224314671194
3554.360.2520649463724-5.95206494637241
366060.5140210846264-0.5140210846264
3789.992.3310750297931-2.43107502979313
387791.9233372824841-14.9233372824841
3985.384.10764417162931.19235582837072
4077.680.8242166984518-3.2242166984518
4169.271.9705868414762-2.77058684147619
4275.573.61940808104421.88059191895575
4385.781.7402874970123.95971250298805
4472.277.3716669487489-5.17166694874886
4579.971.45607079856028.44392920143985
4685.382.3888212395682.91117876043194
4752.258.4231399761655-6.22313997616551
4861.258.23901685339342.96098314660656
4982.492.0188195470749-9.61881954707488
5085.486.3919544457608-0.991954445760813
5178.281.4311686054729-3.23116860547286
5270.279.3521551370658-9.15215513706576
5370.269.87401431465370.325985685346336
5469.373.084112967813-3.78411296781297
5577.582.1417588319354-4.64175883193543
5666.176.0780370917733-9.97803709177327
576972.3482293206123-3.3482293206123
5875.381.3182310131055-6.01823101310548
5958.253.38244432657094.81755567342909
6059.756.85617114421262.84382885578738

\begin{tabular}{lllllllll}
\hline
Multiple Linear Regression - Actuals, Interpolation, and Residuals \tabularnewline
Time or Index & Actuals & InterpolationForecast & ResidualsPrediction Error \tabularnewline
1 & 106.7 & 100.761973063186 & 5.93802693681423 \tabularnewline
2 & 100.6 & 92.0125531346893 & 8.5874468653107 \tabularnewline
3 & 101.2 & 91.2449123480464 & 9.9550876519536 \tabularnewline
4 & 93.1 & 87.6938373182533 & 5.4061626817467 \tabularnewline
5 & 84.2 & 72.1490185458866 & 12.0509814541133 \tabularnewline
6 & 85.8 & 77.3664738736632 & 8.43352612633676 \tabularnewline
7 & 91.8 & 89.7697141954812 & 2.03028580451877 \tabularnewline
8 & 92.4 & 78.1746096185958 & 14.2253903814042 \tabularnewline
9 & 80.3 & 80.3330480929789 & -0.0330480929789354 \tabularnewline
10 & 79.7 & 88.6785388200356 & -8.9785388200356 \tabularnewline
11 & 62.5 & 56.9510784147795 & 5.54892158522053 \tabularnewline
12 & 57.1 & 62.9674570202698 & -5.8674570202698 \tabularnewline
13 & 100.8 & 93.8477445172818 & 6.95225548271823 \tabularnewline
14 & 100.7 & 88.4885269725834 & 12.2114730274167 \tabularnewline
15 & 86.2 & 87.2748069249144 & -1.07480692491437 \tabularnewline
16 & 83.2 & 78.2815649106032 & 4.91843508939681 \tabularnewline
17 & 71.7 & 76.6098111561473 & -4.90981115614733 \tabularnewline
18 & 77.5 & 77.2326500953554 & 0.267349904644579 \tabularnewline
19 & 89.8 & 86.2902959594779 & 3.50970404052213 \tabularnewline
20 & 80.3 & 78.0853937663906 & 2.21460623360942 \tabularnewline
21 & 78.7 & 78.5487310488747 & 0.151268951125325 \tabularnewline
22 & 93.8 & 81.6304864958237 & 12.1695135041763 \tabularnewline
23 & 57.6 & 55.7912723361117 & 1.80872766388830 \tabularnewline
24 & 60.6 & 60.0233338974977 & 0.576666102502276 \tabularnewline
25 & 91 & 91.8403878426645 & -0.840387842664454 \tabularnewline
26 & 85.3 & 90.1836281644824 & -4.88362816448243 \tabularnewline
27 & 77.4 & 84.2414679499371 & -6.8414679499371 \tabularnewline
28 & 77.3 & 75.2482259356259 & 2.05177406437407 \tabularnewline
29 & 68.3 & 72.9965691418362 & -4.69656914183617 \tabularnewline
30 & 69.9 & 76.6973549821241 & -6.79735498212413 \tabularnewline
31 & 81.7 & 86.5579435160935 & -4.85794351609352 \tabularnewline
32 & 75.1 & 76.3902925744915 & -1.29029257449151 \tabularnewline
33 & 69.9 & 75.113920738974 & -5.21392073897393 \tabularnewline
34 & 84 & 84.0839224314671 & -0.0839224314671194 \tabularnewline
35 & 54.3 & 60.2520649463724 & -5.95206494637241 \tabularnewline
36 & 60 & 60.5140210846264 & -0.5140210846264 \tabularnewline
37 & 89.9 & 92.3310750297931 & -2.43107502979313 \tabularnewline
38 & 77 & 91.9233372824841 & -14.9233372824841 \tabularnewline
39 & 85.3 & 84.1076441716293 & 1.19235582837072 \tabularnewline
40 & 77.6 & 80.8242166984518 & -3.2242166984518 \tabularnewline
41 & 69.2 & 71.9705868414762 & -2.77058684147619 \tabularnewline
42 & 75.5 & 73.6194080810442 & 1.88059191895575 \tabularnewline
43 & 85.7 & 81.740287497012 & 3.95971250298805 \tabularnewline
44 & 72.2 & 77.3716669487489 & -5.17166694874886 \tabularnewline
45 & 79.9 & 71.4560707985602 & 8.44392920143985 \tabularnewline
46 & 85.3 & 82.388821239568 & 2.91117876043194 \tabularnewline
47 & 52.2 & 58.4231399761655 & -6.22313997616551 \tabularnewline
48 & 61.2 & 58.2390168533934 & 2.96098314660656 \tabularnewline
49 & 82.4 & 92.0188195470749 & -9.61881954707488 \tabularnewline
50 & 85.4 & 86.3919544457608 & -0.991954445760813 \tabularnewline
51 & 78.2 & 81.4311686054729 & -3.23116860547286 \tabularnewline
52 & 70.2 & 79.3521551370658 & -9.15215513706576 \tabularnewline
53 & 70.2 & 69.8740143146537 & 0.325985685346336 \tabularnewline
54 & 69.3 & 73.084112967813 & -3.78411296781297 \tabularnewline
55 & 77.5 & 82.1417588319354 & -4.64175883193543 \tabularnewline
56 & 66.1 & 76.0780370917733 & -9.97803709177327 \tabularnewline
57 & 69 & 72.3482293206123 & -3.3482293206123 \tabularnewline
58 & 75.3 & 81.3182310131055 & -6.01823101310548 \tabularnewline
59 & 58.2 & 53.3824443265709 & 4.81755567342909 \tabularnewline
60 & 59.7 & 56.8561711442126 & 2.84382885578738 \tabularnewline
\hline
\end{tabular}
%Source: https://freestatistics.org/blog/index.php?pk=14450&T=4

[TABLE]
[ROW][C]Multiple Linear Regression - Actuals, Interpolation, and Residuals[/C][/ROW]
[ROW][C]Time or Index[/C][C]Actuals[/C][C]InterpolationForecast[/C][C]ResidualsPrediction Error[/C][/ROW]
[ROW][C]1[/C][C]106.7[/C][C]100.761973063186[/C][C]5.93802693681423[/C][/ROW]
[ROW][C]2[/C][C]100.6[/C][C]92.0125531346893[/C][C]8.5874468653107[/C][/ROW]
[ROW][C]3[/C][C]101.2[/C][C]91.2449123480464[/C][C]9.9550876519536[/C][/ROW]
[ROW][C]4[/C][C]93.1[/C][C]87.6938373182533[/C][C]5.4061626817467[/C][/ROW]
[ROW][C]5[/C][C]84.2[/C][C]72.1490185458866[/C][C]12.0509814541133[/C][/ROW]
[ROW][C]6[/C][C]85.8[/C][C]77.3664738736632[/C][C]8.43352612633676[/C][/ROW]
[ROW][C]7[/C][C]91.8[/C][C]89.7697141954812[/C][C]2.03028580451877[/C][/ROW]
[ROW][C]8[/C][C]92.4[/C][C]78.1746096185958[/C][C]14.2253903814042[/C][/ROW]
[ROW][C]9[/C][C]80.3[/C][C]80.3330480929789[/C][C]-0.0330480929789354[/C][/ROW]
[ROW][C]10[/C][C]79.7[/C][C]88.6785388200356[/C][C]-8.9785388200356[/C][/ROW]
[ROW][C]11[/C][C]62.5[/C][C]56.9510784147795[/C][C]5.54892158522053[/C][/ROW]
[ROW][C]12[/C][C]57.1[/C][C]62.9674570202698[/C][C]-5.8674570202698[/C][/ROW]
[ROW][C]13[/C][C]100.8[/C][C]93.8477445172818[/C][C]6.95225548271823[/C][/ROW]
[ROW][C]14[/C][C]100.7[/C][C]88.4885269725834[/C][C]12.2114730274167[/C][/ROW]
[ROW][C]15[/C][C]86.2[/C][C]87.2748069249144[/C][C]-1.07480692491437[/C][/ROW]
[ROW][C]16[/C][C]83.2[/C][C]78.2815649106032[/C][C]4.91843508939681[/C][/ROW]
[ROW][C]17[/C][C]71.7[/C][C]76.6098111561473[/C][C]-4.90981115614733[/C][/ROW]
[ROW][C]18[/C][C]77.5[/C][C]77.2326500953554[/C][C]0.267349904644579[/C][/ROW]
[ROW][C]19[/C][C]89.8[/C][C]86.2902959594779[/C][C]3.50970404052213[/C][/ROW]
[ROW][C]20[/C][C]80.3[/C][C]78.0853937663906[/C][C]2.21460623360942[/C][/ROW]
[ROW][C]21[/C][C]78.7[/C][C]78.5487310488747[/C][C]0.151268951125325[/C][/ROW]
[ROW][C]22[/C][C]93.8[/C][C]81.6304864958237[/C][C]12.1695135041763[/C][/ROW]
[ROW][C]23[/C][C]57.6[/C][C]55.7912723361117[/C][C]1.80872766388830[/C][/ROW]
[ROW][C]24[/C][C]60.6[/C][C]60.0233338974977[/C][C]0.576666102502276[/C][/ROW]
[ROW][C]25[/C][C]91[/C][C]91.8403878426645[/C][C]-0.840387842664454[/C][/ROW]
[ROW][C]26[/C][C]85.3[/C][C]90.1836281644824[/C][C]-4.88362816448243[/C][/ROW]
[ROW][C]27[/C][C]77.4[/C][C]84.2414679499371[/C][C]-6.8414679499371[/C][/ROW]
[ROW][C]28[/C][C]77.3[/C][C]75.2482259356259[/C][C]2.05177406437407[/C][/ROW]
[ROW][C]29[/C][C]68.3[/C][C]72.9965691418362[/C][C]-4.69656914183617[/C][/ROW]
[ROW][C]30[/C][C]69.9[/C][C]76.6973549821241[/C][C]-6.79735498212413[/C][/ROW]
[ROW][C]31[/C][C]81.7[/C][C]86.5579435160935[/C][C]-4.85794351609352[/C][/ROW]
[ROW][C]32[/C][C]75.1[/C][C]76.3902925744915[/C][C]-1.29029257449151[/C][/ROW]
[ROW][C]33[/C][C]69.9[/C][C]75.113920738974[/C][C]-5.21392073897393[/C][/ROW]
[ROW][C]34[/C][C]84[/C][C]84.0839224314671[/C][C]-0.0839224314671194[/C][/ROW]
[ROW][C]35[/C][C]54.3[/C][C]60.2520649463724[/C][C]-5.95206494637241[/C][/ROW]
[ROW][C]36[/C][C]60[/C][C]60.5140210846264[/C][C]-0.5140210846264[/C][/ROW]
[ROW][C]37[/C][C]89.9[/C][C]92.3310750297931[/C][C]-2.43107502979313[/C][/ROW]
[ROW][C]38[/C][C]77[/C][C]91.9233372824841[/C][C]-14.9233372824841[/C][/ROW]
[ROW][C]39[/C][C]85.3[/C][C]84.1076441716293[/C][C]1.19235582837072[/C][/ROW]
[ROW][C]40[/C][C]77.6[/C][C]80.8242166984518[/C][C]-3.2242166984518[/C][/ROW]
[ROW][C]41[/C][C]69.2[/C][C]71.9705868414762[/C][C]-2.77058684147619[/C][/ROW]
[ROW][C]42[/C][C]75.5[/C][C]73.6194080810442[/C][C]1.88059191895575[/C][/ROW]
[ROW][C]43[/C][C]85.7[/C][C]81.740287497012[/C][C]3.95971250298805[/C][/ROW]
[ROW][C]44[/C][C]72.2[/C][C]77.3716669487489[/C][C]-5.17166694874886[/C][/ROW]
[ROW][C]45[/C][C]79.9[/C][C]71.4560707985602[/C][C]8.44392920143985[/C][/ROW]
[ROW][C]46[/C][C]85.3[/C][C]82.388821239568[/C][C]2.91117876043194[/C][/ROW]
[ROW][C]47[/C][C]52.2[/C][C]58.4231399761655[/C][C]-6.22313997616551[/C][/ROW]
[ROW][C]48[/C][C]61.2[/C][C]58.2390168533934[/C][C]2.96098314660656[/C][/ROW]
[ROW][C]49[/C][C]82.4[/C][C]92.0188195470749[/C][C]-9.61881954707488[/C][/ROW]
[ROW][C]50[/C][C]85.4[/C][C]86.3919544457608[/C][C]-0.991954445760813[/C][/ROW]
[ROW][C]51[/C][C]78.2[/C][C]81.4311686054729[/C][C]-3.23116860547286[/C][/ROW]
[ROW][C]52[/C][C]70.2[/C][C]79.3521551370658[/C][C]-9.15215513706576[/C][/ROW]
[ROW][C]53[/C][C]70.2[/C][C]69.8740143146537[/C][C]0.325985685346336[/C][/ROW]
[ROW][C]54[/C][C]69.3[/C][C]73.084112967813[/C][C]-3.78411296781297[/C][/ROW]
[ROW][C]55[/C][C]77.5[/C][C]82.1417588319354[/C][C]-4.64175883193543[/C][/ROW]
[ROW][C]56[/C][C]66.1[/C][C]76.0780370917733[/C][C]-9.97803709177327[/C][/ROW]
[ROW][C]57[/C][C]69[/C][C]72.3482293206123[/C][C]-3.3482293206123[/C][/ROW]
[ROW][C]58[/C][C]75.3[/C][C]81.3182310131055[/C][C]-6.01823101310548[/C][/ROW]
[ROW][C]59[/C][C]58.2[/C][C]53.3824443265709[/C][C]4.81755567342909[/C][/ROW]
[ROW][C]60[/C][C]59.7[/C][C]56.8561711442126[/C][C]2.84382885578738[/C][/ROW]
[/TABLE]
Source: https://freestatistics.org/blog/index.php?pk=14450&T=4

Globally Unique Identifier (entire table): ba.freestatistics.org/blog/index.php?pk=14450&T=4

As an alternative you can also use a QR Code:  

The GUIDs for individual cells are displayed in the table below:

Multiple Linear Regression - Actuals, Interpolation, and Residuals
Time or IndexActualsInterpolationForecastResidualsPrediction Error
1106.7100.7619730631865.93802693681423
2100.692.01255313468938.5874468653107
3101.291.24491234804649.9550876519536
493.187.69383731825335.4061626817467
584.272.149018545886612.0509814541133
685.877.36647387366328.43352612633676
791.889.76971419548122.03028580451877
892.478.174609618595814.2253903814042
980.380.3330480929789-0.0330480929789354
1079.788.6785388200356-8.9785388200356
1162.556.95107841477955.54892158522053
1257.162.9674570202698-5.8674570202698
13100.893.84774451728186.95225548271823
14100.788.488526972583412.2114730274167
1586.287.2748069249144-1.07480692491437
1683.278.28156491060324.91843508939681
1771.776.6098111561473-4.90981115614733
1877.577.23265009535540.267349904644579
1989.886.29029595947793.50970404052213
2080.378.08539376639062.21460623360942
2178.778.54873104887470.151268951125325
2293.881.630486495823712.1695135041763
2357.655.79127233611171.80872766388830
2460.660.02333389749770.576666102502276
259191.8403878426645-0.840387842664454
2685.390.1836281644824-4.88362816448243
2777.484.2414679499371-6.8414679499371
2877.375.24822593562592.05177406437407
2968.372.9965691418362-4.69656914183617
3069.976.6973549821241-6.79735498212413
3181.786.5579435160935-4.85794351609352
3275.176.3902925744915-1.29029257449151
3369.975.113920738974-5.21392073897393
348484.0839224314671-0.0839224314671194
3554.360.2520649463724-5.95206494637241
366060.5140210846264-0.5140210846264
3789.992.3310750297931-2.43107502979313
387791.9233372824841-14.9233372824841
3985.384.10764417162931.19235582837072
4077.680.8242166984518-3.2242166984518
4169.271.9705868414762-2.77058684147619
4275.573.61940808104421.88059191895575
4385.781.7402874970123.95971250298805
4472.277.3716669487489-5.17166694874886
4579.971.45607079856028.44392920143985
4685.382.3888212395682.91117876043194
4752.258.4231399761655-6.22313997616551
4861.258.23901685339342.96098314660656
4982.492.0188195470749-9.61881954707488
5085.486.3919544457608-0.991954445760813
5178.281.4311686054729-3.23116860547286
5270.279.3521551370658-9.15215513706576
5370.269.87401431465370.325985685346336
5469.373.084112967813-3.78411296781297
5577.582.1417588319354-4.64175883193543
5666.176.0780370917733-9.97803709177327
576972.3482293206123-3.3482293206123
5875.381.3182310131055-6.01823101310548
5958.253.38244432657094.81755567342909
6059.756.85617114421262.84382885578738


Parameters (Session):
par1 = 2 ; par2 = Do not include Seasonal Dummies ; par3 = No Linear Trend ;
Parameters (R input):
par1 = 2 ; par2 = Include Monthly Dummies ; par3 = No Linear Trend ;
R code (references can be found in the software module):
library(lattice)
par1 <- as.numeric(par1)
x <- t(y)
k <- length(x[1,])
n <- length(x[,1])
x1 <- cbind(x[,par1], x[,1:k!=par1])
mycolnames <- c(colnames(x)[par1], colnames(x)[1:k!=par1])
colnames(x1) <- mycolnames #colnames(x)[par1]
x <- x1
if (par3 == 'First Differences'){
x2 <- array(0, dim=c(n-1,k), dimnames=list(1:(n-1), paste('(1-B)',colnames(x),sep='')))
for (i in 1:n-1) {
for (j in 1:k) {
x2[i,j] <- x[i+1,j] - x[i,j]
}
}
x <- x2
}
if (par2 == 'Include Monthly Dummies'){
x2 <- array(0, dim=c(n,11), dimnames=list(1:n, paste('M', seq(1:11), sep ='')))
for (i in 1:11){
x2[seq(i,n,12),i] <- 1
}
x <- cbind(x, x2)
}
if (par2 == 'Include Quarterly Dummies'){
x2 <- array(0, dim=c(n,3), dimnames=list(1:n, paste('Q', seq(1:3), sep ='')))
for (i in 1:3){
x2[seq(i,n,4),i] <- 1
}
x <- cbind(x, x2)
}
k <- length(x[1,])
if (par3 == 'Linear Trend'){
x <- cbind(x, c(1:n))
colnames(x)[k+1] <- 't'
}
x
k <- length(x[1,])
df <- as.data.frame(x)
(mylm <- lm(df))
(mysum <- summary(mylm))
bitmap(file='test0.png')
plot(x[,1], type='l', main='Actuals and Interpolation', ylab='value of Actuals and Interpolation (dots)', xlab='time or index')
points(x[,1]-mysum$resid)
grid()
dev.off()
bitmap(file='test1.png')
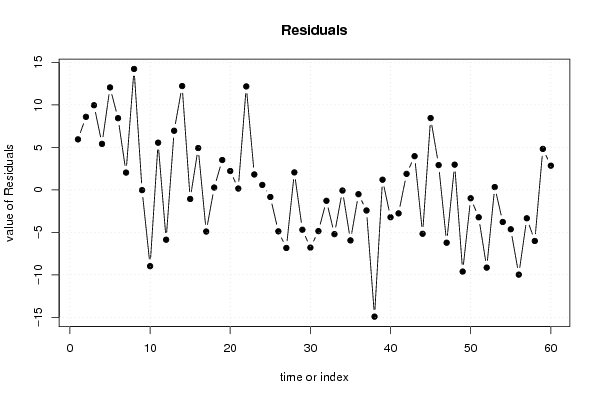
plot(mysum$resid, type='b', pch=19, main='Residuals', ylab='value of Residuals', xlab='time or index')
grid()
dev.off()
bitmap(file='test2.png')
hist(mysum$resid, main='Residual Histogram', xlab='values of Residuals')
grid()
dev.off()
bitmap(file='test3.png')
densityplot(~mysum$resid,col='black',main='Residual Density Plot', xlab='values of Residuals')
dev.off()
bitmap(file='test4.png')
qqnorm(mysum$resid, main='Residual Normal Q-Q Plot')
grid()
dev.off()
(myerror <- as.ts(mysum$resid))
bitmap(file='test5.png')
dum <- cbind(lag(myerror,k=1),myerror)
dum
dum1 <- dum[2:length(myerror),]
dum1
z <- as.data.frame(dum1)
z
plot(z,main=paste('Residual Lag plot, lowess, and regression line'), ylab='values of Residuals', xlab='lagged values of Residuals')
lines(lowess(z))
abline(lm(z))
grid()
dev.off()
bitmap(file='test6.png')
acf(mysum$resid, lag.max=length(mysum$resid)/2, main='Residual Autocorrelation Function')
grid()
dev.off()
bitmap(file='test7.png')
pacf(mysum$resid, lag.max=length(mysum$resid)/2, main='Residual Partial Autocorrelation Function')
grid()
dev.off()
bitmap(file='test8.png')
opar <- par(mfrow = c(2,2), oma = c(0, 0, 1.1, 0))
plot(mylm, las = 1, sub='Residual Diagnostics')
par(opar)
dev.off()
load(file='createtable')
a<-table.start()
a<-table.row.start(a)
a<-table.element(a, 'Multiple Linear Regression - Estimated Regression Equation', 1, TRUE)
a<-table.row.end(a)
myeq <- colnames(x)[1]
myeq <- paste(myeq, '[t] = ', sep='')
for (i in 1:k){
if (mysum$coefficients[i,1] > 0) myeq <- paste(myeq, '+', '')
myeq <- paste(myeq, mysum$coefficients[i,1], sep=' ')
if (rownames(mysum$coefficients)[i] != '(Intercept)') {
myeq <- paste(myeq, rownames(mysum$coefficients)[i], sep='')
if (rownames(mysum$coefficients)[i] != 't') myeq <- paste(myeq, '[t]', sep='')
}
}
myeq <- paste(myeq, ' + e[t]')
a<-table.row.start(a)
a<-table.element(a, myeq)
a<-table.row.end(a)
a<-table.end(a)
table.save(a,file='mytable1.tab')
a<-table.start()
a<-table.row.start(a)
a<-table.element(a,hyperlink('ols1.htm','Multiple Linear Regression - Ordinary Least Squares',''), 6, TRUE)
a<-table.row.end(a)
a<-table.row.start(a)
a<-table.element(a,'Variable',header=TRUE)
a<-table.element(a,'Parameter',header=TRUE)
a<-table.element(a,'S.D.',header=TRUE)
a<-table.element(a,'T-STAT
H0: parameter = 0',header=TRUE)
a<-table.element(a,'2-tail p-value',header=TRUE)
a<-table.element(a,'1-tail p-value',header=TRUE)
a<-table.row.end(a)
for (i in 1:k){
a<-table.row.start(a)
a<-table.element(a,rownames(mysum$coefficients)[i],header=TRUE)
a<-table.element(a,mysum$coefficients[i,1])
a<-table.element(a, round(mysum$coefficients[i,2],6))
a<-table.element(a, round(mysum$coefficients[i,3],4))
a<-table.element(a, round(mysum$coefficients[i,4],6))
a<-table.element(a, round(mysum$coefficients[i,4]/2,6))
a<-table.row.end(a)
}
a<-table.end(a)
table.save(a,file='mytable2.tab')
a<-table.start()
a<-table.row.start(a)
a<-table.element(a, 'Multiple Linear Regression - Regression Statistics', 2, TRUE)
a<-table.row.end(a)
a<-table.row.start(a)
a<-table.element(a, 'Multiple R',1,TRUE)
a<-table.element(a, sqrt(mysum$r.squared))
a<-table.row.end(a)
a<-table.row.start(a)
a<-table.element(a, 'R-squared',1,TRUE)
a<-table.element(a, mysum$r.squared)
a<-table.row.end(a)
a<-table.row.start(a)
a<-table.element(a, 'Adjusted R-squared',1,TRUE)
a<-table.element(a, mysum$adj.r.squared)
a<-table.row.end(a)
a<-table.row.start(a)
a<-table.element(a, 'F-TEST (value)',1,TRUE)
a<-table.element(a, mysum$fstatistic[1])
a<-table.row.end(a)
a<-table.row.start(a)
a<-table.element(a, 'F-TEST (DF numerator)',1,TRUE)
a<-table.element(a, mysum$fstatistic[2])
a<-table.row.end(a)
a<-table.row.start(a)
a<-table.element(a, 'F-TEST (DF denominator)',1,TRUE)
a<-table.element(a, mysum$fstatistic[3])
a<-table.row.end(a)
a<-table.row.start(a)
a<-table.element(a, 'p-value',1,TRUE)
a<-table.element(a, 1-pf(mysum$fstatistic[1],mysum$fstatistic[2],mysum$fstatistic[3]))
a<-table.row.end(a)
a<-table.row.start(a)
a<-table.element(a, 'Multiple Linear Regression - Residual Statistics', 2, TRUE)
a<-table.row.end(a)
a<-table.row.start(a)
a<-table.element(a, 'Residual Standard Deviation',1,TRUE)
a<-table.element(a, mysum$sigma)
a<-table.row.end(a)
a<-table.row.start(a)
a<-table.element(a, 'Sum Squared Residuals',1,TRUE)
a<-table.element(a, sum(myerror*myerror))
a<-table.row.end(a)
a<-table.end(a)
table.save(a,file='mytable3.tab')
a<-table.start()
a<-table.row.start(a)
a<-table.element(a, 'Multiple Linear Regression - Actuals, Interpolation, and Residuals', 4, TRUE)
a<-table.row.end(a)
a<-table.row.start(a)
a<-table.element(a, 'Time or Index', 1, TRUE)
a<-table.element(a, 'Actuals', 1, TRUE)
a<-table.element(a, 'Interpolation
Forecast', 1, TRUE)
a<-table.element(a, 'Residuals
Prediction Error', 1, TRUE)
a<-table.row.end(a)
for (i in 1:n) {
a<-table.row.start(a)
a<-table.element(a,i, 1, TRUE)
a<-table.element(a,x[i])
a<-table.element(a,x[i]-mysum$resid[i])
a<-table.element(a,mysum$resid[i])
a<-table.row.end(a)
}
a<-table.end(a)
table.save(a,file='mytable4.tab')