Free Statistics

of Irreproducible Research!

Author's title

Author*Unverified author*
R Software Modulerwasp_multipleregression.wasp
Title produced by softwareMultiple Regression
Date of computationThu, 15 Nov 2007 05:12:26 -0700
Cite this page as followsStatistical Computations at FreeStatistics.org, Office for Research Development and Education, URL https://freestatistics.org/blog/index.php?v=date/2007/Nov/15/t1195128473moi3o2h9jjdcw06.htm/, Retrieved Sat, 04 May 2024 15:48:31 +0000
Statistical Computations at FreeStatistics.org, Office for Research Development and Education, URL https://freestatistics.org/blog/index.php?pk=5432, Retrieved Sat, 04 May 2024 15:48:31 +0000
QR Codes:

Original text written by user:
IsPrivate?No (this computation is public)
User-defined keywordsWorkshop 6, question 3, multiple lineair regression, pure
Estimated Impact303
Family? (F = Feedback message, R = changed R code, M = changed R Module, P = changed Parameters, D = changed Data)
-       [Multiple Regression] [Workshop 6, quest...] [2007-11-15 12:12:26] [181c187d2008ac66a37ecc12859b08c5] [Current]
-  M D    [Multiple Regression] [] [2010-11-21 14:12:17] [74be16979710d4c4e7c6647856088456]
Feedback Forum

Post a new message
Dataseries X:
108.4	106.7
117	100.6
103.8	101.2
100.8	93.1
110.6	84.2
104	85.8
112.6	91.8
107.3	92.4
98.9	80.3
109.8	79.7
104.9	62.5
102.2	57.1
123.9	100.8
124.9	100.7
112.7	86.2
121.9	83.2
100.6	71.7
104.3	77.5
120.4	89.8
107.5	80.3
102.9	78.7
125.6	93.8
107.5	57.6
108.8	60.6
128.4	91
121.1	85.3
119.5	77.4
128.7	77.3
108.7	68.3
105.5	69.9
119.8	81.7
111.3	75.1
110.6	69.9
120.1	84
97.5	54.3
107.7	60
127.3	89.9
117.2	77
119.8	85.3
116.2	77.6
111	69.2
112.4	75.5
130.6	85.7
109.1	72.2
118.8	79.9
123.9	85.3
101.6	52.2
112.8	61.2
128	82.4
129.6	85.4
125.8	78.2
119.5	70.2
115.7	70.2
113.6	69.3
129.7	77.5
112	66.1
116.8	69
126.3	75.3
112.9	58.2
115.9	59.7


Summary of compuational transaction
Raw Inputview raw input (R code)
Raw Outputview raw output of R engine
Computing time6 seconds
R Server'Herman Ole Andreas Wold' @ 193.190.124.10:1001

\begin{tabular}{lllllllll}
\hline
Summary of compuational transaction \tabularnewline
Raw Input & view raw input (R code)  \tabularnewline
Raw Output & view raw output of R engine  \tabularnewline
Computing time & 6 seconds \tabularnewline
R Server & 'Herman Ole Andreas Wold' @ 193.190.124.10:1001 \tabularnewline
\hline
\end{tabular}
%Source: https://freestatistics.org/blog/index.php?pk=5432&T=0

[TABLE]
[ROW][C]Summary of compuational transaction[/C][/ROW]
[ROW][C]Raw Input[/C][C]view raw input (R code) [/C][/ROW]
[ROW][C]Raw Output[/C][C]view raw output of R engine [/C][/ROW]
[ROW][C]Computing time[/C][C]6 seconds[/C][/ROW]
[ROW][C]R Server[/C][C]'Herman Ole Andreas Wold' @ 193.190.124.10:1001[/C][/ROW]
[/TABLE]
Source: https://freestatistics.org/blog/index.php?pk=5432&T=0

Globally Unique Identifier (entire table): ba.freestatistics.org/blog/index.php?pk=5432&T=0

As an alternative you can also use a QR Code:  

The GUIDs for individual cells are displayed in the table below:

Summary of compuational transaction
Raw Inputview raw input (R code)
Raw Outputview raw output of R engine
Computing time6 seconds
R Server'Herman Ole Andreas Wold' @ 193.190.124.10:1001


Multiple Linear Regression - Estimated Regression Equation
Y[t] = + 18.3994219532531 + 0.521216112951609X[t] + e[t]

\begin{tabular}{lllllllll}
\hline
Multiple Linear Regression - Estimated Regression Equation \tabularnewline
Y[t] =  +  18.3994219532531 +  0.521216112951609X[t]  + e[t] \tabularnewline
\hline
\end{tabular}
%Source: https://freestatistics.org/blog/index.php?pk=5432&T=1

[TABLE]
[ROW][C]Multiple Linear Regression - Estimated Regression Equation[/C][/ROW]
[ROW][C]Y[t] =  +  18.3994219532531 +  0.521216112951609X[t]  + e[t][/C][/ROW]
[/TABLE]
Source: https://freestatistics.org/blog/index.php?pk=5432&T=1

Globally Unique Identifier (entire table): ba.freestatistics.org/blog/index.php?pk=5432&T=1

As an alternative you can also use a QR Code:  

The GUIDs for individual cells are displayed in the table below:

Multiple Linear Regression - Estimated Regression Equation
Y[t] = + 18.3994219532531 + 0.521216112951609X[t] + e[t]


Multiple Linear Regression - Ordinary Least Squares
VariableParameterS.D.T-STATH0: parameter = 02-tail p-value1-tail p-value
(Intercept)18.399421953253119.9092920.92420.3592310.179615
X0.5212161129516090.1734413.00510.0039170.001958

\begin{tabular}{lllllllll}
\hline
Multiple Linear Regression - Ordinary Least Squares \tabularnewline
Variable & Parameter & S.D. & T-STATH0: parameter = 0 & 2-tail p-value & 1-tail p-value \tabularnewline
(Intercept) & 18.3994219532531 & 19.909292 & 0.9242 & 0.359231 & 0.179615 \tabularnewline
X & 0.521216112951609 & 0.173441 & 3.0051 & 0.003917 & 0.001958 \tabularnewline
\hline
\end{tabular}
%Source: https://freestatistics.org/blog/index.php?pk=5432&T=2

[TABLE]
[ROW][C]Multiple Linear Regression - Ordinary Least Squares[/C][/ROW]
[ROW][C]Variable[/C][C]Parameter[/C][C]S.D.[/C][C]T-STATH0: parameter = 0[/C][C]2-tail p-value[/C][C]1-tail p-value[/C][/ROW]
[ROW][C](Intercept)[/C][C]18.3994219532531[/C][C]19.909292[/C][C]0.9242[/C][C]0.359231[/C][C]0.179615[/C][/ROW]
[ROW][C]X[/C][C]0.521216112951609[/C][C]0.173441[/C][C]3.0051[/C][C]0.003917[/C][C]0.001958[/C][/ROW]
[/TABLE]
Source: https://freestatistics.org/blog/index.php?pk=5432&T=2

Globally Unique Identifier (entire table): ba.freestatistics.org/blog/index.php?pk=5432&T=2

As an alternative you can also use a QR Code:  

The GUIDs for individual cells are displayed in the table below:

Multiple Linear Regression - Ordinary Least Squares
VariableParameterS.D.T-STATH0: parameter = 02-tail p-value1-tail p-value
(Intercept)18.399421953253119.9092920.92420.3592310.179615
X0.5212161129516090.1734413.00510.0039170.001958


Multiple Linear Regression - Regression Statistics
Multiple R0.36705234008517
R-squared0.134727420361999
Adjusted R-squared0.11980892760962
F-TEST (value)9.03090027915266
F-TEST (DF numerator)1
F-TEST (DF denominator)58
p-value0.00391666502419119
Multiple Linear Regression - Residual Statistics
Residual Standard Deviation11.9449615201539
Sum Squared Residuals8275.56213164159

\begin{tabular}{lllllllll}
\hline
Multiple Linear Regression - Regression Statistics \tabularnewline
Multiple R & 0.36705234008517 \tabularnewline
R-squared & 0.134727420361999 \tabularnewline
Adjusted R-squared & 0.11980892760962 \tabularnewline
F-TEST (value) & 9.03090027915266 \tabularnewline
F-TEST (DF numerator) & 1 \tabularnewline
F-TEST (DF denominator) & 58 \tabularnewline
p-value & 0.00391666502419119 \tabularnewline
Multiple Linear Regression - Residual Statistics \tabularnewline
Residual Standard Deviation & 11.9449615201539 \tabularnewline
Sum Squared Residuals & 8275.56213164159 \tabularnewline
\hline
\end{tabular}
%Source: https://freestatistics.org/blog/index.php?pk=5432&T=3

[TABLE]
[ROW][C]Multiple Linear Regression - Regression Statistics[/C][/ROW]
[ROW][C]Multiple R[/C][C]0.36705234008517[/C][/ROW]
[ROW][C]R-squared[/C][C]0.134727420361999[/C][/ROW]
[ROW][C]Adjusted R-squared[/C][C]0.11980892760962[/C][/ROW]
[ROW][C]F-TEST (value)[/C][C]9.03090027915266[/C][/ROW]
[ROW][C]F-TEST (DF numerator)[/C][C]1[/C][/ROW]
[ROW][C]F-TEST (DF denominator)[/C][C]58[/C][/ROW]
[ROW][C]p-value[/C][C]0.00391666502419119[/C][/ROW]
[ROW][C]Multiple Linear Regression - Residual Statistics[/C][/ROW]
[ROW][C]Residual Standard Deviation[/C][C]11.9449615201539[/C][/ROW]
[ROW][C]Sum Squared Residuals[/C][C]8275.56213164159[/C][/ROW]
[/TABLE]
Source: https://freestatistics.org/blog/index.php?pk=5432&T=3

Globally Unique Identifier (entire table): ba.freestatistics.org/blog/index.php?pk=5432&T=3

As an alternative you can also use a QR Code:  

The GUIDs for individual cells are displayed in the table below:

Multiple Linear Regression - Regression Statistics
Multiple R0.36705234008517
R-squared0.134727420361999
Adjusted R-squared0.11980892760962
F-TEST (value)9.03090027915266
F-TEST (DF numerator)1
F-TEST (DF denominator)58
p-value0.00391666502419119
Multiple Linear Regression - Residual Statistics
Residual Standard Deviation11.9449615201539
Sum Squared Residuals8275.56213164159


Multiple Linear Regression - Actuals, Interpolation, and Residuals
Time or IndexActualsInterpolationForecastResidualsPrediction Error
1106.774.899248597207631.8007514027924
2100.679.381707168591421.2182928314086
3101.272.501654477630128.6983455223699
493.170.938006138775322.1619938612247
584.276.0459240457018.15407595429894
685.872.605897700220513.1941022997796
791.877.088356271604314.7116437283957
892.474.325910872960718.0740891270393
980.369.947695524167210.3523044758328
1079.775.62895115533984.07104884466023
1162.573.0749922018769-10.5749922018769
1257.171.6677086969076-14.5677086969075
13100.882.978098347957517.8219016520425
14100.783.49931446090917.2006855390909
1586.277.14047788289949.05952211710056
1683.281.93566612205421.26433387794575
1771.770.8337629161850.866237083815031
1877.572.7622625341064.73773746589407
1989.881.15384195262688.64615804737316
2080.374.43015409555115.86984590444892
2178.772.03255997597376.66744002402632
2293.883.86416573997529.9358342600248
2357.674.4301540955511-16.8301540955511
2460.675.1077350423882-14.5077350423882
259185.32357085623975.67642914376029
2685.381.5186932316933.78130676830704
2777.480.6847474509704-3.28474745097038
2877.385.4799356901252-8.17993569012518
2968.375.055613431093-6.75561343109301
3069.973.3877218696479-3.48772186964785
3181.780.84111228485590.858887715144137
3275.176.4107753247672-1.31077532476719
3369.976.045924045701-6.14592404570106
348480.99747711874133.00252288125865
3554.369.217992966035-14.917992966035
366074.5343973181414-14.5343973181414
3789.984.7502331319935.14976686800707
387779.4859503911817-2.48595039118168
3985.380.84111228485594.45888771514413
4077.678.9647342782301-1.36473427823008
4169.276.2544104908817-7.0544104908817
4275.576.984113049014-1.48411304901396
4385.786.4702463047332-0.770246304733238
4472.275.2640998762736-3.06409987627365
4579.980.3198961719043-0.41989617190425
4685.382.97809834795752.32190165204253
4752.271.3549790291366-19.1549790291366
4861.277.1925994941946-15.9925994941946
4982.485.115084411059-2.71508441105905
5085.485.9490301917816-0.549030191781625
5178.283.9684089625655-5.76840896256552
5270.280.6847474509704-10.4847474509704
5370.278.7041262217543-8.50412622175427
5469.377.6095723845559-8.3095723845559
5577.586.0011518030768-8.50115180307679
5666.176.7756266038333-10.6756266038333
576979.277463946001-10.2774639460010
5875.384.2290170190413-8.92901701904132
5958.277.2447211054898-19.0447211054898
6059.778.8083694443446-19.1083694443446

\begin{tabular}{lllllllll}
\hline
Multiple Linear Regression - Actuals, Interpolation, and Residuals \tabularnewline
Time or Index & Actuals & InterpolationForecast & ResidualsPrediction Error \tabularnewline
1 & 106.7 & 74.8992485972076 & 31.8007514027924 \tabularnewline
2 & 100.6 & 79.3817071685914 & 21.2182928314086 \tabularnewline
3 & 101.2 & 72.5016544776301 & 28.6983455223699 \tabularnewline
4 & 93.1 & 70.9380061387753 & 22.1619938612247 \tabularnewline
5 & 84.2 & 76.045924045701 & 8.15407595429894 \tabularnewline
6 & 85.8 & 72.6058977002205 & 13.1941022997796 \tabularnewline
7 & 91.8 & 77.0883562716043 & 14.7116437283957 \tabularnewline
8 & 92.4 & 74.3259108729607 & 18.0740891270393 \tabularnewline
9 & 80.3 & 69.9476955241672 & 10.3523044758328 \tabularnewline
10 & 79.7 & 75.6289511553398 & 4.07104884466023 \tabularnewline
11 & 62.5 & 73.0749922018769 & -10.5749922018769 \tabularnewline
12 & 57.1 & 71.6677086969076 & -14.5677086969075 \tabularnewline
13 & 100.8 & 82.9780983479575 & 17.8219016520425 \tabularnewline
14 & 100.7 & 83.499314460909 & 17.2006855390909 \tabularnewline
15 & 86.2 & 77.1404778828994 & 9.05952211710056 \tabularnewline
16 & 83.2 & 81.9356661220542 & 1.26433387794575 \tabularnewline
17 & 71.7 & 70.833762916185 & 0.866237083815031 \tabularnewline
18 & 77.5 & 72.762262534106 & 4.73773746589407 \tabularnewline
19 & 89.8 & 81.1538419526268 & 8.64615804737316 \tabularnewline
20 & 80.3 & 74.4301540955511 & 5.86984590444892 \tabularnewline
21 & 78.7 & 72.0325599759737 & 6.66744002402632 \tabularnewline
22 & 93.8 & 83.8641657399752 & 9.9358342600248 \tabularnewline
23 & 57.6 & 74.4301540955511 & -16.8301540955511 \tabularnewline
24 & 60.6 & 75.1077350423882 & -14.5077350423882 \tabularnewline
25 & 91 & 85.3235708562397 & 5.67642914376029 \tabularnewline
26 & 85.3 & 81.518693231693 & 3.78130676830704 \tabularnewline
27 & 77.4 & 80.6847474509704 & -3.28474745097038 \tabularnewline
28 & 77.3 & 85.4799356901252 & -8.17993569012518 \tabularnewline
29 & 68.3 & 75.055613431093 & -6.75561343109301 \tabularnewline
30 & 69.9 & 73.3877218696479 & -3.48772186964785 \tabularnewline
31 & 81.7 & 80.8411122848559 & 0.858887715144137 \tabularnewline
32 & 75.1 & 76.4107753247672 & -1.31077532476719 \tabularnewline
33 & 69.9 & 76.045924045701 & -6.14592404570106 \tabularnewline
34 & 84 & 80.9974771187413 & 3.00252288125865 \tabularnewline
35 & 54.3 & 69.217992966035 & -14.917992966035 \tabularnewline
36 & 60 & 74.5343973181414 & -14.5343973181414 \tabularnewline
37 & 89.9 & 84.750233131993 & 5.14976686800707 \tabularnewline
38 & 77 & 79.4859503911817 & -2.48595039118168 \tabularnewline
39 & 85.3 & 80.8411122848559 & 4.45888771514413 \tabularnewline
40 & 77.6 & 78.9647342782301 & -1.36473427823008 \tabularnewline
41 & 69.2 & 76.2544104908817 & -7.0544104908817 \tabularnewline
42 & 75.5 & 76.984113049014 & -1.48411304901396 \tabularnewline
43 & 85.7 & 86.4702463047332 & -0.770246304733238 \tabularnewline
44 & 72.2 & 75.2640998762736 & -3.06409987627365 \tabularnewline
45 & 79.9 & 80.3198961719043 & -0.41989617190425 \tabularnewline
46 & 85.3 & 82.9780983479575 & 2.32190165204253 \tabularnewline
47 & 52.2 & 71.3549790291366 & -19.1549790291366 \tabularnewline
48 & 61.2 & 77.1925994941946 & -15.9925994941946 \tabularnewline
49 & 82.4 & 85.115084411059 & -2.71508441105905 \tabularnewline
50 & 85.4 & 85.9490301917816 & -0.549030191781625 \tabularnewline
51 & 78.2 & 83.9684089625655 & -5.76840896256552 \tabularnewline
52 & 70.2 & 80.6847474509704 & -10.4847474509704 \tabularnewline
53 & 70.2 & 78.7041262217543 & -8.50412622175427 \tabularnewline
54 & 69.3 & 77.6095723845559 & -8.3095723845559 \tabularnewline
55 & 77.5 & 86.0011518030768 & -8.50115180307679 \tabularnewline
56 & 66.1 & 76.7756266038333 & -10.6756266038333 \tabularnewline
57 & 69 & 79.277463946001 & -10.2774639460010 \tabularnewline
58 & 75.3 & 84.2290170190413 & -8.92901701904132 \tabularnewline
59 & 58.2 & 77.2447211054898 & -19.0447211054898 \tabularnewline
60 & 59.7 & 78.8083694443446 & -19.1083694443446 \tabularnewline
\hline
\end{tabular}
%Source: https://freestatistics.org/blog/index.php?pk=5432&T=4

[TABLE]
[ROW][C]Multiple Linear Regression - Actuals, Interpolation, and Residuals[/C][/ROW]
[ROW][C]Time or Index[/C][C]Actuals[/C][C]InterpolationForecast[/C][C]ResidualsPrediction Error[/C][/ROW]
[ROW][C]1[/C][C]106.7[/C][C]74.8992485972076[/C][C]31.8007514027924[/C][/ROW]
[ROW][C]2[/C][C]100.6[/C][C]79.3817071685914[/C][C]21.2182928314086[/C][/ROW]
[ROW][C]3[/C][C]101.2[/C][C]72.5016544776301[/C][C]28.6983455223699[/C][/ROW]
[ROW][C]4[/C][C]93.1[/C][C]70.9380061387753[/C][C]22.1619938612247[/C][/ROW]
[ROW][C]5[/C][C]84.2[/C][C]76.045924045701[/C][C]8.15407595429894[/C][/ROW]
[ROW][C]6[/C][C]85.8[/C][C]72.6058977002205[/C][C]13.1941022997796[/C][/ROW]
[ROW][C]7[/C][C]91.8[/C][C]77.0883562716043[/C][C]14.7116437283957[/C][/ROW]
[ROW][C]8[/C][C]92.4[/C][C]74.3259108729607[/C][C]18.0740891270393[/C][/ROW]
[ROW][C]9[/C][C]80.3[/C][C]69.9476955241672[/C][C]10.3523044758328[/C][/ROW]
[ROW][C]10[/C][C]79.7[/C][C]75.6289511553398[/C][C]4.07104884466023[/C][/ROW]
[ROW][C]11[/C][C]62.5[/C][C]73.0749922018769[/C][C]-10.5749922018769[/C][/ROW]
[ROW][C]12[/C][C]57.1[/C][C]71.6677086969076[/C][C]-14.5677086969075[/C][/ROW]
[ROW][C]13[/C][C]100.8[/C][C]82.9780983479575[/C][C]17.8219016520425[/C][/ROW]
[ROW][C]14[/C][C]100.7[/C][C]83.499314460909[/C][C]17.2006855390909[/C][/ROW]
[ROW][C]15[/C][C]86.2[/C][C]77.1404778828994[/C][C]9.05952211710056[/C][/ROW]
[ROW][C]16[/C][C]83.2[/C][C]81.9356661220542[/C][C]1.26433387794575[/C][/ROW]
[ROW][C]17[/C][C]71.7[/C][C]70.833762916185[/C][C]0.866237083815031[/C][/ROW]
[ROW][C]18[/C][C]77.5[/C][C]72.762262534106[/C][C]4.73773746589407[/C][/ROW]
[ROW][C]19[/C][C]89.8[/C][C]81.1538419526268[/C][C]8.64615804737316[/C][/ROW]
[ROW][C]20[/C][C]80.3[/C][C]74.4301540955511[/C][C]5.86984590444892[/C][/ROW]
[ROW][C]21[/C][C]78.7[/C][C]72.0325599759737[/C][C]6.66744002402632[/C][/ROW]
[ROW][C]22[/C][C]93.8[/C][C]83.8641657399752[/C][C]9.9358342600248[/C][/ROW]
[ROW][C]23[/C][C]57.6[/C][C]74.4301540955511[/C][C]-16.8301540955511[/C][/ROW]
[ROW][C]24[/C][C]60.6[/C][C]75.1077350423882[/C][C]-14.5077350423882[/C][/ROW]
[ROW][C]25[/C][C]91[/C][C]85.3235708562397[/C][C]5.67642914376029[/C][/ROW]
[ROW][C]26[/C][C]85.3[/C][C]81.518693231693[/C][C]3.78130676830704[/C][/ROW]
[ROW][C]27[/C][C]77.4[/C][C]80.6847474509704[/C][C]-3.28474745097038[/C][/ROW]
[ROW][C]28[/C][C]77.3[/C][C]85.4799356901252[/C][C]-8.17993569012518[/C][/ROW]
[ROW][C]29[/C][C]68.3[/C][C]75.055613431093[/C][C]-6.75561343109301[/C][/ROW]
[ROW][C]30[/C][C]69.9[/C][C]73.3877218696479[/C][C]-3.48772186964785[/C][/ROW]
[ROW][C]31[/C][C]81.7[/C][C]80.8411122848559[/C][C]0.858887715144137[/C][/ROW]
[ROW][C]32[/C][C]75.1[/C][C]76.4107753247672[/C][C]-1.31077532476719[/C][/ROW]
[ROW][C]33[/C][C]69.9[/C][C]76.045924045701[/C][C]-6.14592404570106[/C][/ROW]
[ROW][C]34[/C][C]84[/C][C]80.9974771187413[/C][C]3.00252288125865[/C][/ROW]
[ROW][C]35[/C][C]54.3[/C][C]69.217992966035[/C][C]-14.917992966035[/C][/ROW]
[ROW][C]36[/C][C]60[/C][C]74.5343973181414[/C][C]-14.5343973181414[/C][/ROW]
[ROW][C]37[/C][C]89.9[/C][C]84.750233131993[/C][C]5.14976686800707[/C][/ROW]
[ROW][C]38[/C][C]77[/C][C]79.4859503911817[/C][C]-2.48595039118168[/C][/ROW]
[ROW][C]39[/C][C]85.3[/C][C]80.8411122848559[/C][C]4.45888771514413[/C][/ROW]
[ROW][C]40[/C][C]77.6[/C][C]78.9647342782301[/C][C]-1.36473427823008[/C][/ROW]
[ROW][C]41[/C][C]69.2[/C][C]76.2544104908817[/C][C]-7.0544104908817[/C][/ROW]
[ROW][C]42[/C][C]75.5[/C][C]76.984113049014[/C][C]-1.48411304901396[/C][/ROW]
[ROW][C]43[/C][C]85.7[/C][C]86.4702463047332[/C][C]-0.770246304733238[/C][/ROW]
[ROW][C]44[/C][C]72.2[/C][C]75.2640998762736[/C][C]-3.06409987627365[/C][/ROW]
[ROW][C]45[/C][C]79.9[/C][C]80.3198961719043[/C][C]-0.41989617190425[/C][/ROW]
[ROW][C]46[/C][C]85.3[/C][C]82.9780983479575[/C][C]2.32190165204253[/C][/ROW]
[ROW][C]47[/C][C]52.2[/C][C]71.3549790291366[/C][C]-19.1549790291366[/C][/ROW]
[ROW][C]48[/C][C]61.2[/C][C]77.1925994941946[/C][C]-15.9925994941946[/C][/ROW]
[ROW][C]49[/C][C]82.4[/C][C]85.115084411059[/C][C]-2.71508441105905[/C][/ROW]
[ROW][C]50[/C][C]85.4[/C][C]85.9490301917816[/C][C]-0.549030191781625[/C][/ROW]
[ROW][C]51[/C][C]78.2[/C][C]83.9684089625655[/C][C]-5.76840896256552[/C][/ROW]
[ROW][C]52[/C][C]70.2[/C][C]80.6847474509704[/C][C]-10.4847474509704[/C][/ROW]
[ROW][C]53[/C][C]70.2[/C][C]78.7041262217543[/C][C]-8.50412622175427[/C][/ROW]
[ROW][C]54[/C][C]69.3[/C][C]77.6095723845559[/C][C]-8.3095723845559[/C][/ROW]
[ROW][C]55[/C][C]77.5[/C][C]86.0011518030768[/C][C]-8.50115180307679[/C][/ROW]
[ROW][C]56[/C][C]66.1[/C][C]76.7756266038333[/C][C]-10.6756266038333[/C][/ROW]
[ROW][C]57[/C][C]69[/C][C]79.277463946001[/C][C]-10.2774639460010[/C][/ROW]
[ROW][C]58[/C][C]75.3[/C][C]84.2290170190413[/C][C]-8.92901701904132[/C][/ROW]
[ROW][C]59[/C][C]58.2[/C][C]77.2447211054898[/C][C]-19.0447211054898[/C][/ROW]
[ROW][C]60[/C][C]59.7[/C][C]78.8083694443446[/C][C]-19.1083694443446[/C][/ROW]
[/TABLE]
Source: https://freestatistics.org/blog/index.php?pk=5432&T=4

Globally Unique Identifier (entire table): ba.freestatistics.org/blog/index.php?pk=5432&T=4

As an alternative you can also use a QR Code:  

The GUIDs for individual cells are displayed in the table below:

Multiple Linear Regression - Actuals, Interpolation, and Residuals
Time or IndexActualsInterpolationForecastResidualsPrediction Error
1106.774.899248597207631.8007514027924
2100.679.381707168591421.2182928314086
3101.272.501654477630128.6983455223699
493.170.938006138775322.1619938612247
584.276.0459240457018.15407595429894
685.872.605897700220513.1941022997796
791.877.088356271604314.7116437283957
892.474.325910872960718.0740891270393
980.369.947695524167210.3523044758328
1079.775.62895115533984.07104884466023
1162.573.0749922018769-10.5749922018769
1257.171.6677086969076-14.5677086969075
13100.882.978098347957517.8219016520425
14100.783.49931446090917.2006855390909
1586.277.14047788289949.05952211710056
1683.281.93566612205421.26433387794575
1771.770.8337629161850.866237083815031
1877.572.7622625341064.73773746589407
1989.881.15384195262688.64615804737316
2080.374.43015409555115.86984590444892
2178.772.03255997597376.66744002402632
2293.883.86416573997529.9358342600248
2357.674.4301540955511-16.8301540955511
2460.675.1077350423882-14.5077350423882
259185.32357085623975.67642914376029
2685.381.5186932316933.78130676830704
2777.480.6847474509704-3.28474745097038
2877.385.4799356901252-8.17993569012518
2968.375.055613431093-6.75561343109301
3069.973.3877218696479-3.48772186964785
3181.780.84111228485590.858887715144137
3275.176.4107753247672-1.31077532476719
3369.976.045924045701-6.14592404570106
348480.99747711874133.00252288125865
3554.369.217992966035-14.917992966035
366074.5343973181414-14.5343973181414
3789.984.7502331319935.14976686800707
387779.4859503911817-2.48595039118168
3985.380.84111228485594.45888771514413
4077.678.9647342782301-1.36473427823008
4169.276.2544104908817-7.0544104908817
4275.576.984113049014-1.48411304901396
4385.786.4702463047332-0.770246304733238
4472.275.2640998762736-3.06409987627365
4579.980.3198961719043-0.41989617190425
4685.382.97809834795752.32190165204253
4752.271.3549790291366-19.1549790291366
4861.277.1925994941946-15.9925994941946
4982.485.115084411059-2.71508441105905
5085.485.9490301917816-0.549030191781625
5178.283.9684089625655-5.76840896256552
5270.280.6847474509704-10.4847474509704
5370.278.7041262217543-8.50412622175427
5469.377.6095723845559-8.3095723845559
5577.586.0011518030768-8.50115180307679
5666.176.7756266038333-10.6756266038333
576979.277463946001-10.2774639460010
5875.384.2290170190413-8.92901701904132
5958.277.2447211054898-19.0447211054898
6059.778.8083694443446-19.1083694443446


Parameters (Session):
par1 = 2 ; par2 = Do not include Seasonal Dummies ; par3 = No Linear Trend ;
Parameters (R input):
par1 = 2 ; par2 = Do not include Seasonal Dummies ; par3 = No Linear Trend ;
R code (references can be found in the software module):
library(lattice)
par1 <- as.numeric(par1)
x <- t(y)
k <- length(x[1,])
n <- length(x[,1])
x1 <- cbind(x[,par1], x[,1:k!=par1])
mycolnames <- c(colnames(x)[par1], colnames(x)[1:k!=par1])
colnames(x1) <- mycolnames #colnames(x)[par1]
x <- x1
if (par3 == 'First Differences'){
x2 <- array(0, dim=c(n-1,k), dimnames=list(1:(n-1), paste('(1-B)',colnames(x),sep='')))
for (i in 1:n-1) {
for (j in 1:k) {
x2[i,j] <- x[i+1,j] - x[i,j]
}
}
x <- x2
}
if (par2 == 'Include Monthly Dummies'){
x2 <- array(0, dim=c(n,11), dimnames=list(1:n, paste('M', seq(1:11), sep ='')))
for (i in 1:11){
x2[seq(i,n,12),i] <- 1
}
x <- cbind(x, x2)
}
if (par2 == 'Include Quarterly Dummies'){
x2 <- array(0, dim=c(n,3), dimnames=list(1:n, paste('Q', seq(1:3), sep ='')))
for (i in 1:3){
x2[seq(i,n,4),i] <- 1
}
x <- cbind(x, x2)
}
k <- length(x[1,])
if (par3 == 'Linear Trend'){
x <- cbind(x, c(1:n))
colnames(x)[k+1] <- 't'
}
x
k <- length(x[1,])
df <- as.data.frame(x)
(mylm <- lm(df))
(mysum <- summary(mylm))
bitmap(file='test0.png')
plot(x[,1], type='l', main='Actuals and Interpolation', ylab='value of Actuals and Interpolation (dots)', xlab='time or index')
points(x[,1]-mysum$resid)
grid()
dev.off()
bitmap(file='test1.png')
plot(mysum$resid, type='b', pch=19, main='Residuals', ylab='value of Residuals', xlab='time or index')
grid()
dev.off()
bitmap(file='test2.png')
hist(mysum$resid, main='Residual Histogram', xlab='values of Residuals')
grid()
dev.off()
bitmap(file='test3.png')
densityplot(~mysum$resid,col='black',main='Residual Density Plot', xlab='values of Residuals')
dev.off()
bitmap(file='test4.png')
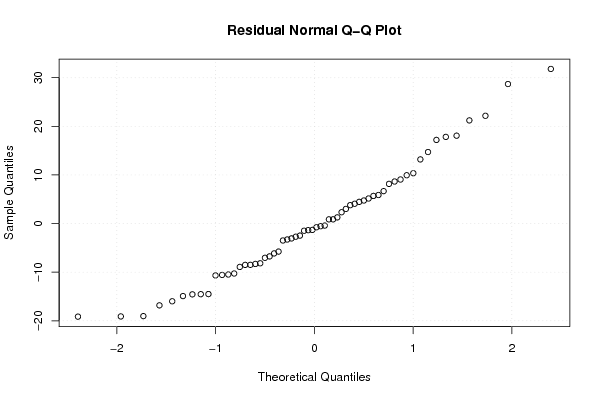
qqnorm(mysum$resid, main='Residual Normal Q-Q Plot')
grid()
dev.off()
(myerror <- as.ts(mysum$resid))
bitmap(file='test5.png')
dum <- cbind(lag(myerror,k=1),myerror)
dum
dum1 <- dum[2:length(myerror),]
dum1
z <- as.data.frame(dum1)
z
plot(z,main=paste('Residual Lag plot, lowess, and regression line'), ylab='values of Residuals', xlab='lagged values of Residuals')
lines(lowess(z))
abline(lm(z))
grid()
dev.off()
bitmap(file='test6.png')
acf(mysum$resid, lag.max=length(mysum$resid)/2, main='Residual Autocorrelation Function')
grid()
dev.off()
bitmap(file='test7.png')
pacf(mysum$resid, lag.max=length(mysum$resid)/2, main='Residual Partial Autocorrelation Function')
grid()
dev.off()
bitmap(file='test8.png')
opar <- par(mfrow = c(2,2), oma = c(0, 0, 1.1, 0))
plot(mylm, las = 1, sub='Residual Diagnostics')
par(opar)
dev.off()
load(file='createtable')
a<-table.start()
a<-table.row.start(a)
a<-table.element(a, 'Multiple Linear Regression - Estimated Regression Equation', 1, TRUE)
a<-table.row.end(a)
myeq <- colnames(x)[1]
myeq <- paste(myeq, '[t] = ', sep='')
for (i in 1:k){
if (mysum$coefficients[i,1] > 0) myeq <- paste(myeq, '+', '')
myeq <- paste(myeq, mysum$coefficients[i,1], sep=' ')
if (rownames(mysum$coefficients)[i] != '(Intercept)') {
myeq <- paste(myeq, rownames(mysum$coefficients)[i], sep='')
if (rownames(mysum$coefficients)[i] != 't') myeq <- paste(myeq, '[t]', sep='')
}
}
myeq <- paste(myeq, ' + e[t]')
a<-table.row.start(a)
a<-table.element(a, myeq)
a<-table.row.end(a)
a<-table.end(a)
table.save(a,file='mytable1.tab')
a<-table.start()
a<-table.row.start(a)
a<-table.element(a,hyperlink('ols1.htm','Multiple Linear Regression - Ordinary Least Squares',''), 6, TRUE)
a<-table.row.end(a)
a<-table.row.start(a)
a<-table.element(a,'Variable',header=TRUE)
a<-table.element(a,'Parameter',header=TRUE)
a<-table.element(a,'S.D.',header=TRUE)
a<-table.element(a,'T-STAT
H0: parameter = 0',header=TRUE)
a<-table.element(a,'2-tail p-value',header=TRUE)
a<-table.element(a,'1-tail p-value',header=TRUE)
a<-table.row.end(a)
for (i in 1:k){
a<-table.row.start(a)
a<-table.element(a,rownames(mysum$coefficients)[i],header=TRUE)
a<-table.element(a,mysum$coefficients[i,1])
a<-table.element(a, round(mysum$coefficients[i,2],6))
a<-table.element(a, round(mysum$coefficients[i,3],4))
a<-table.element(a, round(mysum$coefficients[i,4],6))
a<-table.element(a, round(mysum$coefficients[i,4]/2,6))
a<-table.row.end(a)
}
a<-table.end(a)
table.save(a,file='mytable2.tab')
a<-table.start()
a<-table.row.start(a)
a<-table.element(a, 'Multiple Linear Regression - Regression Statistics', 2, TRUE)
a<-table.row.end(a)
a<-table.row.start(a)
a<-table.element(a, 'Multiple R',1,TRUE)
a<-table.element(a, sqrt(mysum$r.squared))
a<-table.row.end(a)
a<-table.row.start(a)
a<-table.element(a, 'R-squared',1,TRUE)
a<-table.element(a, mysum$r.squared)
a<-table.row.end(a)
a<-table.row.start(a)
a<-table.element(a, 'Adjusted R-squared',1,TRUE)
a<-table.element(a, mysum$adj.r.squared)
a<-table.row.end(a)
a<-table.row.start(a)
a<-table.element(a, 'F-TEST (value)',1,TRUE)
a<-table.element(a, mysum$fstatistic[1])
a<-table.row.end(a)
a<-table.row.start(a)
a<-table.element(a, 'F-TEST (DF numerator)',1,TRUE)
a<-table.element(a, mysum$fstatistic[2])
a<-table.row.end(a)
a<-table.row.start(a)
a<-table.element(a, 'F-TEST (DF denominator)',1,TRUE)
a<-table.element(a, mysum$fstatistic[3])
a<-table.row.end(a)
a<-table.row.start(a)
a<-table.element(a, 'p-value',1,TRUE)
a<-table.element(a, 1-pf(mysum$fstatistic[1],mysum$fstatistic[2],mysum$fstatistic[3]))
a<-table.row.end(a)
a<-table.row.start(a)
a<-table.element(a, 'Multiple Linear Regression - Residual Statistics', 2, TRUE)
a<-table.row.end(a)
a<-table.row.start(a)
a<-table.element(a, 'Residual Standard Deviation',1,TRUE)
a<-table.element(a, mysum$sigma)
a<-table.row.end(a)
a<-table.row.start(a)
a<-table.element(a, 'Sum Squared Residuals',1,TRUE)
a<-table.element(a, sum(myerror*myerror))
a<-table.row.end(a)
a<-table.end(a)
table.save(a,file='mytable3.tab')
a<-table.start()
a<-table.row.start(a)
a<-table.element(a, 'Multiple Linear Regression - Actuals, Interpolation, and Residuals', 4, TRUE)
a<-table.row.end(a)
a<-table.row.start(a)
a<-table.element(a, 'Time or Index', 1, TRUE)
a<-table.element(a, 'Actuals', 1, TRUE)
a<-table.element(a, 'Interpolation
Forecast', 1, TRUE)
a<-table.element(a, 'Residuals
Prediction Error', 1, TRUE)
a<-table.row.end(a)
for (i in 1:n) {
a<-table.row.start(a)
a<-table.element(a,i, 1, TRUE)
a<-table.element(a,x[i])
a<-table.element(a,x[i]-mysum$resid[i])
a<-table.element(a,mysum$resid[i])
a<-table.row.end(a)
}
a<-table.end(a)
table.save(a,file='mytable4.tab')