Free Statistics

of Irreproducible Research!

Author's title

Author*Unverified author*
R Software Modulerwasp_multipleregression.wasp
Title produced by softwareMultiple Regression
Date of computationThu, 15 Nov 2007 04:15:52 -0700
Cite this page as followsStatistical Computations at FreeStatistics.org, Office for Research Development and Education, URL https://freestatistics.org/blog/index.php?v=date/2007/Nov/15/t1195125097wxv5tq3eiddn2t1.htm/, Retrieved Sat, 04 May 2024 18:35:42 +0000
Statistical Computations at FreeStatistics.org, Office for Research Development and Education, URL https://freestatistics.org/blog/index.php?pk=5425, Retrieved Sat, 04 May 2024 18:35:42 +0000
QR Codes:

Original text written by user:
IsPrivate?No (this computation is public)
User-defined keywords
Estimated Impact285
Family? (F = Feedback message, R = changed R code, M = changed R Module, P = changed Parameters, D = changed Data)
-       [Multiple Regression] [] [2007-11-15 11:15:52] [94abaf6e1c7b1fd4f9d5e2c2d987f350] [Current]
Feedback Forum

Post a new message
Dataseries X:
128	0
123	0
118	0
112	0
105	0
102	0
131	0
149	0
145	0
132	0
122	0
119	0
116	0
111	0
104	0
100	0
93	0
91	0
119	0
139	0
134	0
124	0
113	0
109	0
109	0
106	0
101	0
98	0
93	0
91	0
122	0
139	0
140	1
132	1
117	1
114	1
113	1
110	1
107	1
103	1
98	1
98	1
137	1
148	1
147	1
139	1
130	1
128	1
127	1
123	1
118	1
114	1
108	1
111	1
151	1
159	1
158	1
148	1
138	1
137	1
136	1
133	1
126	1
120	1
114	1
116	1
153	1
162	1
161	1
149	0
139	0
135	0
130	0
127	0
122	0
117	0
112	0
113	0
149	0
157	0
157	0
147	0
137	0
132	0
125	0
123	0
117	0
114	0
111	0
112	0
144	0
150	0
149	0
134	0
123	0
116	0
117	0
111	0
105	0
102	0
95	0
93	0
124	0
130	0
124	0
115	0


Summary of compuational transaction
Raw Inputview raw input (R code)
Raw Outputview raw output of R engine
Computing time3 seconds
R Server'Gwilym Jenkins' @ 72.249.127.135

\begin{tabular}{lllllllll}
\hline
Summary of compuational transaction \tabularnewline
Raw Input & view raw input (R code)  \tabularnewline
Raw Output & view raw output of R engine  \tabularnewline
Computing time & 3 seconds \tabularnewline
R Server & 'Gwilym Jenkins' @ 72.249.127.135 \tabularnewline
\hline
\end{tabular}
%Source: https://freestatistics.org/blog/index.php?pk=5425&T=0

[TABLE]
[ROW][C]Summary of compuational transaction[/C][/ROW]
[ROW][C]Raw Input[/C][C]view raw input (R code) [/C][/ROW]
[ROW][C]Raw Output[/C][C]view raw output of R engine [/C][/ROW]
[ROW][C]Computing time[/C][C]3 seconds[/C][/ROW]
[ROW][C]R Server[/C][C]'Gwilym Jenkins' @ 72.249.127.135[/C][/ROW]
[/TABLE]
Source: https://freestatistics.org/blog/index.php?pk=5425&T=0

Globally Unique Identifier (entire table): ba.freestatistics.org/blog/index.php?pk=5425&T=0

As an alternative you can also use a QR Code:  

The GUIDs for individual cells are displayed in the table below:

Summary of compuational transaction
Raw Inputview raw input (R code)
Raw Outputview raw output of R engine
Computing time3 seconds
R Server'Gwilym Jenkins' @ 72.249.127.135


Multiple Linear Regression - Estimated Regression Equation
y[t] = + 116.117805975632 + 7.3629767954448x[t] -0.658850251479013M1[t] -4.52683317233233M2[t] -10.0614827598522M3[t] -14.3739101251499M4[t] -20.1307819348921M5[t] -20.4432093001898M6[t] + 13.1332522234014M7[t] + 24.4874915247703M8[t] + 21.5791778488676M9[t] + 11.7515256830638M10[t] + 3.71520514307549M11[t] + 0.0902051430754819t + e[t]

\begin{tabular}{lllllllll}
\hline
Multiple Linear Regression - Estimated Regression Equation \tabularnewline
y[t] =  +  116.117805975632 +  7.3629767954448x[t] -0.658850251479013M1[t] -4.52683317233233M2[t] -10.0614827598522M3[t] -14.3739101251499M4[t] -20.1307819348921M5[t] -20.4432093001898M6[t] +  13.1332522234014M7[t] +  24.4874915247703M8[t] +  21.5791778488676M9[t] +  11.7515256830638M10[t] +  3.71520514307549M11[t] +  0.0902051430754819t  + e[t] \tabularnewline
\hline
\end{tabular}
%Source: https://freestatistics.org/blog/index.php?pk=5425&T=1

[TABLE]
[ROW][C]Multiple Linear Regression - Estimated Regression Equation[/C][/ROW]
[ROW][C]y[t] =  +  116.117805975632 +  7.3629767954448x[t] -0.658850251479013M1[t] -4.52683317233233M2[t] -10.0614827598522M3[t] -14.3739101251499M4[t] -20.1307819348921M5[t] -20.4432093001898M6[t] +  13.1332522234014M7[t] +  24.4874915247703M8[t] +  21.5791778488676M9[t] +  11.7515256830638M10[t] +  3.71520514307549M11[t] +  0.0902051430754819t  + e[t][/C][/ROW]
[/TABLE]
Source: https://freestatistics.org/blog/index.php?pk=5425&T=1

Globally Unique Identifier (entire table): ba.freestatistics.org/blog/index.php?pk=5425&T=1

As an alternative you can also use a QR Code:  

The GUIDs for individual cells are displayed in the table below:

Multiple Linear Regression - Estimated Regression Equation
y[t] = + 116.117805975632 + 7.3629767954448x[t] -0.658850251479013M1[t] -4.52683317233233M2[t] -10.0614827598522M3[t] -14.3739101251499M4[t] -20.1307819348921M5[t] -20.4432093001898M6[t] + 13.1332522234014M7[t] + 24.4874915247703M8[t] + 21.5791778488676M9[t] + 11.7515256830638M10[t] + 3.71520514307549M11[t] + 0.0902051430754819t + e[t]


Multiple Linear Regression - Ordinary Least Squares
VariableParameterS.D.T-STATH0: parameter = 02-tail p-value1-tail p-value
(Intercept)116.1178059756323.74252331.026600
x7.36297679544481.9012933.87260.0002010.000101
M1-0.6588502514790134.517819-0.14580.8843720.442186
M2-4.526833172332334.51691-1.00220.3188770.159439
M3-10.06148275985224.516196-2.22790.0283270.014164
M4-14.37391012514994.515676-3.18310.0019880.000994
M5-20.13078193489214.515352-4.45832.3e-051.2e-05
M6-20.44320930018984.515222-4.52761.8e-059e-06
M713.13325222340144.5152872.90860.0045510.002275
M824.48749152477034.5155465.422900
M921.57917784886764.5174964.77687e-063e-06
M1011.75152568306384.516652.60180.0108070.005403
M113.715205143075494.6455040.79970.425920.21296
t0.09020514307548190.0296623.04110.003070.001535

\begin{tabular}{lllllllll}
\hline
Multiple Linear Regression - Ordinary Least Squares \tabularnewline
Variable & Parameter & S.D. & T-STATH0: parameter = 0 & 2-tail p-value & 1-tail p-value \tabularnewline
(Intercept) & 116.117805975632 & 3.742523 & 31.0266 & 0 & 0 \tabularnewline
x & 7.3629767954448 & 1.901293 & 3.8726 & 0.000201 & 0.000101 \tabularnewline
M1 & -0.658850251479013 & 4.517819 & -0.1458 & 0.884372 & 0.442186 \tabularnewline
M2 & -4.52683317233233 & 4.51691 & -1.0022 & 0.318877 & 0.159439 \tabularnewline
M3 & -10.0614827598522 & 4.516196 & -2.2279 & 0.028327 & 0.014164 \tabularnewline
M4 & -14.3739101251499 & 4.515676 & -3.1831 & 0.001988 & 0.000994 \tabularnewline
M5 & -20.1307819348921 & 4.515352 & -4.4583 & 2.3e-05 & 1.2e-05 \tabularnewline
M6 & -20.4432093001898 & 4.515222 & -4.5276 & 1.8e-05 & 9e-06 \tabularnewline
M7 & 13.1332522234014 & 4.515287 & 2.9086 & 0.004551 & 0.002275 \tabularnewline
M8 & 24.4874915247703 & 4.515546 & 5.4229 & 0 & 0 \tabularnewline
M9 & 21.5791778488676 & 4.517496 & 4.7768 & 7e-06 & 3e-06 \tabularnewline
M10 & 11.7515256830638 & 4.51665 & 2.6018 & 0.010807 & 0.005403 \tabularnewline
M11 & 3.71520514307549 & 4.645504 & 0.7997 & 0.42592 & 0.21296 \tabularnewline
t & 0.0902051430754819 & 0.029662 & 3.0411 & 0.00307 & 0.001535 \tabularnewline
\hline
\end{tabular}
%Source: https://freestatistics.org/blog/index.php?pk=5425&T=2

[TABLE]
[ROW][C]Multiple Linear Regression - Ordinary Least Squares[/C][/ROW]
[ROW][C]Variable[/C][C]Parameter[/C][C]S.D.[/C][C]T-STATH0: parameter = 0[/C][C]2-tail p-value[/C][C]1-tail p-value[/C][/ROW]
[ROW][C](Intercept)[/C][C]116.117805975632[/C][C]3.742523[/C][C]31.0266[/C][C]0[/C][C]0[/C][/ROW]
[ROW][C]x[/C][C]7.3629767954448[/C][C]1.901293[/C][C]3.8726[/C][C]0.000201[/C][C]0.000101[/C][/ROW]
[ROW][C]M1[/C][C]-0.658850251479013[/C][C]4.517819[/C][C]-0.1458[/C][C]0.884372[/C][C]0.442186[/C][/ROW]
[ROW][C]M2[/C][C]-4.52683317233233[/C][C]4.51691[/C][C]-1.0022[/C][C]0.318877[/C][C]0.159439[/C][/ROW]
[ROW][C]M3[/C][C]-10.0614827598522[/C][C]4.516196[/C][C]-2.2279[/C][C]0.028327[/C][C]0.014164[/C][/ROW]
[ROW][C]M4[/C][C]-14.3739101251499[/C][C]4.515676[/C][C]-3.1831[/C][C]0.001988[/C][C]0.000994[/C][/ROW]
[ROW][C]M5[/C][C]-20.1307819348921[/C][C]4.515352[/C][C]-4.4583[/C][C]2.3e-05[/C][C]1.2e-05[/C][/ROW]
[ROW][C]M6[/C][C]-20.4432093001898[/C][C]4.515222[/C][C]-4.5276[/C][C]1.8e-05[/C][C]9e-06[/C][/ROW]
[ROW][C]M7[/C][C]13.1332522234014[/C][C]4.515287[/C][C]2.9086[/C][C]0.004551[/C][C]0.002275[/C][/ROW]
[ROW][C]M8[/C][C]24.4874915247703[/C][C]4.515546[/C][C]5.4229[/C][C]0[/C][C]0[/C][/ROW]
[ROW][C]M9[/C][C]21.5791778488676[/C][C]4.517496[/C][C]4.7768[/C][C]7e-06[/C][C]3e-06[/C][/ROW]
[ROW][C]M10[/C][C]11.7515256830638[/C][C]4.51665[/C][C]2.6018[/C][C]0.010807[/C][C]0.005403[/C][/ROW]
[ROW][C]M11[/C][C]3.71520514307549[/C][C]4.645504[/C][C]0.7997[/C][C]0.42592[/C][C]0.21296[/C][/ROW]
[ROW][C]t[/C][C]0.0902051430754819[/C][C]0.029662[/C][C]3.0411[/C][C]0.00307[/C][C]0.001535[/C][/ROW]
[/TABLE]
Source: https://freestatistics.org/blog/index.php?pk=5425&T=2

Globally Unique Identifier (entire table): ba.freestatistics.org/blog/index.php?pk=5425&T=2

As an alternative you can also use a QR Code:  

The GUIDs for individual cells are displayed in the table below:

Multiple Linear Regression - Ordinary Least Squares
VariableParameterS.D.T-STATH0: parameter = 02-tail p-value1-tail p-value
(Intercept)116.1178059756323.74252331.026600
x7.36297679544481.9012933.87260.0002010.000101
M1-0.6588502514790134.517819-0.14580.8843720.442186
M2-4.526833172332334.51691-1.00220.3188770.159439
M3-10.06148275985224.516196-2.22790.0283270.014164
M4-14.37391012514994.515676-3.18310.0019880.000994
M5-20.13078193489214.515352-4.45832.3e-051.2e-05
M6-20.44320930018984.515222-4.52761.8e-059e-06
M713.13325222340144.5152872.90860.0045510.002275
M824.48749152477034.5155465.422900
M921.57917784886764.5174964.77687e-063e-06
M1011.75152568306384.516652.60180.0108070.005403
M113.715205143075494.6455040.79970.425920.21296
t0.09020514307548190.0296623.04110.003070.001535


Multiple Linear Regression - Regression Statistics
Multiple R0.873672379650808
R-squared0.763303426964705
Adjusted R-squared0.729857172079283
F-TEST (value)22.8217906482976
F-TEST (DF numerator)13
F-TEST (DF denominator)92
p-value0
Multiple Linear Regression - Residual Statistics
Residual Standard Deviation9.29081927231896
Sum Squared Residuals7941.37769308219

\begin{tabular}{lllllllll}
\hline
Multiple Linear Regression - Regression Statistics \tabularnewline
Multiple R & 0.873672379650808 \tabularnewline
R-squared & 0.763303426964705 \tabularnewline
Adjusted R-squared & 0.729857172079283 \tabularnewline
F-TEST (value) & 22.8217906482976 \tabularnewline
F-TEST (DF numerator) & 13 \tabularnewline
F-TEST (DF denominator) & 92 \tabularnewline
p-value & 0 \tabularnewline
Multiple Linear Regression - Residual Statistics \tabularnewline
Residual Standard Deviation & 9.29081927231896 \tabularnewline
Sum Squared Residuals & 7941.37769308219 \tabularnewline
\hline
\end{tabular}
%Source: https://freestatistics.org/blog/index.php?pk=5425&T=3

[TABLE]
[ROW][C]Multiple Linear Regression - Regression Statistics[/C][/ROW]
[ROW][C]Multiple R[/C][C]0.873672379650808[/C][/ROW]
[ROW][C]R-squared[/C][C]0.763303426964705[/C][/ROW]
[ROW][C]Adjusted R-squared[/C][C]0.729857172079283[/C][/ROW]
[ROW][C]F-TEST (value)[/C][C]22.8217906482976[/C][/ROW]
[ROW][C]F-TEST (DF numerator)[/C][C]13[/C][/ROW]
[ROW][C]F-TEST (DF denominator)[/C][C]92[/C][/ROW]
[ROW][C]p-value[/C][C]0[/C][/ROW]
[ROW][C]Multiple Linear Regression - Residual Statistics[/C][/ROW]
[ROW][C]Residual Standard Deviation[/C][C]9.29081927231896[/C][/ROW]
[ROW][C]Sum Squared Residuals[/C][C]7941.37769308219[/C][/ROW]
[/TABLE]
Source: https://freestatistics.org/blog/index.php?pk=5425&T=3

Globally Unique Identifier (entire table): ba.freestatistics.org/blog/index.php?pk=5425&T=3

As an alternative you can also use a QR Code:  

The GUIDs for individual cells are displayed in the table below:

Multiple Linear Regression - Regression Statistics
Multiple R0.873672379650808
R-squared0.763303426964705
Adjusted R-squared0.729857172079283
F-TEST (value)22.8217906482976
F-TEST (DF numerator)13
F-TEST (DF denominator)92
p-value0
Multiple Linear Regression - Residual Statistics
Residual Standard Deviation9.29081927231896
Sum Squared Residuals7941.37769308219


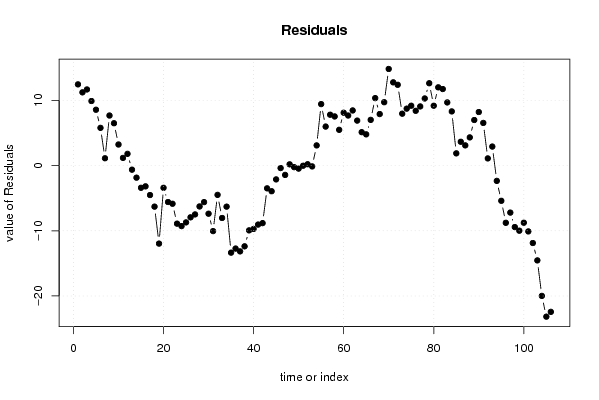
Multiple Linear Regression - Actuals, Interpolation, and Residuals
Time or IndexActualsInterpolationForecastResidualsPrediction Error
1128115.54916086722812.4508391327719
2123111.77138308945111.2286169105492
3118106.32693864500611.6730613549937
4112102.1047164227849.89528357721588
510596.43804975611768.56195024388245
610296.21582753389535.78417246610473
7131129.8824942005621.11750579943800
8149141.3269386450067.67306135499358
9145138.5088301121796.4911698878208
10132128.7713830894513.22861691054921
11122120.8252676925381.17473230746208
12119117.2002676925381.79973230746203
13116116.631622584134-0.63162258413444
14111112.853844806357-1.85384480635658
15104107.409400361912-3.40940036191217
16100103.18717813969-3.18717813968995
179397.5205114730233-4.52051147302327
189197.298289250801-6.29828925080105
19119130.964955917468-11.9649559174677
20139142.409400361912-3.40940036191216
21134139.591291829085-5.59129182908495
22124129.853844806357-5.85384480635661
23113121.907729409444-8.90772940944374
24109118.282729409444-9.28272940944374
25109117.714084301040-8.71408430104023
26106113.936306523262-7.9363065232624
27101108.491862078818-7.49186207881795
2898104.269639856596-6.26963985659573
299398.602973189929-5.60297318992905
309198.3807509677068-7.38075096770683
31122132.047417634373-10.0474176343735
32139143.491862078818-4.49186207881794
33140148.036730341436-8.03673034143554
34132138.299283318707-6.29928331870719
35117130.353167921794-13.3531679217943
36114126.728167921794-12.7281679217943
37113126.159522813391-13.1595228133908
38110122.381745035613-12.3817450356130
39107116.937300591169-9.93730059116854
40103112.715078368946-9.7150783689463
4198107.048411702280-9.04841170227963
4298106.826189480057-8.82618948005742
43137140.492856146724-3.49285614672407
44148151.937300591169-3.93730059116852
45147149.119192058341-2.11919205834133
46139139.381745035613-0.381745035612973
47130131.4356296387-1.43562963870012
48128127.81062963870.189370361299889
49127127.241984530297-0.241984530296595
50123123.464206752519-0.464206752518757
51118118.019762308074-0.0197623080743188
52114113.7975400858520.202459914147909
53108108.130873419185-0.130873419185412
54111107.9086511969633.0913488030368
55151141.575317863639.42468213637015
56159153.0197623080745.9802376919257
57158150.2016537752477.79834622475289
58148140.4642067525197.53579324748124
59138132.5180913556065.4819086443941
60137128.8930913556068.1069086443941
61136128.3244462472027.67555375279762
62133124.5466684694258.45333153057546
63126119.102224024986.8977759750199
64120114.8800018027585.11999819724213
65114109.2133351360914.7866648639088
66116108.9911129138697.00888708613102
67153142.65777958053610.3422204194644
68162154.102224024987.89777597501991
69161151.2841154921539.7158845078471
70149134.18369167398014.8163083260203
71139126.23757627706712.7624237229331
72135122.61257627706712.3874237229331
73130122.0439311686637.95606883133664
74127118.2661533908868.73384660911448
75122112.8217089464419.17829105355892
76117108.5994867242198.40051327578114
77112102.9328200575529.06717994244783
78113102.7105978353310.2894021646700
79149136.37726450199712.6227354980034
80157147.8217089464419.17829105355893
81157145.00360041361411.9963995863861
82147135.26615339088611.7338466091145
83137127.3200379939739.67996200602733
84132123.6950379939738.30496200602734
85125123.1263928855691.87360711443086
86123119.3486151077913.65138489220869
87117113.9041706633473.09582933665313
88114109.6819484411254.31805155887535
89111104.0152817744586.98471822554204
90112103.7930595522368.20694044776425
91144137.4597262189026.54027378109759
92150148.9041706633471.09582933665314
93149146.0860621305202.91393786948034
94134136.348615107791-2.34861510779131
95123128.402499710878-5.40249971087845
96116124.777499710878-8.77749971087844
97117124.208854602475-7.20885460247493
98111120.431076824697-9.43107682469709
99105114.986632380253-9.98663238025265
100102110.764410158030-8.76441015803043
10195105.097743491364-10.0977434913637
10293104.875521269142-11.8755212691415
103124138.542187935808-14.5421879358082
104130149.986632380253-19.9866323802526
105124147.168523847425-23.1685238474254
106115137.431076824697-22.4310768246971

\begin{tabular}{lllllllll}
\hline
Multiple Linear Regression - Actuals, Interpolation, and Residuals \tabularnewline
Time or Index & Actuals & InterpolationForecast & ResidualsPrediction Error \tabularnewline
1 & 128 & 115.549160867228 & 12.4508391327719 \tabularnewline
2 & 123 & 111.771383089451 & 11.2286169105492 \tabularnewline
3 & 118 & 106.326938645006 & 11.6730613549937 \tabularnewline
4 & 112 & 102.104716422784 & 9.89528357721588 \tabularnewline
5 & 105 & 96.4380497561176 & 8.56195024388245 \tabularnewline
6 & 102 & 96.2158275338953 & 5.78417246610473 \tabularnewline
7 & 131 & 129.882494200562 & 1.11750579943800 \tabularnewline
8 & 149 & 141.326938645006 & 7.67306135499358 \tabularnewline
9 & 145 & 138.508830112179 & 6.4911698878208 \tabularnewline
10 & 132 & 128.771383089451 & 3.22861691054921 \tabularnewline
11 & 122 & 120.825267692538 & 1.17473230746208 \tabularnewline
12 & 119 & 117.200267692538 & 1.79973230746203 \tabularnewline
13 & 116 & 116.631622584134 & -0.63162258413444 \tabularnewline
14 & 111 & 112.853844806357 & -1.85384480635658 \tabularnewline
15 & 104 & 107.409400361912 & -3.40940036191217 \tabularnewline
16 & 100 & 103.18717813969 & -3.18717813968995 \tabularnewline
17 & 93 & 97.5205114730233 & -4.52051147302327 \tabularnewline
18 & 91 & 97.298289250801 & -6.29828925080105 \tabularnewline
19 & 119 & 130.964955917468 & -11.9649559174677 \tabularnewline
20 & 139 & 142.409400361912 & -3.40940036191216 \tabularnewline
21 & 134 & 139.591291829085 & -5.59129182908495 \tabularnewline
22 & 124 & 129.853844806357 & -5.85384480635661 \tabularnewline
23 & 113 & 121.907729409444 & -8.90772940944374 \tabularnewline
24 & 109 & 118.282729409444 & -9.28272940944374 \tabularnewline
25 & 109 & 117.714084301040 & -8.71408430104023 \tabularnewline
26 & 106 & 113.936306523262 & -7.9363065232624 \tabularnewline
27 & 101 & 108.491862078818 & -7.49186207881795 \tabularnewline
28 & 98 & 104.269639856596 & -6.26963985659573 \tabularnewline
29 & 93 & 98.602973189929 & -5.60297318992905 \tabularnewline
30 & 91 & 98.3807509677068 & -7.38075096770683 \tabularnewline
31 & 122 & 132.047417634373 & -10.0474176343735 \tabularnewline
32 & 139 & 143.491862078818 & -4.49186207881794 \tabularnewline
33 & 140 & 148.036730341436 & -8.03673034143554 \tabularnewline
34 & 132 & 138.299283318707 & -6.29928331870719 \tabularnewline
35 & 117 & 130.353167921794 & -13.3531679217943 \tabularnewline
36 & 114 & 126.728167921794 & -12.7281679217943 \tabularnewline
37 & 113 & 126.159522813391 & -13.1595228133908 \tabularnewline
38 & 110 & 122.381745035613 & -12.3817450356130 \tabularnewline
39 & 107 & 116.937300591169 & -9.93730059116854 \tabularnewline
40 & 103 & 112.715078368946 & -9.7150783689463 \tabularnewline
41 & 98 & 107.048411702280 & -9.04841170227963 \tabularnewline
42 & 98 & 106.826189480057 & -8.82618948005742 \tabularnewline
43 & 137 & 140.492856146724 & -3.49285614672407 \tabularnewline
44 & 148 & 151.937300591169 & -3.93730059116852 \tabularnewline
45 & 147 & 149.119192058341 & -2.11919205834133 \tabularnewline
46 & 139 & 139.381745035613 & -0.381745035612973 \tabularnewline
47 & 130 & 131.4356296387 & -1.43562963870012 \tabularnewline
48 & 128 & 127.8106296387 & 0.189370361299889 \tabularnewline
49 & 127 & 127.241984530297 & -0.241984530296595 \tabularnewline
50 & 123 & 123.464206752519 & -0.464206752518757 \tabularnewline
51 & 118 & 118.019762308074 & -0.0197623080743188 \tabularnewline
52 & 114 & 113.797540085852 & 0.202459914147909 \tabularnewline
53 & 108 & 108.130873419185 & -0.130873419185412 \tabularnewline
54 & 111 & 107.908651196963 & 3.0913488030368 \tabularnewline
55 & 151 & 141.57531786363 & 9.42468213637015 \tabularnewline
56 & 159 & 153.019762308074 & 5.9802376919257 \tabularnewline
57 & 158 & 150.201653775247 & 7.79834622475289 \tabularnewline
58 & 148 & 140.464206752519 & 7.53579324748124 \tabularnewline
59 & 138 & 132.518091355606 & 5.4819086443941 \tabularnewline
60 & 137 & 128.893091355606 & 8.1069086443941 \tabularnewline
61 & 136 & 128.324446247202 & 7.67555375279762 \tabularnewline
62 & 133 & 124.546668469425 & 8.45333153057546 \tabularnewline
63 & 126 & 119.10222402498 & 6.8977759750199 \tabularnewline
64 & 120 & 114.880001802758 & 5.11999819724213 \tabularnewline
65 & 114 & 109.213335136091 & 4.7866648639088 \tabularnewline
66 & 116 & 108.991112913869 & 7.00888708613102 \tabularnewline
67 & 153 & 142.657779580536 & 10.3422204194644 \tabularnewline
68 & 162 & 154.10222402498 & 7.89777597501991 \tabularnewline
69 & 161 & 151.284115492153 & 9.7158845078471 \tabularnewline
70 & 149 & 134.183691673980 & 14.8163083260203 \tabularnewline
71 & 139 & 126.237576277067 & 12.7624237229331 \tabularnewline
72 & 135 & 122.612576277067 & 12.3874237229331 \tabularnewline
73 & 130 & 122.043931168663 & 7.95606883133664 \tabularnewline
74 & 127 & 118.266153390886 & 8.73384660911448 \tabularnewline
75 & 122 & 112.821708946441 & 9.17829105355892 \tabularnewline
76 & 117 & 108.599486724219 & 8.40051327578114 \tabularnewline
77 & 112 & 102.932820057552 & 9.06717994244783 \tabularnewline
78 & 113 & 102.71059783533 & 10.2894021646700 \tabularnewline
79 & 149 & 136.377264501997 & 12.6227354980034 \tabularnewline
80 & 157 & 147.821708946441 & 9.17829105355893 \tabularnewline
81 & 157 & 145.003600413614 & 11.9963995863861 \tabularnewline
82 & 147 & 135.266153390886 & 11.7338466091145 \tabularnewline
83 & 137 & 127.320037993973 & 9.67996200602733 \tabularnewline
84 & 132 & 123.695037993973 & 8.30496200602734 \tabularnewline
85 & 125 & 123.126392885569 & 1.87360711443086 \tabularnewline
86 & 123 & 119.348615107791 & 3.65138489220869 \tabularnewline
87 & 117 & 113.904170663347 & 3.09582933665313 \tabularnewline
88 & 114 & 109.681948441125 & 4.31805155887535 \tabularnewline
89 & 111 & 104.015281774458 & 6.98471822554204 \tabularnewline
90 & 112 & 103.793059552236 & 8.20694044776425 \tabularnewline
91 & 144 & 137.459726218902 & 6.54027378109759 \tabularnewline
92 & 150 & 148.904170663347 & 1.09582933665314 \tabularnewline
93 & 149 & 146.086062130520 & 2.91393786948034 \tabularnewline
94 & 134 & 136.348615107791 & -2.34861510779131 \tabularnewline
95 & 123 & 128.402499710878 & -5.40249971087845 \tabularnewline
96 & 116 & 124.777499710878 & -8.77749971087844 \tabularnewline
97 & 117 & 124.208854602475 & -7.20885460247493 \tabularnewline
98 & 111 & 120.431076824697 & -9.43107682469709 \tabularnewline
99 & 105 & 114.986632380253 & -9.98663238025265 \tabularnewline
100 & 102 & 110.764410158030 & -8.76441015803043 \tabularnewline
101 & 95 & 105.097743491364 & -10.0977434913637 \tabularnewline
102 & 93 & 104.875521269142 & -11.8755212691415 \tabularnewline
103 & 124 & 138.542187935808 & -14.5421879358082 \tabularnewline
104 & 130 & 149.986632380253 & -19.9866323802526 \tabularnewline
105 & 124 & 147.168523847425 & -23.1685238474254 \tabularnewline
106 & 115 & 137.431076824697 & -22.4310768246971 \tabularnewline
\hline
\end{tabular}
%Source: https://freestatistics.org/blog/index.php?pk=5425&T=4

[TABLE]
[ROW][C]Multiple Linear Regression - Actuals, Interpolation, and Residuals[/C][/ROW]
[ROW][C]Time or Index[/C][C]Actuals[/C][C]InterpolationForecast[/C][C]ResidualsPrediction Error[/C][/ROW]
[ROW][C]1[/C][C]128[/C][C]115.549160867228[/C][C]12.4508391327719[/C][/ROW]
[ROW][C]2[/C][C]123[/C][C]111.771383089451[/C][C]11.2286169105492[/C][/ROW]
[ROW][C]3[/C][C]118[/C][C]106.326938645006[/C][C]11.6730613549937[/C][/ROW]
[ROW][C]4[/C][C]112[/C][C]102.104716422784[/C][C]9.89528357721588[/C][/ROW]
[ROW][C]5[/C][C]105[/C][C]96.4380497561176[/C][C]8.56195024388245[/C][/ROW]
[ROW][C]6[/C][C]102[/C][C]96.2158275338953[/C][C]5.78417246610473[/C][/ROW]
[ROW][C]7[/C][C]131[/C][C]129.882494200562[/C][C]1.11750579943800[/C][/ROW]
[ROW][C]8[/C][C]149[/C][C]141.326938645006[/C][C]7.67306135499358[/C][/ROW]
[ROW][C]9[/C][C]145[/C][C]138.508830112179[/C][C]6.4911698878208[/C][/ROW]
[ROW][C]10[/C][C]132[/C][C]128.771383089451[/C][C]3.22861691054921[/C][/ROW]
[ROW][C]11[/C][C]122[/C][C]120.825267692538[/C][C]1.17473230746208[/C][/ROW]
[ROW][C]12[/C][C]119[/C][C]117.200267692538[/C][C]1.79973230746203[/C][/ROW]
[ROW][C]13[/C][C]116[/C][C]116.631622584134[/C][C]-0.63162258413444[/C][/ROW]
[ROW][C]14[/C][C]111[/C][C]112.853844806357[/C][C]-1.85384480635658[/C][/ROW]
[ROW][C]15[/C][C]104[/C][C]107.409400361912[/C][C]-3.40940036191217[/C][/ROW]
[ROW][C]16[/C][C]100[/C][C]103.18717813969[/C][C]-3.18717813968995[/C][/ROW]
[ROW][C]17[/C][C]93[/C][C]97.5205114730233[/C][C]-4.52051147302327[/C][/ROW]
[ROW][C]18[/C][C]91[/C][C]97.298289250801[/C][C]-6.29828925080105[/C][/ROW]
[ROW][C]19[/C][C]119[/C][C]130.964955917468[/C][C]-11.9649559174677[/C][/ROW]
[ROW][C]20[/C][C]139[/C][C]142.409400361912[/C][C]-3.40940036191216[/C][/ROW]
[ROW][C]21[/C][C]134[/C][C]139.591291829085[/C][C]-5.59129182908495[/C][/ROW]
[ROW][C]22[/C][C]124[/C][C]129.853844806357[/C][C]-5.85384480635661[/C][/ROW]
[ROW][C]23[/C][C]113[/C][C]121.907729409444[/C][C]-8.90772940944374[/C][/ROW]
[ROW][C]24[/C][C]109[/C][C]118.282729409444[/C][C]-9.28272940944374[/C][/ROW]
[ROW][C]25[/C][C]109[/C][C]117.714084301040[/C][C]-8.71408430104023[/C][/ROW]
[ROW][C]26[/C][C]106[/C][C]113.936306523262[/C][C]-7.9363065232624[/C][/ROW]
[ROW][C]27[/C][C]101[/C][C]108.491862078818[/C][C]-7.49186207881795[/C][/ROW]
[ROW][C]28[/C][C]98[/C][C]104.269639856596[/C][C]-6.26963985659573[/C][/ROW]
[ROW][C]29[/C][C]93[/C][C]98.602973189929[/C][C]-5.60297318992905[/C][/ROW]
[ROW][C]30[/C][C]91[/C][C]98.3807509677068[/C][C]-7.38075096770683[/C][/ROW]
[ROW][C]31[/C][C]122[/C][C]132.047417634373[/C][C]-10.0474176343735[/C][/ROW]
[ROW][C]32[/C][C]139[/C][C]143.491862078818[/C][C]-4.49186207881794[/C][/ROW]
[ROW][C]33[/C][C]140[/C][C]148.036730341436[/C][C]-8.03673034143554[/C][/ROW]
[ROW][C]34[/C][C]132[/C][C]138.299283318707[/C][C]-6.29928331870719[/C][/ROW]
[ROW][C]35[/C][C]117[/C][C]130.353167921794[/C][C]-13.3531679217943[/C][/ROW]
[ROW][C]36[/C][C]114[/C][C]126.728167921794[/C][C]-12.7281679217943[/C][/ROW]
[ROW][C]37[/C][C]113[/C][C]126.159522813391[/C][C]-13.1595228133908[/C][/ROW]
[ROW][C]38[/C][C]110[/C][C]122.381745035613[/C][C]-12.3817450356130[/C][/ROW]
[ROW][C]39[/C][C]107[/C][C]116.937300591169[/C][C]-9.93730059116854[/C][/ROW]
[ROW][C]40[/C][C]103[/C][C]112.715078368946[/C][C]-9.7150783689463[/C][/ROW]
[ROW][C]41[/C][C]98[/C][C]107.048411702280[/C][C]-9.04841170227963[/C][/ROW]
[ROW][C]42[/C][C]98[/C][C]106.826189480057[/C][C]-8.82618948005742[/C][/ROW]
[ROW][C]43[/C][C]137[/C][C]140.492856146724[/C][C]-3.49285614672407[/C][/ROW]
[ROW][C]44[/C][C]148[/C][C]151.937300591169[/C][C]-3.93730059116852[/C][/ROW]
[ROW][C]45[/C][C]147[/C][C]149.119192058341[/C][C]-2.11919205834133[/C][/ROW]
[ROW][C]46[/C][C]139[/C][C]139.381745035613[/C][C]-0.381745035612973[/C][/ROW]
[ROW][C]47[/C][C]130[/C][C]131.4356296387[/C][C]-1.43562963870012[/C][/ROW]
[ROW][C]48[/C][C]128[/C][C]127.8106296387[/C][C]0.189370361299889[/C][/ROW]
[ROW][C]49[/C][C]127[/C][C]127.241984530297[/C][C]-0.241984530296595[/C][/ROW]
[ROW][C]50[/C][C]123[/C][C]123.464206752519[/C][C]-0.464206752518757[/C][/ROW]
[ROW][C]51[/C][C]118[/C][C]118.019762308074[/C][C]-0.0197623080743188[/C][/ROW]
[ROW][C]52[/C][C]114[/C][C]113.797540085852[/C][C]0.202459914147909[/C][/ROW]
[ROW][C]53[/C][C]108[/C][C]108.130873419185[/C][C]-0.130873419185412[/C][/ROW]
[ROW][C]54[/C][C]111[/C][C]107.908651196963[/C][C]3.0913488030368[/C][/ROW]
[ROW][C]55[/C][C]151[/C][C]141.57531786363[/C][C]9.42468213637015[/C][/ROW]
[ROW][C]56[/C][C]159[/C][C]153.019762308074[/C][C]5.9802376919257[/C][/ROW]
[ROW][C]57[/C][C]158[/C][C]150.201653775247[/C][C]7.79834622475289[/C][/ROW]
[ROW][C]58[/C][C]148[/C][C]140.464206752519[/C][C]7.53579324748124[/C][/ROW]
[ROW][C]59[/C][C]138[/C][C]132.518091355606[/C][C]5.4819086443941[/C][/ROW]
[ROW][C]60[/C][C]137[/C][C]128.893091355606[/C][C]8.1069086443941[/C][/ROW]
[ROW][C]61[/C][C]136[/C][C]128.324446247202[/C][C]7.67555375279762[/C][/ROW]
[ROW][C]62[/C][C]133[/C][C]124.546668469425[/C][C]8.45333153057546[/C][/ROW]
[ROW][C]63[/C][C]126[/C][C]119.10222402498[/C][C]6.8977759750199[/C][/ROW]
[ROW][C]64[/C][C]120[/C][C]114.880001802758[/C][C]5.11999819724213[/C][/ROW]
[ROW][C]65[/C][C]114[/C][C]109.213335136091[/C][C]4.7866648639088[/C][/ROW]
[ROW][C]66[/C][C]116[/C][C]108.991112913869[/C][C]7.00888708613102[/C][/ROW]
[ROW][C]67[/C][C]153[/C][C]142.657779580536[/C][C]10.3422204194644[/C][/ROW]
[ROW][C]68[/C][C]162[/C][C]154.10222402498[/C][C]7.89777597501991[/C][/ROW]
[ROW][C]69[/C][C]161[/C][C]151.284115492153[/C][C]9.7158845078471[/C][/ROW]
[ROW][C]70[/C][C]149[/C][C]134.183691673980[/C][C]14.8163083260203[/C][/ROW]
[ROW][C]71[/C][C]139[/C][C]126.237576277067[/C][C]12.7624237229331[/C][/ROW]
[ROW][C]72[/C][C]135[/C][C]122.612576277067[/C][C]12.3874237229331[/C][/ROW]
[ROW][C]73[/C][C]130[/C][C]122.043931168663[/C][C]7.95606883133664[/C][/ROW]
[ROW][C]74[/C][C]127[/C][C]118.266153390886[/C][C]8.73384660911448[/C][/ROW]
[ROW][C]75[/C][C]122[/C][C]112.821708946441[/C][C]9.17829105355892[/C][/ROW]
[ROW][C]76[/C][C]117[/C][C]108.599486724219[/C][C]8.40051327578114[/C][/ROW]
[ROW][C]77[/C][C]112[/C][C]102.932820057552[/C][C]9.06717994244783[/C][/ROW]
[ROW][C]78[/C][C]113[/C][C]102.71059783533[/C][C]10.2894021646700[/C][/ROW]
[ROW][C]79[/C][C]149[/C][C]136.377264501997[/C][C]12.6227354980034[/C][/ROW]
[ROW][C]80[/C][C]157[/C][C]147.821708946441[/C][C]9.17829105355893[/C][/ROW]
[ROW][C]81[/C][C]157[/C][C]145.003600413614[/C][C]11.9963995863861[/C][/ROW]
[ROW][C]82[/C][C]147[/C][C]135.266153390886[/C][C]11.7338466091145[/C][/ROW]
[ROW][C]83[/C][C]137[/C][C]127.320037993973[/C][C]9.67996200602733[/C][/ROW]
[ROW][C]84[/C][C]132[/C][C]123.695037993973[/C][C]8.30496200602734[/C][/ROW]
[ROW][C]85[/C][C]125[/C][C]123.126392885569[/C][C]1.87360711443086[/C][/ROW]
[ROW][C]86[/C][C]123[/C][C]119.348615107791[/C][C]3.65138489220869[/C][/ROW]
[ROW][C]87[/C][C]117[/C][C]113.904170663347[/C][C]3.09582933665313[/C][/ROW]
[ROW][C]88[/C][C]114[/C][C]109.681948441125[/C][C]4.31805155887535[/C][/ROW]
[ROW][C]89[/C][C]111[/C][C]104.015281774458[/C][C]6.98471822554204[/C][/ROW]
[ROW][C]90[/C][C]112[/C][C]103.793059552236[/C][C]8.20694044776425[/C][/ROW]
[ROW][C]91[/C][C]144[/C][C]137.459726218902[/C][C]6.54027378109759[/C][/ROW]
[ROW][C]92[/C][C]150[/C][C]148.904170663347[/C][C]1.09582933665314[/C][/ROW]
[ROW][C]93[/C][C]149[/C][C]146.086062130520[/C][C]2.91393786948034[/C][/ROW]
[ROW][C]94[/C][C]134[/C][C]136.348615107791[/C][C]-2.34861510779131[/C][/ROW]
[ROW][C]95[/C][C]123[/C][C]128.402499710878[/C][C]-5.40249971087845[/C][/ROW]
[ROW][C]96[/C][C]116[/C][C]124.777499710878[/C][C]-8.77749971087844[/C][/ROW]
[ROW][C]97[/C][C]117[/C][C]124.208854602475[/C][C]-7.20885460247493[/C][/ROW]
[ROW][C]98[/C][C]111[/C][C]120.431076824697[/C][C]-9.43107682469709[/C][/ROW]
[ROW][C]99[/C][C]105[/C][C]114.986632380253[/C][C]-9.98663238025265[/C][/ROW]
[ROW][C]100[/C][C]102[/C][C]110.764410158030[/C][C]-8.76441015803043[/C][/ROW]
[ROW][C]101[/C][C]95[/C][C]105.097743491364[/C][C]-10.0977434913637[/C][/ROW]
[ROW][C]102[/C][C]93[/C][C]104.875521269142[/C][C]-11.8755212691415[/C][/ROW]
[ROW][C]103[/C][C]124[/C][C]138.542187935808[/C][C]-14.5421879358082[/C][/ROW]
[ROW][C]104[/C][C]130[/C][C]149.986632380253[/C][C]-19.9866323802526[/C][/ROW]
[ROW][C]105[/C][C]124[/C][C]147.168523847425[/C][C]-23.1685238474254[/C][/ROW]
[ROW][C]106[/C][C]115[/C][C]137.431076824697[/C][C]-22.4310768246971[/C][/ROW]
[/TABLE]
Source: https://freestatistics.org/blog/index.php?pk=5425&T=4

Globally Unique Identifier (entire table): ba.freestatistics.org/blog/index.php?pk=5425&T=4

As an alternative you can also use a QR Code:  

The GUIDs for individual cells are displayed in the table below:

Multiple Linear Regression - Actuals, Interpolation, and Residuals
Time or IndexActualsInterpolationForecastResidualsPrediction Error
1128115.54916086722812.4508391327719
2123111.77138308945111.2286169105492
3118106.32693864500611.6730613549937
4112102.1047164227849.89528357721588
510596.43804975611768.56195024388245
610296.21582753389535.78417246610473
7131129.8824942005621.11750579943800
8149141.3269386450067.67306135499358
9145138.5088301121796.4911698878208
10132128.7713830894513.22861691054921
11122120.8252676925381.17473230746208
12119117.2002676925381.79973230746203
13116116.631622584134-0.63162258413444
14111112.853844806357-1.85384480635658
15104107.409400361912-3.40940036191217
16100103.18717813969-3.18717813968995
179397.5205114730233-4.52051147302327
189197.298289250801-6.29828925080105
19119130.964955917468-11.9649559174677
20139142.409400361912-3.40940036191216
21134139.591291829085-5.59129182908495
22124129.853844806357-5.85384480635661
23113121.907729409444-8.90772940944374
24109118.282729409444-9.28272940944374
25109117.714084301040-8.71408430104023
26106113.936306523262-7.9363065232624
27101108.491862078818-7.49186207881795
2898104.269639856596-6.26963985659573
299398.602973189929-5.60297318992905
309198.3807509677068-7.38075096770683
31122132.047417634373-10.0474176343735
32139143.491862078818-4.49186207881794
33140148.036730341436-8.03673034143554
34132138.299283318707-6.29928331870719
35117130.353167921794-13.3531679217943
36114126.728167921794-12.7281679217943
37113126.159522813391-13.1595228133908
38110122.381745035613-12.3817450356130
39107116.937300591169-9.93730059116854
40103112.715078368946-9.7150783689463
4198107.048411702280-9.04841170227963
4298106.826189480057-8.82618948005742
43137140.492856146724-3.49285614672407
44148151.937300591169-3.93730059116852
45147149.119192058341-2.11919205834133
46139139.381745035613-0.381745035612973
47130131.4356296387-1.43562963870012
48128127.81062963870.189370361299889
49127127.241984530297-0.241984530296595
50123123.464206752519-0.464206752518757
51118118.019762308074-0.0197623080743188
52114113.7975400858520.202459914147909
53108108.130873419185-0.130873419185412
54111107.9086511969633.0913488030368
55151141.575317863639.42468213637015
56159153.0197623080745.9802376919257
57158150.2016537752477.79834622475289
58148140.4642067525197.53579324748124
59138132.5180913556065.4819086443941
60137128.8930913556068.1069086443941
61136128.3244462472027.67555375279762
62133124.5466684694258.45333153057546
63126119.102224024986.8977759750199
64120114.8800018027585.11999819724213
65114109.2133351360914.7866648639088
66116108.9911129138697.00888708613102
67153142.65777958053610.3422204194644
68162154.102224024987.89777597501991
69161151.2841154921539.7158845078471
70149134.18369167398014.8163083260203
71139126.23757627706712.7624237229331
72135122.61257627706712.3874237229331
73130122.0439311686637.95606883133664
74127118.2661533908868.73384660911448
75122112.8217089464419.17829105355892
76117108.5994867242198.40051327578114
77112102.9328200575529.06717994244783
78113102.7105978353310.2894021646700
79149136.37726450199712.6227354980034
80157147.8217089464419.17829105355893
81157145.00360041361411.9963995863861
82147135.26615339088611.7338466091145
83137127.3200379939739.67996200602733
84132123.6950379939738.30496200602734
85125123.1263928855691.87360711443086
86123119.3486151077913.65138489220869
87117113.9041706633473.09582933665313
88114109.6819484411254.31805155887535
89111104.0152817744586.98471822554204
90112103.7930595522368.20694044776425
91144137.4597262189026.54027378109759
92150148.9041706633471.09582933665314
93149146.0860621305202.91393786948034
94134136.348615107791-2.34861510779131
95123128.402499710878-5.40249971087845
96116124.777499710878-8.77749971087844
97117124.208854602475-7.20885460247493
98111120.431076824697-9.43107682469709
99105114.986632380253-9.98663238025265
100102110.764410158030-8.76441015803043
10195105.097743491364-10.0977434913637
10293104.875521269142-11.8755212691415
103124138.542187935808-14.5421879358082
104130149.986632380253-19.9866323802526
105124147.168523847425-23.1685238474254
106115137.431076824697-22.4310768246971


Parameters (Session):
par1 = 1 ; par2 = Include Monthly Dummies ; par3 = Linear Trend ;
Parameters (R input):
par1 = 1 ; par2 = Include Monthly Dummies ; par3 = Linear Trend ;
R code (references can be found in the software module):
library(lattice)
par1 <- as.numeric(par1)
x <- t(y)
k <- length(x[1,])
n <- length(x[,1])
x1 <- cbind(x[,par1], x[,1:k!=par1])
mycolnames <- c(colnames(x)[par1], colnames(x)[1:k!=par1])
colnames(x1) <- mycolnames #colnames(x)[par1]
x <- x1
if (par3 == 'First Differences'){
x2 <- array(0, dim=c(n-1,k), dimnames=list(1:(n-1), paste('(1-B)',colnames(x),sep='')))
for (i in 1:n-1) {
for (j in 1:k) {
x2[i,j] <- x[i+1,j] - x[i,j]
}
}
x <- x2
}
if (par2 == 'Include Monthly Dummies'){
x2 <- array(0, dim=c(n,11), dimnames=list(1:n, paste('M', seq(1:11), sep ='')))
for (i in 1:11){
x2[seq(i,n,12),i] <- 1
}
x <- cbind(x, x2)
}
if (par2 == 'Include Quarterly Dummies'){
x2 <- array(0, dim=c(n,3), dimnames=list(1:n, paste('Q', seq(1:3), sep ='')))
for (i in 1:3){
x2[seq(i,n,4),i] <- 1
}
x <- cbind(x, x2)
}
k <- length(x[1,])
if (par3 == 'Linear Trend'){
x <- cbind(x, c(1:n))
colnames(x)[k+1] <- 't'
}
x
k <- length(x[1,])
df <- as.data.frame(x)
(mylm <- lm(df))
(mysum <- summary(mylm))
bitmap(file='test0.png')
plot(x[,1], type='l', main='Actuals and Interpolation', ylab='value of Actuals and Interpolation (dots)', xlab='time or index')
points(x[,1]-mysum$resid)
grid()
dev.off()
bitmap(file='test1.png')
plot(mysum$resid, type='b', pch=19, main='Residuals', ylab='value of Residuals', xlab='time or index')
grid()
dev.off()
bitmap(file='test2.png')
hist(mysum$resid, main='Residual Histogram', xlab='values of Residuals')
grid()
dev.off()
bitmap(file='test3.png')
densityplot(~mysum$resid,col='black',main='Residual Density Plot', xlab='values of Residuals')
dev.off()
bitmap(file='test4.png')
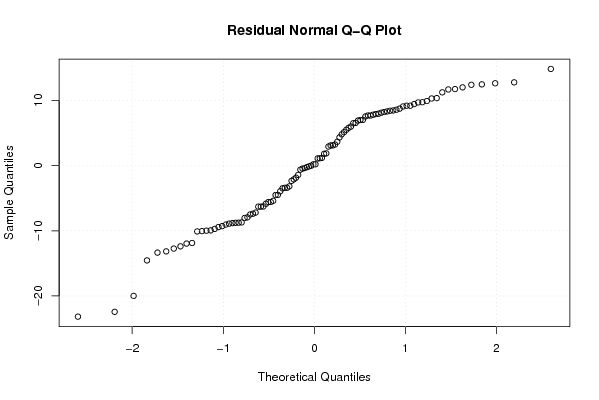
qqnorm(mysum$resid, main='Residual Normal Q-Q Plot')
grid()
dev.off()
(myerror <- as.ts(mysum$resid))
bitmap(file='test5.png')
dum <- cbind(lag(myerror,k=1),myerror)
dum
dum1 <- dum[2:length(myerror),]
dum1
z <- as.data.frame(dum1)
z
plot(z,main=paste('Residual Lag plot, lowess, and regression line'), ylab='values of Residuals', xlab='lagged values of Residuals')
lines(lowess(z))
abline(lm(z))
grid()
dev.off()
bitmap(file='test6.png')
acf(mysum$resid, lag.max=length(mysum$resid)/2, main='Residual Autocorrelation Function')
grid()
dev.off()
bitmap(file='test7.png')
pacf(mysum$resid, lag.max=length(mysum$resid)/2, main='Residual Partial Autocorrelation Function')
grid()
dev.off()
bitmap(file='test8.png')
opar <- par(mfrow = c(2,2), oma = c(0, 0, 1.1, 0))
plot(mylm, las = 1, sub='Residual Diagnostics')
par(opar)
dev.off()
load(file='createtable')
a<-table.start()
a<-table.row.start(a)
a<-table.element(a, 'Multiple Linear Regression - Estimated Regression Equation', 1, TRUE)
a<-table.row.end(a)
myeq <- colnames(x)[1]
myeq <- paste(myeq, '[t] = ', sep='')
for (i in 1:k){
if (mysum$coefficients[i,1] > 0) myeq <- paste(myeq, '+', '')
myeq <- paste(myeq, mysum$coefficients[i,1], sep=' ')
if (rownames(mysum$coefficients)[i] != '(Intercept)') {
myeq <- paste(myeq, rownames(mysum$coefficients)[i], sep='')
if (rownames(mysum$coefficients)[i] != 't') myeq <- paste(myeq, '[t]', sep='')
}
}
myeq <- paste(myeq, ' + e[t]')
a<-table.row.start(a)
a<-table.element(a, myeq)
a<-table.row.end(a)
a<-table.end(a)
table.save(a,file='mytable1.tab')
a<-table.start()
a<-table.row.start(a)
a<-table.element(a,hyperlink('ols1.htm','Multiple Linear Regression - Ordinary Least Squares',''), 6, TRUE)
a<-table.row.end(a)
a<-table.row.start(a)
a<-table.element(a,'Variable',header=TRUE)
a<-table.element(a,'Parameter',header=TRUE)
a<-table.element(a,'S.D.',header=TRUE)
a<-table.element(a,'T-STAT
H0: parameter = 0',header=TRUE)
a<-table.element(a,'2-tail p-value',header=TRUE)
a<-table.element(a,'1-tail p-value',header=TRUE)
a<-table.row.end(a)
for (i in 1:k){
a<-table.row.start(a)
a<-table.element(a,rownames(mysum$coefficients)[i],header=TRUE)
a<-table.element(a,mysum$coefficients[i,1])
a<-table.element(a, round(mysum$coefficients[i,2],6))
a<-table.element(a, round(mysum$coefficients[i,3],4))
a<-table.element(a, round(mysum$coefficients[i,4],6))
a<-table.element(a, round(mysum$coefficients[i,4]/2,6))
a<-table.row.end(a)
}
a<-table.end(a)
table.save(a,file='mytable2.tab')
a<-table.start()
a<-table.row.start(a)
a<-table.element(a, 'Multiple Linear Regression - Regression Statistics', 2, TRUE)
a<-table.row.end(a)
a<-table.row.start(a)
a<-table.element(a, 'Multiple R',1,TRUE)
a<-table.element(a, sqrt(mysum$r.squared))
a<-table.row.end(a)
a<-table.row.start(a)
a<-table.element(a, 'R-squared',1,TRUE)
a<-table.element(a, mysum$r.squared)
a<-table.row.end(a)
a<-table.row.start(a)
a<-table.element(a, 'Adjusted R-squared',1,TRUE)
a<-table.element(a, mysum$adj.r.squared)
a<-table.row.end(a)
a<-table.row.start(a)
a<-table.element(a, 'F-TEST (value)',1,TRUE)
a<-table.element(a, mysum$fstatistic[1])
a<-table.row.end(a)
a<-table.row.start(a)
a<-table.element(a, 'F-TEST (DF numerator)',1,TRUE)
a<-table.element(a, mysum$fstatistic[2])
a<-table.row.end(a)
a<-table.row.start(a)
a<-table.element(a, 'F-TEST (DF denominator)',1,TRUE)
a<-table.element(a, mysum$fstatistic[3])
a<-table.row.end(a)
a<-table.row.start(a)
a<-table.element(a, 'p-value',1,TRUE)
a<-table.element(a, 1-pf(mysum$fstatistic[1],mysum$fstatistic[2],mysum$fstatistic[3]))
a<-table.row.end(a)
a<-table.row.start(a)
a<-table.element(a, 'Multiple Linear Regression - Residual Statistics', 2, TRUE)
a<-table.row.end(a)
a<-table.row.start(a)
a<-table.element(a, 'Residual Standard Deviation',1,TRUE)
a<-table.element(a, mysum$sigma)
a<-table.row.end(a)
a<-table.row.start(a)
a<-table.element(a, 'Sum Squared Residuals',1,TRUE)
a<-table.element(a, sum(myerror*myerror))
a<-table.row.end(a)
a<-table.end(a)
table.save(a,file='mytable3.tab')
a<-table.start()
a<-table.row.start(a)
a<-table.element(a, 'Multiple Linear Regression - Actuals, Interpolation, and Residuals', 4, TRUE)
a<-table.row.end(a)
a<-table.row.start(a)
a<-table.element(a, 'Time or Index', 1, TRUE)
a<-table.element(a, 'Actuals', 1, TRUE)
a<-table.element(a, 'Interpolation
Forecast', 1, TRUE)
a<-table.element(a, 'Residuals
Prediction Error', 1, TRUE)
a<-table.row.end(a)
for (i in 1:n) {
a<-table.row.start(a)
a<-table.element(a,i, 1, TRUE)
a<-table.element(a,x[i])
a<-table.element(a,x[i]-mysum$resid[i])
a<-table.element(a,mysum$resid[i])
a<-table.row.end(a)
}
a<-table.end(a)
table.save(a,file='mytable4.tab')