Free Statistics

of Irreproducible Research!

Author's title

Author*Unverified author*
R Software Modulerwasp_multipleregression.wasp
Title produced by softwareMultiple Regression
Date of computationThu, 15 Nov 2007 03:55:11 -0700
Cite this page as followsStatistical Computations at FreeStatistics.org, Office for Research Development and Education, URL https://freestatistics.org/blog/index.php?v=date/2007/Nov/15/t1195124065g72zbsg9x19qf8p.htm/, Retrieved Sat, 04 May 2024 05:50:39 +0000
Statistical Computations at FreeStatistics.org, Office for Research Development and Education, URL https://freestatistics.org/blog/index.php?pk=5420, Retrieved Sat, 04 May 2024 05:50:39 +0000
QR Codes:

Original text written by user:
IsPrivate?No (this computation is public)
User-defined keywords
Estimated Impact234
Family? (F = Feedback message, R = changed R code, M = changed R Module, P = changed Parameters, D = changed Data)
-       [Multiple Regression] [] [2007-11-15 10:55:11] [2cdb7403ed3391afb545b8c0d20da37e] [Current]
Feedback Forum

Post a new message
Dataseries X:
513	0
503	0
471	0
471	0
476	0
475	0
470	0
461	0
455	0
456	0
517	0
525	0
523	1
519	1
509	1
512	1
519	1
517	1
510	1
509	1
501	1
507	1
569	1
580	1
578	1
565	1
547	1
555	1
562	1
561	1
555	1
544	1
537	1
543	1
594	1
611	1
613	1
611	1
594	1
595	1
591	1
589	1
584	1
573	1
567	1
569	1
621	1
629	1
628	1
612	1
595	1
597	1
593	1
590	1
580	1
574	1
573	1
573	1
620	1
626	1
620	1
588	1
566	1
557	1
561	1
549	1
532	1
526	1
511	1
499	1
555	1
565	1
542	1


Summary of compuational transaction
Raw Inputview raw input (R code)
Raw Outputview raw output of R engine
Computing time4 seconds
R Server'Gwilym Jenkins' @ 72.249.127.135

\begin{tabular}{lllllllll}
\hline
Summary of compuational transaction \tabularnewline
Raw Input & view raw input (R code)  \tabularnewline
Raw Output & view raw output of R engine  \tabularnewline
Computing time & 4 seconds \tabularnewline
R Server & 'Gwilym Jenkins' @ 72.249.127.135 \tabularnewline
\hline
\end{tabular}
%Source: https://freestatistics.org/blog/index.php?pk=5420&T=0

[TABLE]
[ROW][C]Summary of compuational transaction[/C][/ROW]
[ROW][C]Raw Input[/C][C]view raw input (R code) [/C][/ROW]
[ROW][C]Raw Output[/C][C]view raw output of R engine [/C][/ROW]
[ROW][C]Computing time[/C][C]4 seconds[/C][/ROW]
[ROW][C]R Server[/C][C]'Gwilym Jenkins' @ 72.249.127.135[/C][/ROW]
[/TABLE]
Source: https://freestatistics.org/blog/index.php?pk=5420&T=0

Globally Unique Identifier (entire table): ba.freestatistics.org/blog/index.php?pk=5420&T=0

As an alternative you can also use a QR Code:  

The GUIDs for individual cells are displayed in the table below:

Summary of compuational transaction
Raw Inputview raw input (R code)
Raw Outputview raw output of R engine
Computing time4 seconds
R Server'Gwilym Jenkins' @ 72.249.127.135


Multiple Linear Regression - Estimated Regression Equation
werk[t] = + 513.214322916667 + 58.9089843749999actbel[t] -13.6611436631941M1[t] -16.5647166418651M2[t] -36.5415783110118M3[t] -36.3517733134921M4[t] -34.4953016493056M5[t] -38.638829985119M6[t] -47.6156916542659M7[t] -55.5925533234127M8[t] -63.4027483258928M9[t] -63.5462766617063M10[t] -9.35647166418653M11[t] + 0.643528335813491t + e[t]

\begin{tabular}{lllllllll}
\hline
Multiple Linear Regression - Estimated Regression Equation \tabularnewline
werk[t] =  +  513.214322916667 +  58.9089843749999actbel[t] -13.6611436631941M1[t] -16.5647166418651M2[t] -36.5415783110118M3[t] -36.3517733134921M4[t] -34.4953016493056M5[t] -38.638829985119M6[t] -47.6156916542659M7[t] -55.5925533234127M8[t] -63.4027483258928M9[t] -63.5462766617063M10[t] -9.35647166418653M11[t] +  0.643528335813491t  + e[t] \tabularnewline
\hline
\end{tabular}
%Source: https://freestatistics.org/blog/index.php?pk=5420&T=1

[TABLE]
[ROW][C]Multiple Linear Regression - Estimated Regression Equation[/C][/ROW]
[ROW][C]werk[t] =  +  513.214322916667 +  58.9089843749999actbel[t] -13.6611436631941M1[t] -16.5647166418651M2[t] -36.5415783110118M3[t] -36.3517733134921M4[t] -34.4953016493056M5[t] -38.638829985119M6[t] -47.6156916542659M7[t] -55.5925533234127M8[t] -63.4027483258928M9[t] -63.5462766617063M10[t] -9.35647166418653M11[t] +  0.643528335813491t  + e[t][/C][/ROW]
[/TABLE]
Source: https://freestatistics.org/blog/index.php?pk=5420&T=1

Globally Unique Identifier (entire table): ba.freestatistics.org/blog/index.php?pk=5420&T=1

As an alternative you can also use a QR Code:  

The GUIDs for individual cells are displayed in the table below:

Multiple Linear Regression - Estimated Regression Equation
werk[t] = + 513.214322916667 + 58.9089843749999actbel[t] -13.6611436631941M1[t] -16.5647166418651M2[t] -36.5415783110118M3[t] -36.3517733134921M4[t] -34.4953016493056M5[t] -38.638829985119M6[t] -47.6156916542659M7[t] -55.5925533234127M8[t] -63.4027483258928M9[t] -63.5462766617063M10[t] -9.35647166418653M11[t] + 0.643528335813491t + e[t]


Multiple Linear Regression - Ordinary Least Squares
VariableParameterS.D.T-STATH0: parameter = 02-tail p-value1-tail p-value
(Intercept)513.21432291666714.15746336.250400
actbel58.908984374999911.914534.94437e-063e-06
M1-13.661143663194116.02044-0.85270.3972560.198628
M2-16.564716641865116.708256-0.99140.3255350.162767
M3-36.541578311011816.682756-2.19040.0324610.01623
M4-36.351773313492116.659907-2.1820.0331050.016552
M5-34.495301649305616.63972-2.07310.0425420.021271
M6-38.63882998511916.622205-2.32450.0235590.011779
M7-47.615691654265916.60737-2.86710.0057350.002867
M8-55.592553323412716.595223-3.34990.0014140.000707
M9-63.402748325892816.585769-3.82270.000320.00016
M10-63.546276661706316.579012-3.83290.000310.000155
M11-9.3564716641865316.574957-0.56450.5745580.287279
t0.6435283358134910.2116943.03990.0035250.001763

\begin{tabular}{lllllllll}
\hline
Multiple Linear Regression - Ordinary Least Squares \tabularnewline
Variable & Parameter & S.D. & T-STATH0: parameter = 0 & 2-tail p-value & 1-tail p-value \tabularnewline
(Intercept) & 513.214322916667 & 14.157463 & 36.2504 & 0 & 0 \tabularnewline
actbel & 58.9089843749999 & 11.91453 & 4.9443 & 7e-06 & 3e-06 \tabularnewline
M1 & -13.6611436631941 & 16.02044 & -0.8527 & 0.397256 & 0.198628 \tabularnewline
M2 & -16.5647166418651 & 16.708256 & -0.9914 & 0.325535 & 0.162767 \tabularnewline
M3 & -36.5415783110118 & 16.682756 & -2.1904 & 0.032461 & 0.01623 \tabularnewline
M4 & -36.3517733134921 & 16.659907 & -2.182 & 0.033105 & 0.016552 \tabularnewline
M5 & -34.4953016493056 & 16.63972 & -2.0731 & 0.042542 & 0.021271 \tabularnewline
M6 & -38.638829985119 & 16.622205 & -2.3245 & 0.023559 & 0.011779 \tabularnewline
M7 & -47.6156916542659 & 16.60737 & -2.8671 & 0.005735 & 0.002867 \tabularnewline
M8 & -55.5925533234127 & 16.595223 & -3.3499 & 0.001414 & 0.000707 \tabularnewline
M9 & -63.4027483258928 & 16.585769 & -3.8227 & 0.00032 & 0.00016 \tabularnewline
M10 & -63.5462766617063 & 16.579012 & -3.8329 & 0.00031 & 0.000155 \tabularnewline
M11 & -9.35647166418653 & 16.574957 & -0.5645 & 0.574558 & 0.287279 \tabularnewline
t & 0.643528335813491 & 0.211694 & 3.0399 & 0.003525 & 0.001763 \tabularnewline
\hline
\end{tabular}
%Source: https://freestatistics.org/blog/index.php?pk=5420&T=2

[TABLE]
[ROW][C]Multiple Linear Regression - Ordinary Least Squares[/C][/ROW]
[ROW][C]Variable[/C][C]Parameter[/C][C]S.D.[/C][C]T-STATH0: parameter = 0[/C][C]2-tail p-value[/C][C]1-tail p-value[/C][/ROW]
[ROW][C](Intercept)[/C][C]513.214322916667[/C][C]14.157463[/C][C]36.2504[/C][C]0[/C][C]0[/C][/ROW]
[ROW][C]actbel[/C][C]58.9089843749999[/C][C]11.91453[/C][C]4.9443[/C][C]7e-06[/C][C]3e-06[/C][/ROW]
[ROW][C]M1[/C][C]-13.6611436631941[/C][C]16.02044[/C][C]-0.8527[/C][C]0.397256[/C][C]0.198628[/C][/ROW]
[ROW][C]M2[/C][C]-16.5647166418651[/C][C]16.708256[/C][C]-0.9914[/C][C]0.325535[/C][C]0.162767[/C][/ROW]
[ROW][C]M3[/C][C]-36.5415783110118[/C][C]16.682756[/C][C]-2.1904[/C][C]0.032461[/C][C]0.01623[/C][/ROW]
[ROW][C]M4[/C][C]-36.3517733134921[/C][C]16.659907[/C][C]-2.182[/C][C]0.033105[/C][C]0.016552[/C][/ROW]
[ROW][C]M5[/C][C]-34.4953016493056[/C][C]16.63972[/C][C]-2.0731[/C][C]0.042542[/C][C]0.021271[/C][/ROW]
[ROW][C]M6[/C][C]-38.638829985119[/C][C]16.622205[/C][C]-2.3245[/C][C]0.023559[/C][C]0.011779[/C][/ROW]
[ROW][C]M7[/C][C]-47.6156916542659[/C][C]16.60737[/C][C]-2.8671[/C][C]0.005735[/C][C]0.002867[/C][/ROW]
[ROW][C]M8[/C][C]-55.5925533234127[/C][C]16.595223[/C][C]-3.3499[/C][C]0.001414[/C][C]0.000707[/C][/ROW]
[ROW][C]M9[/C][C]-63.4027483258928[/C][C]16.585769[/C][C]-3.8227[/C][C]0.00032[/C][C]0.00016[/C][/ROW]
[ROW][C]M10[/C][C]-63.5462766617063[/C][C]16.579012[/C][C]-3.8329[/C][C]0.00031[/C][C]0.000155[/C][/ROW]
[ROW][C]M11[/C][C]-9.35647166418653[/C][C]16.574957[/C][C]-0.5645[/C][C]0.574558[/C][C]0.287279[/C][/ROW]
[ROW][C]t[/C][C]0.643528335813491[/C][C]0.211694[/C][C]3.0399[/C][C]0.003525[/C][C]0.001763[/C][/ROW]
[/TABLE]
Source: https://freestatistics.org/blog/index.php?pk=5420&T=2

Globally Unique Identifier (entire table): ba.freestatistics.org/blog/index.php?pk=5420&T=2

As an alternative you can also use a QR Code:  

The GUIDs for individual cells are displayed in the table below:

Multiple Linear Regression - Ordinary Least Squares
VariableParameterS.D.T-STATH0: parameter = 02-tail p-value1-tail p-value
(Intercept)513.21432291666714.15746336.250400
actbel58.908984374999911.914534.94437e-063e-06
M1-13.661143663194116.02044-0.85270.3972560.198628
M2-16.564716641865116.708256-0.99140.3255350.162767
M3-36.541578311011816.682756-2.19040.0324610.01623
M4-36.351773313492116.659907-2.1820.0331050.016552
M5-34.495301649305616.63972-2.07310.0425420.021271
M6-38.63882998511916.622205-2.32450.0235590.011779
M7-47.615691654265916.60737-2.86710.0057350.002867
M8-55.592553323412716.595223-3.34990.0014140.000707
M9-63.402748325892816.585769-3.82270.000320.00016
M10-63.546276661706316.579012-3.83290.000310.000155
M11-9.3564716641865316.574957-0.56450.5745580.287279
t0.6435283358134910.2116943.03990.0035250.001763


Multiple Linear Regression - Regression Statistics
Multiple R0.828565341301244
R-squared0.686520524805647
Adjusted R-squared0.61744877603401
F-TEST (value)9.93923763354248
F-TEST (DF numerator)13
F-TEST (DF denominator)59
p-value1.40640277201953e-10
Multiple Linear Regression - Residual Statistics
Residual Standard Deviation28.7063265493221
Sum Squared Residuals48619.1378534227

\begin{tabular}{lllllllll}
\hline
Multiple Linear Regression - Regression Statistics \tabularnewline
Multiple R & 0.828565341301244 \tabularnewline
R-squared & 0.686520524805647 \tabularnewline
Adjusted R-squared & 0.61744877603401 \tabularnewline
F-TEST (value) & 9.93923763354248 \tabularnewline
F-TEST (DF numerator) & 13 \tabularnewline
F-TEST (DF denominator) & 59 \tabularnewline
p-value & 1.40640277201953e-10 \tabularnewline
Multiple Linear Regression - Residual Statistics \tabularnewline
Residual Standard Deviation & 28.7063265493221 \tabularnewline
Sum Squared Residuals & 48619.1378534227 \tabularnewline
\hline
\end{tabular}
%Source: https://freestatistics.org/blog/index.php?pk=5420&T=3

[TABLE]
[ROW][C]Multiple Linear Regression - Regression Statistics[/C][/ROW]
[ROW][C]Multiple R[/C][C]0.828565341301244[/C][/ROW]
[ROW][C]R-squared[/C][C]0.686520524805647[/C][/ROW]
[ROW][C]Adjusted R-squared[/C][C]0.61744877603401[/C][/ROW]
[ROW][C]F-TEST (value)[/C][C]9.93923763354248[/C][/ROW]
[ROW][C]F-TEST (DF numerator)[/C][C]13[/C][/ROW]
[ROW][C]F-TEST (DF denominator)[/C][C]59[/C][/ROW]
[ROW][C]p-value[/C][C]1.40640277201953e-10[/C][/ROW]
[ROW][C]Multiple Linear Regression - Residual Statistics[/C][/ROW]
[ROW][C]Residual Standard Deviation[/C][C]28.7063265493221[/C][/ROW]
[ROW][C]Sum Squared Residuals[/C][C]48619.1378534227[/C][/ROW]
[/TABLE]
Source: https://freestatistics.org/blog/index.php?pk=5420&T=3

Globally Unique Identifier (entire table): ba.freestatistics.org/blog/index.php?pk=5420&T=3

As an alternative you can also use a QR Code:  

The GUIDs for individual cells are displayed in the table below:

Multiple Linear Regression - Regression Statistics
Multiple R0.828565341301244
R-squared0.686520524805647
Adjusted R-squared0.61744877603401
F-TEST (value)9.93923763354248
F-TEST (DF numerator)13
F-TEST (DF denominator)59
p-value1.40640277201953e-10
Multiple Linear Regression - Residual Statistics
Residual Standard Deviation28.7063265493221
Sum Squared Residuals48619.1378534227


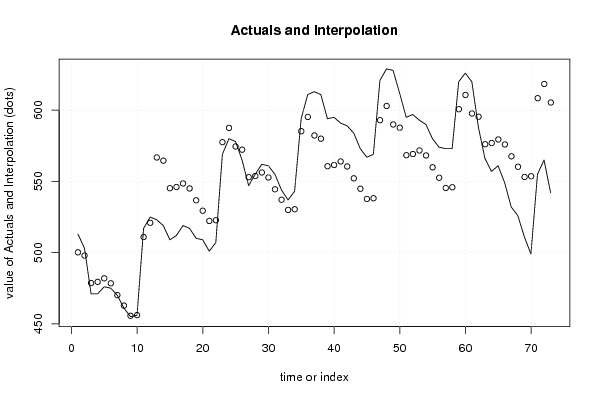
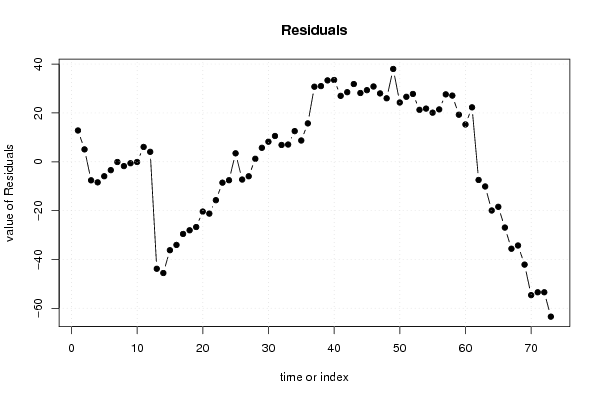
Multiple Linear Regression - Actuals, Interpolation, and Residuals
Time or IndexActualsInterpolationForecastResidualsPrediction Error
1513500.19670758928412.8032924107156
2503497.9366629464295.0633370535714
3471478.603329613096-7.60332961309554
4471479.436662946429-8.43666294642857
5476481.936662946429-5.9366629464289
6475478.436662946429-3.43666294642865
7470470.103329613095-0.103329613095266
8461462.769996279762-1.76999627976213
9455455.603329613095-0.603329613095288
10456456.103329613095-0.103329613095402
11517510.9366629464296.06333705357132
12525520.9366629464294.06333705357131
13523566.828031994048-43.8280319940479
14519564.56798735119-45.5679873511904
15509545.234654017857-36.2346540178571
16512546.06798735119-34.0679873511905
17519548.56798735119-29.5679873511904
18517545.06798735119-28.0679873511905
19510536.734654017857-26.7346540178572
20509529.401320684524-20.4013206845238
21501522.234654017857-21.2346540178571
22507522.734654017857-15.7346540178571
23569577.56798735119-8.56798735119046
24580587.56798735119-7.56798735119044
25578574.550372023813.44962797619026
26565572.290327380952-7.2903273809524
27547552.956994047619-5.95699404761901
28555553.7903273809521.20967261904762
29562556.2903273809525.70967261904767
30561552.7903273809528.20967261904763
31555544.45699404761910.5430059523810
32544537.1236607142866.87633928571433
33537529.9569940476197.04300595238096
34543530.45699404761912.543005952381
35594585.2903273809528.70967261904764
36611595.29032738095215.7096726190477
37613582.27271205357230.7272879464284
38611580.01266741071430.9873325892857
39594560.67933407738133.3206659226191
40595561.51266741071433.4873325892857
41591564.01266741071426.9873325892858
42589560.51266741071428.4873325892857
43584552.17933407738131.8206659226190
44573544.84600074404828.1539992559524
45567537.67933407738129.3206659226190
46569538.17933407738130.8206659226191
47621593.01266741071427.9873325892857
48629603.01266741071425.9873325892858
49628589.99505208333438.0049479166665
50612587.73500744047624.2649925595238
51595568.40167410714326.5983258928572
52597569.23500744047627.7649925595238
53593571.73500744047621.2649925595239
54590568.23500744047621.7649925595238
55580559.90167410714320.0983258928572
56574552.5683407738121.4316592261905
57573545.40167410714327.5983258928571
58573545.90167410714327.0983258928572
59620600.73500744047619.2649925595238
60626610.73500744047615.2649925595239
61620597.71739211309522.2826078869046
62588595.457347470238-7.4573474702381
63566576.124014136905-10.1240141369047
64557576.957347470238-19.9573474702381
65561579.457347470238-18.4573474702380
66549575.957347470238-26.9573474702381
67532567.624014136905-35.6240141369047
68526560.290680803571-34.2906808035714
69511553.124014136905-42.1240141369047
70499553.624014136905-54.6240141369047
71555608.457347470238-53.457347470238
72565618.457347470238-53.457347470238
73542605.439732142857-63.4397321428573

\begin{tabular}{lllllllll}
\hline
Multiple Linear Regression - Actuals, Interpolation, and Residuals \tabularnewline
Time or Index & Actuals & InterpolationForecast & ResidualsPrediction Error \tabularnewline
1 & 513 & 500.196707589284 & 12.8032924107156 \tabularnewline
2 & 503 & 497.936662946429 & 5.0633370535714 \tabularnewline
3 & 471 & 478.603329613096 & -7.60332961309554 \tabularnewline
4 & 471 & 479.436662946429 & -8.43666294642857 \tabularnewline
5 & 476 & 481.936662946429 & -5.9366629464289 \tabularnewline
6 & 475 & 478.436662946429 & -3.43666294642865 \tabularnewline
7 & 470 & 470.103329613095 & -0.103329613095266 \tabularnewline
8 & 461 & 462.769996279762 & -1.76999627976213 \tabularnewline
9 & 455 & 455.603329613095 & -0.603329613095288 \tabularnewline
10 & 456 & 456.103329613095 & -0.103329613095402 \tabularnewline
11 & 517 & 510.936662946429 & 6.06333705357132 \tabularnewline
12 & 525 & 520.936662946429 & 4.06333705357131 \tabularnewline
13 & 523 & 566.828031994048 & -43.8280319940479 \tabularnewline
14 & 519 & 564.56798735119 & -45.5679873511904 \tabularnewline
15 & 509 & 545.234654017857 & -36.2346540178571 \tabularnewline
16 & 512 & 546.06798735119 & -34.0679873511905 \tabularnewline
17 & 519 & 548.56798735119 & -29.5679873511904 \tabularnewline
18 & 517 & 545.06798735119 & -28.0679873511905 \tabularnewline
19 & 510 & 536.734654017857 & -26.7346540178572 \tabularnewline
20 & 509 & 529.401320684524 & -20.4013206845238 \tabularnewline
21 & 501 & 522.234654017857 & -21.2346540178571 \tabularnewline
22 & 507 & 522.734654017857 & -15.7346540178571 \tabularnewline
23 & 569 & 577.56798735119 & -8.56798735119046 \tabularnewline
24 & 580 & 587.56798735119 & -7.56798735119044 \tabularnewline
25 & 578 & 574.55037202381 & 3.44962797619026 \tabularnewline
26 & 565 & 572.290327380952 & -7.2903273809524 \tabularnewline
27 & 547 & 552.956994047619 & -5.95699404761901 \tabularnewline
28 & 555 & 553.790327380952 & 1.20967261904762 \tabularnewline
29 & 562 & 556.290327380952 & 5.70967261904767 \tabularnewline
30 & 561 & 552.790327380952 & 8.20967261904763 \tabularnewline
31 & 555 & 544.456994047619 & 10.5430059523810 \tabularnewline
32 & 544 & 537.123660714286 & 6.87633928571433 \tabularnewline
33 & 537 & 529.956994047619 & 7.04300595238096 \tabularnewline
34 & 543 & 530.456994047619 & 12.543005952381 \tabularnewline
35 & 594 & 585.290327380952 & 8.70967261904764 \tabularnewline
36 & 611 & 595.290327380952 & 15.7096726190477 \tabularnewline
37 & 613 & 582.272712053572 & 30.7272879464284 \tabularnewline
38 & 611 & 580.012667410714 & 30.9873325892857 \tabularnewline
39 & 594 & 560.679334077381 & 33.3206659226191 \tabularnewline
40 & 595 & 561.512667410714 & 33.4873325892857 \tabularnewline
41 & 591 & 564.012667410714 & 26.9873325892858 \tabularnewline
42 & 589 & 560.512667410714 & 28.4873325892857 \tabularnewline
43 & 584 & 552.179334077381 & 31.8206659226190 \tabularnewline
44 & 573 & 544.846000744048 & 28.1539992559524 \tabularnewline
45 & 567 & 537.679334077381 & 29.3206659226190 \tabularnewline
46 & 569 & 538.179334077381 & 30.8206659226191 \tabularnewline
47 & 621 & 593.012667410714 & 27.9873325892857 \tabularnewline
48 & 629 & 603.012667410714 & 25.9873325892858 \tabularnewline
49 & 628 & 589.995052083334 & 38.0049479166665 \tabularnewline
50 & 612 & 587.735007440476 & 24.2649925595238 \tabularnewline
51 & 595 & 568.401674107143 & 26.5983258928572 \tabularnewline
52 & 597 & 569.235007440476 & 27.7649925595238 \tabularnewline
53 & 593 & 571.735007440476 & 21.2649925595239 \tabularnewline
54 & 590 & 568.235007440476 & 21.7649925595238 \tabularnewline
55 & 580 & 559.901674107143 & 20.0983258928572 \tabularnewline
56 & 574 & 552.56834077381 & 21.4316592261905 \tabularnewline
57 & 573 & 545.401674107143 & 27.5983258928571 \tabularnewline
58 & 573 & 545.901674107143 & 27.0983258928572 \tabularnewline
59 & 620 & 600.735007440476 & 19.2649925595238 \tabularnewline
60 & 626 & 610.735007440476 & 15.2649925595239 \tabularnewline
61 & 620 & 597.717392113095 & 22.2826078869046 \tabularnewline
62 & 588 & 595.457347470238 & -7.4573474702381 \tabularnewline
63 & 566 & 576.124014136905 & -10.1240141369047 \tabularnewline
64 & 557 & 576.957347470238 & -19.9573474702381 \tabularnewline
65 & 561 & 579.457347470238 & -18.4573474702380 \tabularnewline
66 & 549 & 575.957347470238 & -26.9573474702381 \tabularnewline
67 & 532 & 567.624014136905 & -35.6240141369047 \tabularnewline
68 & 526 & 560.290680803571 & -34.2906808035714 \tabularnewline
69 & 511 & 553.124014136905 & -42.1240141369047 \tabularnewline
70 & 499 & 553.624014136905 & -54.6240141369047 \tabularnewline
71 & 555 & 608.457347470238 & -53.457347470238 \tabularnewline
72 & 565 & 618.457347470238 & -53.457347470238 \tabularnewline
73 & 542 & 605.439732142857 & -63.4397321428573 \tabularnewline
\hline
\end{tabular}
%Source: https://freestatistics.org/blog/index.php?pk=5420&T=4

[TABLE]
[ROW][C]Multiple Linear Regression - Actuals, Interpolation, and Residuals[/C][/ROW]
[ROW][C]Time or Index[/C][C]Actuals[/C][C]InterpolationForecast[/C][C]ResidualsPrediction Error[/C][/ROW]
[ROW][C]1[/C][C]513[/C][C]500.196707589284[/C][C]12.8032924107156[/C][/ROW]
[ROW][C]2[/C][C]503[/C][C]497.936662946429[/C][C]5.0633370535714[/C][/ROW]
[ROW][C]3[/C][C]471[/C][C]478.603329613096[/C][C]-7.60332961309554[/C][/ROW]
[ROW][C]4[/C][C]471[/C][C]479.436662946429[/C][C]-8.43666294642857[/C][/ROW]
[ROW][C]5[/C][C]476[/C][C]481.936662946429[/C][C]-5.9366629464289[/C][/ROW]
[ROW][C]6[/C][C]475[/C][C]478.436662946429[/C][C]-3.43666294642865[/C][/ROW]
[ROW][C]7[/C][C]470[/C][C]470.103329613095[/C][C]-0.103329613095266[/C][/ROW]
[ROW][C]8[/C][C]461[/C][C]462.769996279762[/C][C]-1.76999627976213[/C][/ROW]
[ROW][C]9[/C][C]455[/C][C]455.603329613095[/C][C]-0.603329613095288[/C][/ROW]
[ROW][C]10[/C][C]456[/C][C]456.103329613095[/C][C]-0.103329613095402[/C][/ROW]
[ROW][C]11[/C][C]517[/C][C]510.936662946429[/C][C]6.06333705357132[/C][/ROW]
[ROW][C]12[/C][C]525[/C][C]520.936662946429[/C][C]4.06333705357131[/C][/ROW]
[ROW][C]13[/C][C]523[/C][C]566.828031994048[/C][C]-43.8280319940479[/C][/ROW]
[ROW][C]14[/C][C]519[/C][C]564.56798735119[/C][C]-45.5679873511904[/C][/ROW]
[ROW][C]15[/C][C]509[/C][C]545.234654017857[/C][C]-36.2346540178571[/C][/ROW]
[ROW][C]16[/C][C]512[/C][C]546.06798735119[/C][C]-34.0679873511905[/C][/ROW]
[ROW][C]17[/C][C]519[/C][C]548.56798735119[/C][C]-29.5679873511904[/C][/ROW]
[ROW][C]18[/C][C]517[/C][C]545.06798735119[/C][C]-28.0679873511905[/C][/ROW]
[ROW][C]19[/C][C]510[/C][C]536.734654017857[/C][C]-26.7346540178572[/C][/ROW]
[ROW][C]20[/C][C]509[/C][C]529.401320684524[/C][C]-20.4013206845238[/C][/ROW]
[ROW][C]21[/C][C]501[/C][C]522.234654017857[/C][C]-21.2346540178571[/C][/ROW]
[ROW][C]22[/C][C]507[/C][C]522.734654017857[/C][C]-15.7346540178571[/C][/ROW]
[ROW][C]23[/C][C]569[/C][C]577.56798735119[/C][C]-8.56798735119046[/C][/ROW]
[ROW][C]24[/C][C]580[/C][C]587.56798735119[/C][C]-7.56798735119044[/C][/ROW]
[ROW][C]25[/C][C]578[/C][C]574.55037202381[/C][C]3.44962797619026[/C][/ROW]
[ROW][C]26[/C][C]565[/C][C]572.290327380952[/C][C]-7.2903273809524[/C][/ROW]
[ROW][C]27[/C][C]547[/C][C]552.956994047619[/C][C]-5.95699404761901[/C][/ROW]
[ROW][C]28[/C][C]555[/C][C]553.790327380952[/C][C]1.20967261904762[/C][/ROW]
[ROW][C]29[/C][C]562[/C][C]556.290327380952[/C][C]5.70967261904767[/C][/ROW]
[ROW][C]30[/C][C]561[/C][C]552.790327380952[/C][C]8.20967261904763[/C][/ROW]
[ROW][C]31[/C][C]555[/C][C]544.456994047619[/C][C]10.5430059523810[/C][/ROW]
[ROW][C]32[/C][C]544[/C][C]537.123660714286[/C][C]6.87633928571433[/C][/ROW]
[ROW][C]33[/C][C]537[/C][C]529.956994047619[/C][C]7.04300595238096[/C][/ROW]
[ROW][C]34[/C][C]543[/C][C]530.456994047619[/C][C]12.543005952381[/C][/ROW]
[ROW][C]35[/C][C]594[/C][C]585.290327380952[/C][C]8.70967261904764[/C][/ROW]
[ROW][C]36[/C][C]611[/C][C]595.290327380952[/C][C]15.7096726190477[/C][/ROW]
[ROW][C]37[/C][C]613[/C][C]582.272712053572[/C][C]30.7272879464284[/C][/ROW]
[ROW][C]38[/C][C]611[/C][C]580.012667410714[/C][C]30.9873325892857[/C][/ROW]
[ROW][C]39[/C][C]594[/C][C]560.679334077381[/C][C]33.3206659226191[/C][/ROW]
[ROW][C]40[/C][C]595[/C][C]561.512667410714[/C][C]33.4873325892857[/C][/ROW]
[ROW][C]41[/C][C]591[/C][C]564.012667410714[/C][C]26.9873325892858[/C][/ROW]
[ROW][C]42[/C][C]589[/C][C]560.512667410714[/C][C]28.4873325892857[/C][/ROW]
[ROW][C]43[/C][C]584[/C][C]552.179334077381[/C][C]31.8206659226190[/C][/ROW]
[ROW][C]44[/C][C]573[/C][C]544.846000744048[/C][C]28.1539992559524[/C][/ROW]
[ROW][C]45[/C][C]567[/C][C]537.679334077381[/C][C]29.3206659226190[/C][/ROW]
[ROW][C]46[/C][C]569[/C][C]538.179334077381[/C][C]30.8206659226191[/C][/ROW]
[ROW][C]47[/C][C]621[/C][C]593.012667410714[/C][C]27.9873325892857[/C][/ROW]
[ROW][C]48[/C][C]629[/C][C]603.012667410714[/C][C]25.9873325892858[/C][/ROW]
[ROW][C]49[/C][C]628[/C][C]589.995052083334[/C][C]38.0049479166665[/C][/ROW]
[ROW][C]50[/C][C]612[/C][C]587.735007440476[/C][C]24.2649925595238[/C][/ROW]
[ROW][C]51[/C][C]595[/C][C]568.401674107143[/C][C]26.5983258928572[/C][/ROW]
[ROW][C]52[/C][C]597[/C][C]569.235007440476[/C][C]27.7649925595238[/C][/ROW]
[ROW][C]53[/C][C]593[/C][C]571.735007440476[/C][C]21.2649925595239[/C][/ROW]
[ROW][C]54[/C][C]590[/C][C]568.235007440476[/C][C]21.7649925595238[/C][/ROW]
[ROW][C]55[/C][C]580[/C][C]559.901674107143[/C][C]20.0983258928572[/C][/ROW]
[ROW][C]56[/C][C]574[/C][C]552.56834077381[/C][C]21.4316592261905[/C][/ROW]
[ROW][C]57[/C][C]573[/C][C]545.401674107143[/C][C]27.5983258928571[/C][/ROW]
[ROW][C]58[/C][C]573[/C][C]545.901674107143[/C][C]27.0983258928572[/C][/ROW]
[ROW][C]59[/C][C]620[/C][C]600.735007440476[/C][C]19.2649925595238[/C][/ROW]
[ROW][C]60[/C][C]626[/C][C]610.735007440476[/C][C]15.2649925595239[/C][/ROW]
[ROW][C]61[/C][C]620[/C][C]597.717392113095[/C][C]22.2826078869046[/C][/ROW]
[ROW][C]62[/C][C]588[/C][C]595.457347470238[/C][C]-7.4573474702381[/C][/ROW]
[ROW][C]63[/C][C]566[/C][C]576.124014136905[/C][C]-10.1240141369047[/C][/ROW]
[ROW][C]64[/C][C]557[/C][C]576.957347470238[/C][C]-19.9573474702381[/C][/ROW]
[ROW][C]65[/C][C]561[/C][C]579.457347470238[/C][C]-18.4573474702380[/C][/ROW]
[ROW][C]66[/C][C]549[/C][C]575.957347470238[/C][C]-26.9573474702381[/C][/ROW]
[ROW][C]67[/C][C]532[/C][C]567.624014136905[/C][C]-35.6240141369047[/C][/ROW]
[ROW][C]68[/C][C]526[/C][C]560.290680803571[/C][C]-34.2906808035714[/C][/ROW]
[ROW][C]69[/C][C]511[/C][C]553.124014136905[/C][C]-42.1240141369047[/C][/ROW]
[ROW][C]70[/C][C]499[/C][C]553.624014136905[/C][C]-54.6240141369047[/C][/ROW]
[ROW][C]71[/C][C]555[/C][C]608.457347470238[/C][C]-53.457347470238[/C][/ROW]
[ROW][C]72[/C][C]565[/C][C]618.457347470238[/C][C]-53.457347470238[/C][/ROW]
[ROW][C]73[/C][C]542[/C][C]605.439732142857[/C][C]-63.4397321428573[/C][/ROW]
[/TABLE]
Source: https://freestatistics.org/blog/index.php?pk=5420&T=4

Globally Unique Identifier (entire table): ba.freestatistics.org/blog/index.php?pk=5420&T=4

As an alternative you can also use a QR Code:  

The GUIDs for individual cells are displayed in the table below:

Multiple Linear Regression - Actuals, Interpolation, and Residuals
Time or IndexActualsInterpolationForecastResidualsPrediction Error
1513500.19670758928412.8032924107156
2503497.9366629464295.0633370535714
3471478.603329613096-7.60332961309554
4471479.436662946429-8.43666294642857
5476481.936662946429-5.9366629464289
6475478.436662946429-3.43666294642865
7470470.103329613095-0.103329613095266
8461462.769996279762-1.76999627976213
9455455.603329613095-0.603329613095288
10456456.103329613095-0.103329613095402
11517510.9366629464296.06333705357132
12525520.9366629464294.06333705357131
13523566.828031994048-43.8280319940479
14519564.56798735119-45.5679873511904
15509545.234654017857-36.2346540178571
16512546.06798735119-34.0679873511905
17519548.56798735119-29.5679873511904
18517545.06798735119-28.0679873511905
19510536.734654017857-26.7346540178572
20509529.401320684524-20.4013206845238
21501522.234654017857-21.2346540178571
22507522.734654017857-15.7346540178571
23569577.56798735119-8.56798735119046
24580587.56798735119-7.56798735119044
25578574.550372023813.44962797619026
26565572.290327380952-7.2903273809524
27547552.956994047619-5.95699404761901
28555553.7903273809521.20967261904762
29562556.2903273809525.70967261904767
30561552.7903273809528.20967261904763
31555544.45699404761910.5430059523810
32544537.1236607142866.87633928571433
33537529.9569940476197.04300595238096
34543530.45699404761912.543005952381
35594585.2903273809528.70967261904764
36611595.29032738095215.7096726190477
37613582.27271205357230.7272879464284
38611580.01266741071430.9873325892857
39594560.67933407738133.3206659226191
40595561.51266741071433.4873325892857
41591564.01266741071426.9873325892858
42589560.51266741071428.4873325892857
43584552.17933407738131.8206659226190
44573544.84600074404828.1539992559524
45567537.67933407738129.3206659226190
46569538.17933407738130.8206659226191
47621593.01266741071427.9873325892857
48629603.01266741071425.9873325892858
49628589.99505208333438.0049479166665
50612587.73500744047624.2649925595238
51595568.40167410714326.5983258928572
52597569.23500744047627.7649925595238
53593571.73500744047621.2649925595239
54590568.23500744047621.7649925595238
55580559.90167410714320.0983258928572
56574552.5683407738121.4316592261905
57573545.40167410714327.5983258928571
58573545.90167410714327.0983258928572
59620600.73500744047619.2649925595238
60626610.73500744047615.2649925595239
61620597.71739211309522.2826078869046
62588595.457347470238-7.4573474702381
63566576.124014136905-10.1240141369047
64557576.957347470238-19.9573474702381
65561579.457347470238-18.4573474702380
66549575.957347470238-26.9573474702381
67532567.624014136905-35.6240141369047
68526560.290680803571-34.2906808035714
69511553.124014136905-42.1240141369047
70499553.624014136905-54.6240141369047
71555608.457347470238-53.457347470238
72565618.457347470238-53.457347470238
73542605.439732142857-63.4397321428573


Parameters (Session):
par1 = 1 ; par2 = Include Monthly Dummies ; par3 = Linear Trend ;
Parameters (R input):
par1 = 1 ; par2 = Include Monthly Dummies ; par3 = Linear Trend ;
R code (references can be found in the software module):
library(lattice)
par1 <- as.numeric(par1)
x <- t(y)
k <- length(x[1,])
n <- length(x[,1])
x1 <- cbind(x[,par1], x[,1:k!=par1])
mycolnames <- c(colnames(x)[par1], colnames(x)[1:k!=par1])
colnames(x1) <- mycolnames #colnames(x)[par1]
x <- x1
if (par3 == 'First Differences'){
x2 <- array(0, dim=c(n-1,k), dimnames=list(1:(n-1), paste('(1-B)',colnames(x),sep='')))
for (i in 1:n-1) {
for (j in 1:k) {
x2[i,j] <- x[i+1,j] - x[i,j]
}
}
x <- x2
}
if (par2 == 'Include Monthly Dummies'){
x2 <- array(0, dim=c(n,11), dimnames=list(1:n, paste('M', seq(1:11), sep ='')))
for (i in 1:11){
x2[seq(i,n,12),i] <- 1
}
x <- cbind(x, x2)
}
if (par2 == 'Include Quarterly Dummies'){
x2 <- array(0, dim=c(n,3), dimnames=list(1:n, paste('Q', seq(1:3), sep ='')))
for (i in 1:3){
x2[seq(i,n,4),i] <- 1
}
x <- cbind(x, x2)
}
k <- length(x[1,])
if (par3 == 'Linear Trend'){
x <- cbind(x, c(1:n))
colnames(x)[k+1] <- 't'
}
x
k <- length(x[1,])
df <- as.data.frame(x)
(mylm <- lm(df))
(mysum <- summary(mylm))
bitmap(file='test0.png')
plot(x[,1], type='l', main='Actuals and Interpolation', ylab='value of Actuals and Interpolation (dots)', xlab='time or index')
points(x[,1]-mysum$resid)
grid()
dev.off()
bitmap(file='test1.png')
plot(mysum$resid, type='b', pch=19, main='Residuals', ylab='value of Residuals', xlab='time or index')
grid()
dev.off()
bitmap(file='test2.png')
hist(mysum$resid, main='Residual Histogram', xlab='values of Residuals')
grid()
dev.off()
bitmap(file='test3.png')
densityplot(~mysum$resid,col='black',main='Residual Density Plot', xlab='values of Residuals')
dev.off()
bitmap(file='test4.png')
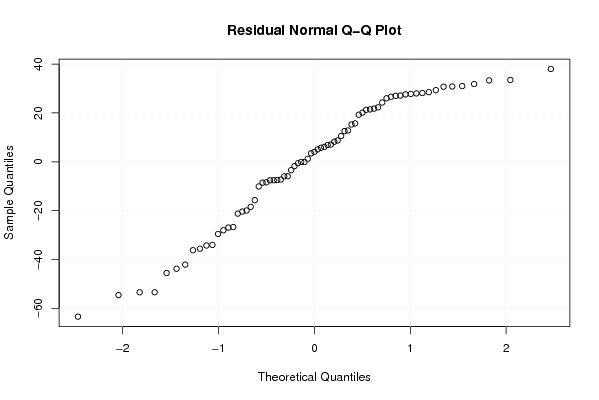
qqnorm(mysum$resid, main='Residual Normal Q-Q Plot')
grid()
dev.off()
(myerror <- as.ts(mysum$resid))
bitmap(file='test5.png')
dum <- cbind(lag(myerror,k=1),myerror)
dum
dum1 <- dum[2:length(myerror),]
dum1
z <- as.data.frame(dum1)
z
plot(z,main=paste('Residual Lag plot, lowess, and regression line'), ylab='values of Residuals', xlab='lagged values of Residuals')
lines(lowess(z))
abline(lm(z))
grid()
dev.off()
bitmap(file='test6.png')
acf(mysum$resid, lag.max=length(mysum$resid)/2, main='Residual Autocorrelation Function')
grid()
dev.off()
bitmap(file='test7.png')
pacf(mysum$resid, lag.max=length(mysum$resid)/2, main='Residual Partial Autocorrelation Function')
grid()
dev.off()
bitmap(file='test8.png')
opar <- par(mfrow = c(2,2), oma = c(0, 0, 1.1, 0))
plot(mylm, las = 1, sub='Residual Diagnostics')
par(opar)
dev.off()
load(file='createtable')
a<-table.start()
a<-table.row.start(a)
a<-table.element(a, 'Multiple Linear Regression - Estimated Regression Equation', 1, TRUE)
a<-table.row.end(a)
myeq <- colnames(x)[1]
myeq <- paste(myeq, '[t] = ', sep='')
for (i in 1:k){
if (mysum$coefficients[i,1] > 0) myeq <- paste(myeq, '+', '')
myeq <- paste(myeq, mysum$coefficients[i,1], sep=' ')
if (rownames(mysum$coefficients)[i] != '(Intercept)') {
myeq <- paste(myeq, rownames(mysum$coefficients)[i], sep='')
if (rownames(mysum$coefficients)[i] != 't') myeq <- paste(myeq, '[t]', sep='')
}
}
myeq <- paste(myeq, ' + e[t]')
a<-table.row.start(a)
a<-table.element(a, myeq)
a<-table.row.end(a)
a<-table.end(a)
table.save(a,file='mytable1.tab')
a<-table.start()
a<-table.row.start(a)
a<-table.element(a,hyperlink('ols1.htm','Multiple Linear Regression - Ordinary Least Squares',''), 6, TRUE)
a<-table.row.end(a)
a<-table.row.start(a)
a<-table.element(a,'Variable',header=TRUE)
a<-table.element(a,'Parameter',header=TRUE)
a<-table.element(a,'S.D.',header=TRUE)
a<-table.element(a,'T-STAT
H0: parameter = 0',header=TRUE)
a<-table.element(a,'2-tail p-value',header=TRUE)
a<-table.element(a,'1-tail p-value',header=TRUE)
a<-table.row.end(a)
for (i in 1:k){
a<-table.row.start(a)
a<-table.element(a,rownames(mysum$coefficients)[i],header=TRUE)
a<-table.element(a,mysum$coefficients[i,1])
a<-table.element(a, round(mysum$coefficients[i,2],6))
a<-table.element(a, round(mysum$coefficients[i,3],4))
a<-table.element(a, round(mysum$coefficients[i,4],6))
a<-table.element(a, round(mysum$coefficients[i,4]/2,6))
a<-table.row.end(a)
}
a<-table.end(a)
table.save(a,file='mytable2.tab')
a<-table.start()
a<-table.row.start(a)
a<-table.element(a, 'Multiple Linear Regression - Regression Statistics', 2, TRUE)
a<-table.row.end(a)
a<-table.row.start(a)
a<-table.element(a, 'Multiple R',1,TRUE)
a<-table.element(a, sqrt(mysum$r.squared))
a<-table.row.end(a)
a<-table.row.start(a)
a<-table.element(a, 'R-squared',1,TRUE)
a<-table.element(a, mysum$r.squared)
a<-table.row.end(a)
a<-table.row.start(a)
a<-table.element(a, 'Adjusted R-squared',1,TRUE)
a<-table.element(a, mysum$adj.r.squared)
a<-table.row.end(a)
a<-table.row.start(a)
a<-table.element(a, 'F-TEST (value)',1,TRUE)
a<-table.element(a, mysum$fstatistic[1])
a<-table.row.end(a)
a<-table.row.start(a)
a<-table.element(a, 'F-TEST (DF numerator)',1,TRUE)
a<-table.element(a, mysum$fstatistic[2])
a<-table.row.end(a)
a<-table.row.start(a)
a<-table.element(a, 'F-TEST (DF denominator)',1,TRUE)
a<-table.element(a, mysum$fstatistic[3])
a<-table.row.end(a)
a<-table.row.start(a)
a<-table.element(a, 'p-value',1,TRUE)
a<-table.element(a, 1-pf(mysum$fstatistic[1],mysum$fstatistic[2],mysum$fstatistic[3]))
a<-table.row.end(a)
a<-table.row.start(a)
a<-table.element(a, 'Multiple Linear Regression - Residual Statistics', 2, TRUE)
a<-table.row.end(a)
a<-table.row.start(a)
a<-table.element(a, 'Residual Standard Deviation',1,TRUE)
a<-table.element(a, mysum$sigma)
a<-table.row.end(a)
a<-table.row.start(a)
a<-table.element(a, 'Sum Squared Residuals',1,TRUE)
a<-table.element(a, sum(myerror*myerror))
a<-table.row.end(a)
a<-table.end(a)
table.save(a,file='mytable3.tab')
a<-table.start()
a<-table.row.start(a)
a<-table.element(a, 'Multiple Linear Regression - Actuals, Interpolation, and Residuals', 4, TRUE)
a<-table.row.end(a)
a<-table.row.start(a)
a<-table.element(a, 'Time or Index', 1, TRUE)
a<-table.element(a, 'Actuals', 1, TRUE)
a<-table.element(a, 'Interpolation
Forecast', 1, TRUE)
a<-table.element(a, 'Residuals
Prediction Error', 1, TRUE)
a<-table.row.end(a)
for (i in 1:n) {
a<-table.row.start(a)
a<-table.element(a,i, 1, TRUE)
a<-table.element(a,x[i])
a<-table.element(a,x[i]-mysum$resid[i])
a<-table.element(a,mysum$resid[i])
a<-table.row.end(a)
}
a<-table.end(a)
table.save(a,file='mytable4.tab')