Free Statistics

of Irreproducible Research!

Author's title

Author*Unverified author*
R Software Modulerwasp_multipleregression.wasp
Title produced by softwareMultiple Regression
Date of computationThu, 15 Nov 2007 03:48:50 -0700
Cite this page as followsStatistical Computations at FreeStatistics.org, Office for Research Development and Education, URL https://freestatistics.org/blog/index.php?v=date/2007/Nov/15/t1195123535jujax97kt2nu1d2.htm/, Retrieved Sat, 04 May 2024 13:51:48 +0000
Statistical Computations at FreeStatistics.org, Office for Research Development and Education, URL https://freestatistics.org/blog/index.php?pk=5419, Retrieved Sat, 04 May 2024 13:51:48 +0000
QR Codes:

Original text written by user:
IsPrivate?No (this computation is public)
User-defined keywords
Estimated Impact261
Family? (F = Feedback message, R = changed R code, M = changed R Module, P = changed Parameters, D = changed Data)
-       [Multiple Regression] [] [2007-11-15 10:48:50] [2cdb7403ed3391afb545b8c0d20da37e] [Current]
Feedback Forum

Post a new message
Dataseries X:
140	373
132	371
117	354
114	357
113	363
110	364
107	363
103	358
98	357
98	357
137	380
148	378
147	376
139	380
130	379
128	384
127	392
123	394
118	392
114	396
108	392
111	396
151	419
159	421
158	420
148	418
138	410
137	418
136	426
133	428
126	430
120	424
114	423
116	427
153	441
162	449
161	452
149	462
139	455
135	461
130	461
127	463
122	462
117	456
112	455
113	456
149	472
157	472
157	471
147	465
137	459
132	465
125	468
123	467
117	463
114	460
111	462
112	461
144	476
150	476
149	471
134	453
123	443
116	442
117	444
111	438
105	427
102	424
95	416
93	406
124	431
130	434
124	418


Summary of compuational transaction
Raw Inputview raw input (R code)
Raw Outputview raw output of R engine
Computing time3 seconds
R Server'Gwilym Jenkins' @ 72.249.127.135

\begin{tabular}{lllllllll}
\hline
Summary of compuational transaction \tabularnewline
Raw Input & view raw input (R code)  \tabularnewline
Raw Output & view raw output of R engine  \tabularnewline
Computing time & 3 seconds \tabularnewline
R Server & 'Gwilym Jenkins' @ 72.249.127.135 \tabularnewline
\hline
\end{tabular}
%Source: https://freestatistics.org/blog/index.php?pk=5419&T=0

[TABLE]
[ROW][C]Summary of compuational transaction[/C][/ROW]
[ROW][C]Raw Input[/C][C]view raw input (R code) [/C][/ROW]
[ROW][C]Raw Output[/C][C]view raw output of R engine [/C][/ROW]
[ROW][C]Computing time[/C][C]3 seconds[/C][/ROW]
[ROW][C]R Server[/C][C]'Gwilym Jenkins' @ 72.249.127.135[/C][/ROW]
[/TABLE]
Source: https://freestatistics.org/blog/index.php?pk=5419&T=0

Globally Unique Identifier (entire table): ba.freestatistics.org/blog/index.php?pk=5419&T=0

As an alternative you can also use a QR Code:  

The GUIDs for individual cells are displayed in the table below:

Summary of compuational transaction
Raw Inputview raw input (R code)
Raw Outputview raw output of R engine
Computing time3 seconds
R Server'Gwilym Jenkins' @ 72.249.127.135


Multiple Linear Regression - Estimated Regression Equation
-25[t] = + 25.7095903042373 + 0.3341097741355`25 `[t] -1.35075440129733M1[t] -10.0278612159084M2[t] -17.6287970771281M3[t] -22.2951234107307M4[t] -25.6281164110000M5[t] -28.6242820943263M6[t] -32.5071367509352M7[t] -35.1119548161657M8[t] -39.2175493221984M9[t] -37.7690117474795M10[t] -7.89129973075869M11[t] -0.503834316673765t + e[t]

\begin{tabular}{lllllllll}
\hline
Multiple Linear Regression - Estimated Regression Equation \tabularnewline
-25[t] =  +  25.7095903042373 +  0.3341097741355`25
`[t] -1.35075440129733M1[t] -10.0278612159084M2[t] -17.6287970771281M3[t] -22.2951234107307M4[t] -25.6281164110000M5[t] -28.6242820943263M6[t] -32.5071367509352M7[t] -35.1119548161657M8[t] -39.2175493221984M9[t] -37.7690117474795M10[t] -7.89129973075869M11[t] -0.503834316673765t  + e[t] \tabularnewline
\hline
\end{tabular}
%Source: https://freestatistics.org/blog/index.php?pk=5419&T=1

[TABLE]
[ROW][C]Multiple Linear Regression - Estimated Regression Equation[/C][/ROW]
[ROW][C]-25[t] =  +  25.7095903042373 +  0.3341097741355`25
`[t] -1.35075440129733M1[t] -10.0278612159084M2[t] -17.6287970771281M3[t] -22.2951234107307M4[t] -25.6281164110000M5[t] -28.6242820943263M6[t] -32.5071367509352M7[t] -35.1119548161657M8[t] -39.2175493221984M9[t] -37.7690117474795M10[t] -7.89129973075869M11[t] -0.503834316673765t  + e[t][/C][/ROW]
[/TABLE]
Source: https://freestatistics.org/blog/index.php?pk=5419&T=1

Globally Unique Identifier (entire table): ba.freestatistics.org/blog/index.php?pk=5419&T=1

As an alternative you can also use a QR Code:  

The GUIDs for individual cells are displayed in the table below:

Multiple Linear Regression - Estimated Regression Equation
-25[t] = + 25.7095903042373 + 0.3341097741355`25 `[t] -1.35075440129733M1[t] -10.0278612159084M2[t] -17.6287970771281M3[t] -22.2951234107307M4[t] -25.6281164110000M5[t] -28.6242820943263M6[t] -32.5071367509352M7[t] -35.1119548161657M8[t] -39.2175493221984M9[t] -37.7690117474795M10[t] -7.89129973075869M11[t] -0.503834316673765t + e[t]


Multiple Linear Regression - Ordinary Least Squares
VariableParameterS.D.T-STATH0: parameter = 02-tail p-value1-tail p-value
(Intercept)25.70959030423739.1608252.80650.0067760.003388
`25 `0.33410977413550.02337914.290800
M1-1.350754401297332.549443-0.52980.5982230.299111
M2-10.02786121590842.651237-3.78230.0003650.000183
M3-17.62879707712812.657874-6.632700
M4-22.29512341073072.650749-8.410900
M5-25.62811641100002.645881-9.68600
M6-28.62428209432632.645331-10.820700
M7-32.50713675093522.649651-12.268500
M8-35.11195481616572.658738-13.206200
M9-39.21754932219842.668726-14.695200
M10-37.76901174747952.674232-14.123300
M11-7.891299730758692.638944-2.99030.0040610.00203
t-0.5038343166737650.041013-12.284600

\begin{tabular}{lllllllll}
\hline
Multiple Linear Regression - Ordinary Least Squares \tabularnewline
Variable & Parameter & S.D. & T-STATH0: parameter = 0 & 2-tail p-value & 1-tail p-value \tabularnewline
(Intercept) & 25.7095903042373 & 9.160825 & 2.8065 & 0.006776 & 0.003388 \tabularnewline
`25
` & 0.3341097741355 & 0.023379 & 14.2908 & 0 & 0 \tabularnewline
M1 & -1.35075440129733 & 2.549443 & -0.5298 & 0.598223 & 0.299111 \tabularnewline
M2 & -10.0278612159084 & 2.651237 & -3.7823 & 0.000365 & 0.000183 \tabularnewline
M3 & -17.6287970771281 & 2.657874 & -6.6327 & 0 & 0 \tabularnewline
M4 & -22.2951234107307 & 2.650749 & -8.4109 & 0 & 0 \tabularnewline
M5 & -25.6281164110000 & 2.645881 & -9.686 & 0 & 0 \tabularnewline
M6 & -28.6242820943263 & 2.645331 & -10.8207 & 0 & 0 \tabularnewline
M7 & -32.5071367509352 & 2.649651 & -12.2685 & 0 & 0 \tabularnewline
M8 & -35.1119548161657 & 2.658738 & -13.2062 & 0 & 0 \tabularnewline
M9 & -39.2175493221984 & 2.668726 & -14.6952 & 0 & 0 \tabularnewline
M10 & -37.7690117474795 & 2.674232 & -14.1233 & 0 & 0 \tabularnewline
M11 & -7.89129973075869 & 2.638944 & -2.9903 & 0.004061 & 0.00203 \tabularnewline
t & -0.503834316673765 & 0.041013 & -12.2846 & 0 & 0 \tabularnewline
\hline
\end{tabular}
%Source: https://freestatistics.org/blog/index.php?pk=5419&T=2

[TABLE]
[ROW][C]Multiple Linear Regression - Ordinary Least Squares[/C][/ROW]
[ROW][C]Variable[/C][C]Parameter[/C][C]S.D.[/C][C]T-STATH0: parameter = 0[/C][C]2-tail p-value[/C][C]1-tail p-value[/C][/ROW]
[ROW][C](Intercept)[/C][C]25.7095903042373[/C][C]9.160825[/C][C]2.8065[/C][C]0.006776[/C][C]0.003388[/C][/ROW]
[ROW][C]`25
`[/C][C]0.3341097741355[/C][C]0.023379[/C][C]14.2908[/C][C]0[/C][C]0[/C][/ROW]
[ROW][C]M1[/C][C]-1.35075440129733[/C][C]2.549443[/C][C]-0.5298[/C][C]0.598223[/C][C]0.299111[/C][/ROW]
[ROW][C]M2[/C][C]-10.0278612159084[/C][C]2.651237[/C][C]-3.7823[/C][C]0.000365[/C][C]0.000183[/C][/ROW]
[ROW][C]M3[/C][C]-17.6287970771281[/C][C]2.657874[/C][C]-6.6327[/C][C]0[/C][C]0[/C][/ROW]
[ROW][C]M4[/C][C]-22.2951234107307[/C][C]2.650749[/C][C]-8.4109[/C][C]0[/C][C]0[/C][/ROW]
[ROW][C]M5[/C][C]-25.6281164110000[/C][C]2.645881[/C][C]-9.686[/C][C]0[/C][C]0[/C][/ROW]
[ROW][C]M6[/C][C]-28.6242820943263[/C][C]2.645331[/C][C]-10.8207[/C][C]0[/C][C]0[/C][/ROW]
[ROW][C]M7[/C][C]-32.5071367509352[/C][C]2.649651[/C][C]-12.2685[/C][C]0[/C][C]0[/C][/ROW]
[ROW][C]M8[/C][C]-35.1119548161657[/C][C]2.658738[/C][C]-13.2062[/C][C]0[/C][C]0[/C][/ROW]
[ROW][C]M9[/C][C]-39.2175493221984[/C][C]2.668726[/C][C]-14.6952[/C][C]0[/C][C]0[/C][/ROW]
[ROW][C]M10[/C][C]-37.7690117474795[/C][C]2.674232[/C][C]-14.1233[/C][C]0[/C][C]0[/C][/ROW]
[ROW][C]M11[/C][C]-7.89129973075869[/C][C]2.638944[/C][C]-2.9903[/C][C]0.004061[/C][C]0.00203[/C][/ROW]
[ROW][C]t[/C][C]-0.503834316673765[/C][C]0.041013[/C][C]-12.2846[/C][C]0[/C][C]0[/C][/ROW]
[/TABLE]
Source: https://freestatistics.org/blog/index.php?pk=5419&T=2

Globally Unique Identifier (entire table): ba.freestatistics.org/blog/index.php?pk=5419&T=2

As an alternative you can also use a QR Code:  

The GUIDs for individual cells are displayed in the table below:

Multiple Linear Regression - Ordinary Least Squares
VariableParameterS.D.T-STATH0: parameter = 02-tail p-value1-tail p-value
(Intercept)25.70959030423739.1608252.80650.0067760.003388
`25 `0.33410977413550.02337914.290800
M1-1.350754401297332.549443-0.52980.5982230.299111
M2-10.02786121590842.651237-3.78230.0003650.000183
M3-17.62879707712812.657874-6.632700
M4-22.29512341073072.650749-8.410900
M5-25.62811641100002.645881-9.68600
M6-28.62428209432632.645331-10.820700
M7-32.50713675093522.649651-12.268500
M8-35.11195481616572.658738-13.206200
M9-39.21754932219842.668726-14.695200
M10-37.76901174747952.674232-14.123300
M11-7.891299730758692.638944-2.99030.0040610.00203
t-0.5038343166737650.041013-12.284600


Multiple Linear Regression - Regression Statistics
Multiple R0.971946355203395
R-squared0.944679717393163
Adjusted R-squared0.932490502581487
F-TEST (value)77.5012773167527
F-TEST (DF numerator)13
F-TEST (DF denominator)59
p-value0
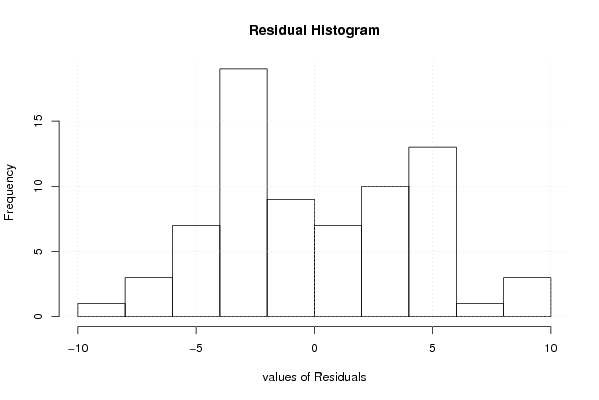
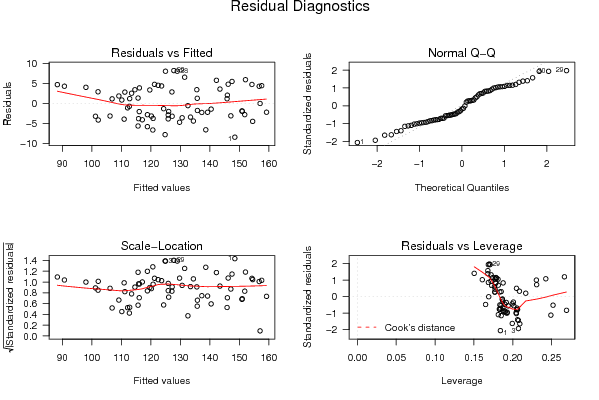
Multiple Linear Regression - Residual Statistics
Residual Standard Deviation4.57053009318048
Sum Squared Residuals1232.49497462744

\begin{tabular}{lllllllll}
\hline
Multiple Linear Regression - Regression Statistics \tabularnewline
Multiple R & 0.971946355203395 \tabularnewline
R-squared & 0.944679717393163 \tabularnewline
Adjusted R-squared & 0.932490502581487 \tabularnewline
F-TEST (value) & 77.5012773167527 \tabularnewline
F-TEST (DF numerator) & 13 \tabularnewline
F-TEST (DF denominator) & 59 \tabularnewline
p-value & 0 \tabularnewline
Multiple Linear Regression - Residual Statistics \tabularnewline
Residual Standard Deviation & 4.57053009318048 \tabularnewline
Sum Squared Residuals & 1232.49497462744 \tabularnewline
\hline
\end{tabular}
%Source: https://freestatistics.org/blog/index.php?pk=5419&T=3

[TABLE]
[ROW][C]Multiple Linear Regression - Regression Statistics[/C][/ROW]
[ROW][C]Multiple R[/C][C]0.971946355203395[/C][/ROW]
[ROW][C]R-squared[/C][C]0.944679717393163[/C][/ROW]
[ROW][C]Adjusted R-squared[/C][C]0.932490502581487[/C][/ROW]
[ROW][C]F-TEST (value)[/C][C]77.5012773167527[/C][/ROW]
[ROW][C]F-TEST (DF numerator)[/C][C]13[/C][/ROW]
[ROW][C]F-TEST (DF denominator)[/C][C]59[/C][/ROW]
[ROW][C]p-value[/C][C]0[/C][/ROW]
[ROW][C]Multiple Linear Regression - Residual Statistics[/C][/ROW]
[ROW][C]Residual Standard Deviation[/C][C]4.57053009318048[/C][/ROW]
[ROW][C]Sum Squared Residuals[/C][C]1232.49497462744[/C][/ROW]
[/TABLE]
Source: https://freestatistics.org/blog/index.php?pk=5419&T=3

Globally Unique Identifier (entire table): ba.freestatistics.org/blog/index.php?pk=5419&T=3

As an alternative you can also use a QR Code:  

The GUIDs for individual cells are displayed in the table below:

Multiple Linear Regression - Regression Statistics
Multiple R0.971946355203395
R-squared0.944679717393163
Adjusted R-squared0.932490502581487
F-TEST (value)77.5012773167527
F-TEST (DF numerator)13
F-TEST (DF denominator)59
p-value0
Multiple Linear Regression - Residual Statistics
Residual Standard Deviation4.57053009318048
Sum Squared Residuals1232.49497462744


Multiple Linear Regression - Actuals, Interpolation, and Residuals
Time or IndexActualsInterpolationForecastResidualsPrediction Error
1140148.477947338808-8.47794733880753
2132138.628786659252-6.62878665925186
3117124.844150321055-7.84415032105496
4114120.676318993185-6.67631899318502
5113118.844150321055-5.84415032105493
6110115.678260095190-5.67826009519042
7107110.957461347772-3.95746134777218
8103106.178260095190-3.17826009519043
998101.234721498349-3.23472149834853
1098102.179424756394-4.17942475639371
11137139.237827261557-2.23782726155721
12148145.9570731273712.04292687262891
13147143.4342648611293.56573513887098
14139135.5897628263863.41023717361382
15130127.1508828743572.84911712564274
16128123.6512710947584.34872890524165
17127122.4873219708994.51267802910073
18123119.6555415191703.34445848082972
19118114.6006329976173.39936700238348
20114112.8284197122541.17158028774573
21108106.8825517930061.11744820699416
22111109.1636941475931.83630585240698
23151146.2220966527574.77790334724349
24159154.2777816151124.72221838488756
25158152.0890831230065.91091687699415
26148142.239922443455.76007755655
27138131.4622740724736.53772592752741
28137128.9649916152808.03500838471982
29136127.8010424914218.1989575085789
30133124.9692620396928.03073796030791
31126121.2507926146804.74920738531966
32120116.1374815879633.86251841203691
33114111.1939429911212.80605700887882
34116113.4750853457082.52491465429166
35153147.5264998836525.47350011634766
36162157.5868434908214.41315650917874
37161156.7345840952574.26541590474333
38149150.894740705327-1.89474070532682
39139140.451202108485-1.45120210848491
40135137.285700103021-2.28570010302149
41130133.448872786078-3.44887278607842
42127130.617092334349-3.61709233434941
43122125.896293586931-3.89629358693117
44117120.782982560214-3.78298256021391
45112115.839443963372-3.839443963372
46113117.118256995553-4.11825699555265
47149151.837891081768-2.83789108176766
48157159.225356495853-2.22535649585258
49157157.036658003746-0.0366580037459927
50147145.8510582276481.14894177235185
51137135.7416294049421.25837059505827
52132132.576127399478-0.576127399478315
53125129.741629404942-4.74162940494174
54123125.907519630806-2.90751963080624
55117120.184391560981-3.18439156098148
56114116.073409856671-2.07340985667074
57111112.132200582235-1.13220058223531
58112112.742794066145-0.742794066144982
59144147.128318378224-3.12831837822448
60150154.515783792309-4.51578379230941
61149150.990646203661-1.99064620366081
62134135.795729137937-1.79572913793698
63123124.349861218689-1.34986121868855
64116118.845590794277-2.84559079427664
65117115.6769830256051.32301697439545
66111110.1723243807920.82767561920844
67105102.1104278920182.8895721079817
6810297.99944618770754.00055381229244
699590.71713917191714.28286082808286
709388.32074468860734.6792553113927
71124126.047366742042-2.04736674204180
72130134.437161478533-4.43716147853323
73124127.236816374394-3.23681637439413

\begin{tabular}{lllllllll}
\hline
Multiple Linear Regression - Actuals, Interpolation, and Residuals \tabularnewline
Time or Index & Actuals & InterpolationForecast & ResidualsPrediction Error \tabularnewline
1 & 140 & 148.477947338808 & -8.47794733880753 \tabularnewline
2 & 132 & 138.628786659252 & -6.62878665925186 \tabularnewline
3 & 117 & 124.844150321055 & -7.84415032105496 \tabularnewline
4 & 114 & 120.676318993185 & -6.67631899318502 \tabularnewline
5 & 113 & 118.844150321055 & -5.84415032105493 \tabularnewline
6 & 110 & 115.678260095190 & -5.67826009519042 \tabularnewline
7 & 107 & 110.957461347772 & -3.95746134777218 \tabularnewline
8 & 103 & 106.178260095190 & -3.17826009519043 \tabularnewline
9 & 98 & 101.234721498349 & -3.23472149834853 \tabularnewline
10 & 98 & 102.179424756394 & -4.17942475639371 \tabularnewline
11 & 137 & 139.237827261557 & -2.23782726155721 \tabularnewline
12 & 148 & 145.957073127371 & 2.04292687262891 \tabularnewline
13 & 147 & 143.434264861129 & 3.56573513887098 \tabularnewline
14 & 139 & 135.589762826386 & 3.41023717361382 \tabularnewline
15 & 130 & 127.150882874357 & 2.84911712564274 \tabularnewline
16 & 128 & 123.651271094758 & 4.34872890524165 \tabularnewline
17 & 127 & 122.487321970899 & 4.51267802910073 \tabularnewline
18 & 123 & 119.655541519170 & 3.34445848082972 \tabularnewline
19 & 118 & 114.600632997617 & 3.39936700238348 \tabularnewline
20 & 114 & 112.828419712254 & 1.17158028774573 \tabularnewline
21 & 108 & 106.882551793006 & 1.11744820699416 \tabularnewline
22 & 111 & 109.163694147593 & 1.83630585240698 \tabularnewline
23 & 151 & 146.222096652757 & 4.77790334724349 \tabularnewline
24 & 159 & 154.277781615112 & 4.72221838488756 \tabularnewline
25 & 158 & 152.089083123006 & 5.91091687699415 \tabularnewline
26 & 148 & 142.23992244345 & 5.76007755655 \tabularnewline
27 & 138 & 131.462274072473 & 6.53772592752741 \tabularnewline
28 & 137 & 128.964991615280 & 8.03500838471982 \tabularnewline
29 & 136 & 127.801042491421 & 8.1989575085789 \tabularnewline
30 & 133 & 124.969262039692 & 8.03073796030791 \tabularnewline
31 & 126 & 121.250792614680 & 4.74920738531966 \tabularnewline
32 & 120 & 116.137481587963 & 3.86251841203691 \tabularnewline
33 & 114 & 111.193942991121 & 2.80605700887882 \tabularnewline
34 & 116 & 113.475085345708 & 2.52491465429166 \tabularnewline
35 & 153 & 147.526499883652 & 5.47350011634766 \tabularnewline
36 & 162 & 157.586843490821 & 4.41315650917874 \tabularnewline
37 & 161 & 156.734584095257 & 4.26541590474333 \tabularnewline
38 & 149 & 150.894740705327 & -1.89474070532682 \tabularnewline
39 & 139 & 140.451202108485 & -1.45120210848491 \tabularnewline
40 & 135 & 137.285700103021 & -2.28570010302149 \tabularnewline
41 & 130 & 133.448872786078 & -3.44887278607842 \tabularnewline
42 & 127 & 130.617092334349 & -3.61709233434941 \tabularnewline
43 & 122 & 125.896293586931 & -3.89629358693117 \tabularnewline
44 & 117 & 120.782982560214 & -3.78298256021391 \tabularnewline
45 & 112 & 115.839443963372 & -3.839443963372 \tabularnewline
46 & 113 & 117.118256995553 & -4.11825699555265 \tabularnewline
47 & 149 & 151.837891081768 & -2.83789108176766 \tabularnewline
48 & 157 & 159.225356495853 & -2.22535649585258 \tabularnewline
49 & 157 & 157.036658003746 & -0.0366580037459927 \tabularnewline
50 & 147 & 145.851058227648 & 1.14894177235185 \tabularnewline
51 & 137 & 135.741629404942 & 1.25837059505827 \tabularnewline
52 & 132 & 132.576127399478 & -0.576127399478315 \tabularnewline
53 & 125 & 129.741629404942 & -4.74162940494174 \tabularnewline
54 & 123 & 125.907519630806 & -2.90751963080624 \tabularnewline
55 & 117 & 120.184391560981 & -3.18439156098148 \tabularnewline
56 & 114 & 116.073409856671 & -2.07340985667074 \tabularnewline
57 & 111 & 112.132200582235 & -1.13220058223531 \tabularnewline
58 & 112 & 112.742794066145 & -0.742794066144982 \tabularnewline
59 & 144 & 147.128318378224 & -3.12831837822448 \tabularnewline
60 & 150 & 154.515783792309 & -4.51578379230941 \tabularnewline
61 & 149 & 150.990646203661 & -1.99064620366081 \tabularnewline
62 & 134 & 135.795729137937 & -1.79572913793698 \tabularnewline
63 & 123 & 124.349861218689 & -1.34986121868855 \tabularnewline
64 & 116 & 118.845590794277 & -2.84559079427664 \tabularnewline
65 & 117 & 115.676983025605 & 1.32301697439545 \tabularnewline
66 & 111 & 110.172324380792 & 0.82767561920844 \tabularnewline
67 & 105 & 102.110427892018 & 2.8895721079817 \tabularnewline
68 & 102 & 97.9994461877075 & 4.00055381229244 \tabularnewline
69 & 95 & 90.7171391719171 & 4.28286082808286 \tabularnewline
70 & 93 & 88.3207446886073 & 4.6792553113927 \tabularnewline
71 & 124 & 126.047366742042 & -2.04736674204180 \tabularnewline
72 & 130 & 134.437161478533 & -4.43716147853323 \tabularnewline
73 & 124 & 127.236816374394 & -3.23681637439413 \tabularnewline
\hline
\end{tabular}
%Source: https://freestatistics.org/blog/index.php?pk=5419&T=4

[TABLE]
[ROW][C]Multiple Linear Regression - Actuals, Interpolation, and Residuals[/C][/ROW]
[ROW][C]Time or Index[/C][C]Actuals[/C][C]InterpolationForecast[/C][C]ResidualsPrediction Error[/C][/ROW]
[ROW][C]1[/C][C]140[/C][C]148.477947338808[/C][C]-8.47794733880753[/C][/ROW]
[ROW][C]2[/C][C]132[/C][C]138.628786659252[/C][C]-6.62878665925186[/C][/ROW]
[ROW][C]3[/C][C]117[/C][C]124.844150321055[/C][C]-7.84415032105496[/C][/ROW]
[ROW][C]4[/C][C]114[/C][C]120.676318993185[/C][C]-6.67631899318502[/C][/ROW]
[ROW][C]5[/C][C]113[/C][C]118.844150321055[/C][C]-5.84415032105493[/C][/ROW]
[ROW][C]6[/C][C]110[/C][C]115.678260095190[/C][C]-5.67826009519042[/C][/ROW]
[ROW][C]7[/C][C]107[/C][C]110.957461347772[/C][C]-3.95746134777218[/C][/ROW]
[ROW][C]8[/C][C]103[/C][C]106.178260095190[/C][C]-3.17826009519043[/C][/ROW]
[ROW][C]9[/C][C]98[/C][C]101.234721498349[/C][C]-3.23472149834853[/C][/ROW]
[ROW][C]10[/C][C]98[/C][C]102.179424756394[/C][C]-4.17942475639371[/C][/ROW]
[ROW][C]11[/C][C]137[/C][C]139.237827261557[/C][C]-2.23782726155721[/C][/ROW]
[ROW][C]12[/C][C]148[/C][C]145.957073127371[/C][C]2.04292687262891[/C][/ROW]
[ROW][C]13[/C][C]147[/C][C]143.434264861129[/C][C]3.56573513887098[/C][/ROW]
[ROW][C]14[/C][C]139[/C][C]135.589762826386[/C][C]3.41023717361382[/C][/ROW]
[ROW][C]15[/C][C]130[/C][C]127.150882874357[/C][C]2.84911712564274[/C][/ROW]
[ROW][C]16[/C][C]128[/C][C]123.651271094758[/C][C]4.34872890524165[/C][/ROW]
[ROW][C]17[/C][C]127[/C][C]122.487321970899[/C][C]4.51267802910073[/C][/ROW]
[ROW][C]18[/C][C]123[/C][C]119.655541519170[/C][C]3.34445848082972[/C][/ROW]
[ROW][C]19[/C][C]118[/C][C]114.600632997617[/C][C]3.39936700238348[/C][/ROW]
[ROW][C]20[/C][C]114[/C][C]112.828419712254[/C][C]1.17158028774573[/C][/ROW]
[ROW][C]21[/C][C]108[/C][C]106.882551793006[/C][C]1.11744820699416[/C][/ROW]
[ROW][C]22[/C][C]111[/C][C]109.163694147593[/C][C]1.83630585240698[/C][/ROW]
[ROW][C]23[/C][C]151[/C][C]146.222096652757[/C][C]4.77790334724349[/C][/ROW]
[ROW][C]24[/C][C]159[/C][C]154.277781615112[/C][C]4.72221838488756[/C][/ROW]
[ROW][C]25[/C][C]158[/C][C]152.089083123006[/C][C]5.91091687699415[/C][/ROW]
[ROW][C]26[/C][C]148[/C][C]142.23992244345[/C][C]5.76007755655[/C][/ROW]
[ROW][C]27[/C][C]138[/C][C]131.462274072473[/C][C]6.53772592752741[/C][/ROW]
[ROW][C]28[/C][C]137[/C][C]128.964991615280[/C][C]8.03500838471982[/C][/ROW]
[ROW][C]29[/C][C]136[/C][C]127.801042491421[/C][C]8.1989575085789[/C][/ROW]
[ROW][C]30[/C][C]133[/C][C]124.969262039692[/C][C]8.03073796030791[/C][/ROW]
[ROW][C]31[/C][C]126[/C][C]121.250792614680[/C][C]4.74920738531966[/C][/ROW]
[ROW][C]32[/C][C]120[/C][C]116.137481587963[/C][C]3.86251841203691[/C][/ROW]
[ROW][C]33[/C][C]114[/C][C]111.193942991121[/C][C]2.80605700887882[/C][/ROW]
[ROW][C]34[/C][C]116[/C][C]113.475085345708[/C][C]2.52491465429166[/C][/ROW]
[ROW][C]35[/C][C]153[/C][C]147.526499883652[/C][C]5.47350011634766[/C][/ROW]
[ROW][C]36[/C][C]162[/C][C]157.586843490821[/C][C]4.41315650917874[/C][/ROW]
[ROW][C]37[/C][C]161[/C][C]156.734584095257[/C][C]4.26541590474333[/C][/ROW]
[ROW][C]38[/C][C]149[/C][C]150.894740705327[/C][C]-1.89474070532682[/C][/ROW]
[ROW][C]39[/C][C]139[/C][C]140.451202108485[/C][C]-1.45120210848491[/C][/ROW]
[ROW][C]40[/C][C]135[/C][C]137.285700103021[/C][C]-2.28570010302149[/C][/ROW]
[ROW][C]41[/C][C]130[/C][C]133.448872786078[/C][C]-3.44887278607842[/C][/ROW]
[ROW][C]42[/C][C]127[/C][C]130.617092334349[/C][C]-3.61709233434941[/C][/ROW]
[ROW][C]43[/C][C]122[/C][C]125.896293586931[/C][C]-3.89629358693117[/C][/ROW]
[ROW][C]44[/C][C]117[/C][C]120.782982560214[/C][C]-3.78298256021391[/C][/ROW]
[ROW][C]45[/C][C]112[/C][C]115.839443963372[/C][C]-3.839443963372[/C][/ROW]
[ROW][C]46[/C][C]113[/C][C]117.118256995553[/C][C]-4.11825699555265[/C][/ROW]
[ROW][C]47[/C][C]149[/C][C]151.837891081768[/C][C]-2.83789108176766[/C][/ROW]
[ROW][C]48[/C][C]157[/C][C]159.225356495853[/C][C]-2.22535649585258[/C][/ROW]
[ROW][C]49[/C][C]157[/C][C]157.036658003746[/C][C]-0.0366580037459927[/C][/ROW]
[ROW][C]50[/C][C]147[/C][C]145.851058227648[/C][C]1.14894177235185[/C][/ROW]
[ROW][C]51[/C][C]137[/C][C]135.741629404942[/C][C]1.25837059505827[/C][/ROW]
[ROW][C]52[/C][C]132[/C][C]132.576127399478[/C][C]-0.576127399478315[/C][/ROW]
[ROW][C]53[/C][C]125[/C][C]129.741629404942[/C][C]-4.74162940494174[/C][/ROW]
[ROW][C]54[/C][C]123[/C][C]125.907519630806[/C][C]-2.90751963080624[/C][/ROW]
[ROW][C]55[/C][C]117[/C][C]120.184391560981[/C][C]-3.18439156098148[/C][/ROW]
[ROW][C]56[/C][C]114[/C][C]116.073409856671[/C][C]-2.07340985667074[/C][/ROW]
[ROW][C]57[/C][C]111[/C][C]112.132200582235[/C][C]-1.13220058223531[/C][/ROW]
[ROW][C]58[/C][C]112[/C][C]112.742794066145[/C][C]-0.742794066144982[/C][/ROW]
[ROW][C]59[/C][C]144[/C][C]147.128318378224[/C][C]-3.12831837822448[/C][/ROW]
[ROW][C]60[/C][C]150[/C][C]154.515783792309[/C][C]-4.51578379230941[/C][/ROW]
[ROW][C]61[/C][C]149[/C][C]150.990646203661[/C][C]-1.99064620366081[/C][/ROW]
[ROW][C]62[/C][C]134[/C][C]135.795729137937[/C][C]-1.79572913793698[/C][/ROW]
[ROW][C]63[/C][C]123[/C][C]124.349861218689[/C][C]-1.34986121868855[/C][/ROW]
[ROW][C]64[/C][C]116[/C][C]118.845590794277[/C][C]-2.84559079427664[/C][/ROW]
[ROW][C]65[/C][C]117[/C][C]115.676983025605[/C][C]1.32301697439545[/C][/ROW]
[ROW][C]66[/C][C]111[/C][C]110.172324380792[/C][C]0.82767561920844[/C][/ROW]
[ROW][C]67[/C][C]105[/C][C]102.110427892018[/C][C]2.8895721079817[/C][/ROW]
[ROW][C]68[/C][C]102[/C][C]97.9994461877075[/C][C]4.00055381229244[/C][/ROW]
[ROW][C]69[/C][C]95[/C][C]90.7171391719171[/C][C]4.28286082808286[/C][/ROW]
[ROW][C]70[/C][C]93[/C][C]88.3207446886073[/C][C]4.6792553113927[/C][/ROW]
[ROW][C]71[/C][C]124[/C][C]126.047366742042[/C][C]-2.04736674204180[/C][/ROW]
[ROW][C]72[/C][C]130[/C][C]134.437161478533[/C][C]-4.43716147853323[/C][/ROW]
[ROW][C]73[/C][C]124[/C][C]127.236816374394[/C][C]-3.23681637439413[/C][/ROW]
[/TABLE]
Source: https://freestatistics.org/blog/index.php?pk=5419&T=4

Globally Unique Identifier (entire table): ba.freestatistics.org/blog/index.php?pk=5419&T=4

As an alternative you can also use a QR Code:  

The GUIDs for individual cells are displayed in the table below:

Multiple Linear Regression - Actuals, Interpolation, and Residuals
Time or IndexActualsInterpolationForecastResidualsPrediction Error
1140148.477947338808-8.47794733880753
2132138.628786659252-6.62878665925186
3117124.844150321055-7.84415032105496
4114120.676318993185-6.67631899318502
5113118.844150321055-5.84415032105493
6110115.678260095190-5.67826009519042
7107110.957461347772-3.95746134777218
8103106.178260095190-3.17826009519043
998101.234721498349-3.23472149834853
1098102.179424756394-4.17942475639371
11137139.237827261557-2.23782726155721
12148145.9570731273712.04292687262891
13147143.4342648611293.56573513887098
14139135.5897628263863.41023717361382
15130127.1508828743572.84911712564274
16128123.6512710947584.34872890524165
17127122.4873219708994.51267802910073
18123119.6555415191703.34445848082972
19118114.6006329976173.39936700238348
20114112.8284197122541.17158028774573
21108106.8825517930061.11744820699416
22111109.1636941475931.83630585240698
23151146.2220966527574.77790334724349
24159154.2777816151124.72221838488756
25158152.0890831230065.91091687699415
26148142.239922443455.76007755655
27138131.4622740724736.53772592752741
28137128.9649916152808.03500838471982
29136127.8010424914218.1989575085789
30133124.9692620396928.03073796030791
31126121.2507926146804.74920738531966
32120116.1374815879633.86251841203691
33114111.1939429911212.80605700887882
34116113.4750853457082.52491465429166
35153147.5264998836525.47350011634766
36162157.5868434908214.41315650917874
37161156.7345840952574.26541590474333
38149150.894740705327-1.89474070532682
39139140.451202108485-1.45120210848491
40135137.285700103021-2.28570010302149
41130133.448872786078-3.44887278607842
42127130.617092334349-3.61709233434941
43122125.896293586931-3.89629358693117
44117120.782982560214-3.78298256021391
45112115.839443963372-3.839443963372
46113117.118256995553-4.11825699555265
47149151.837891081768-2.83789108176766
48157159.225356495853-2.22535649585258
49157157.036658003746-0.0366580037459927
50147145.8510582276481.14894177235185
51137135.7416294049421.25837059505827
52132132.576127399478-0.576127399478315
53125129.741629404942-4.74162940494174
54123125.907519630806-2.90751963080624
55117120.184391560981-3.18439156098148
56114116.073409856671-2.07340985667074
57111112.132200582235-1.13220058223531
58112112.742794066145-0.742794066144982
59144147.128318378224-3.12831837822448
60150154.515783792309-4.51578379230941
61149150.990646203661-1.99064620366081
62134135.795729137937-1.79572913793698
63123124.349861218689-1.34986121868855
64116118.845590794277-2.84559079427664
65117115.6769830256051.32301697439545
66111110.1723243807920.82767561920844
67105102.1104278920182.8895721079817
6810297.99944618770754.00055381229244
699590.71713917191714.28286082808286
709388.32074468860734.6792553113927
71124126.047366742042-2.04736674204180
72130134.437161478533-4.43716147853323
73124127.236816374394-3.23681637439413


Parameters (Session):
par1 = 1 ; par2 = Include Monthly Dummies ; par3 = Linear Trend ;
Parameters (R input):
par1 = 1 ; par2 = Include Monthly Dummies ; par3 = Linear Trend ;
R code (references can be found in the software module):
library(lattice)
par1 <- as.numeric(par1)
x <- t(y)
k <- length(x[1,])
n <- length(x[,1])
x1 <- cbind(x[,par1], x[,1:k!=par1])
mycolnames <- c(colnames(x)[par1], colnames(x)[1:k!=par1])
colnames(x1) <- mycolnames #colnames(x)[par1]
x <- x1
if (par3 == 'First Differences'){
x2 <- array(0, dim=c(n-1,k), dimnames=list(1:(n-1), paste('(1-B)',colnames(x),sep='')))
for (i in 1:n-1) {
for (j in 1:k) {
x2[i,j] <- x[i+1,j] - x[i,j]
}
}
x <- x2
}
if (par2 == 'Include Monthly Dummies'){
x2 <- array(0, dim=c(n,11), dimnames=list(1:n, paste('M', seq(1:11), sep ='')))
for (i in 1:11){
x2[seq(i,n,12),i] <- 1
}
x <- cbind(x, x2)
}
if (par2 == 'Include Quarterly Dummies'){
x2 <- array(0, dim=c(n,3), dimnames=list(1:n, paste('Q', seq(1:3), sep ='')))
for (i in 1:3){
x2[seq(i,n,4),i] <- 1
}
x <- cbind(x, x2)
}
k <- length(x[1,])
if (par3 == 'Linear Trend'){
x <- cbind(x, c(1:n))
colnames(x)[k+1] <- 't'
}
x
k <- length(x[1,])
df <- as.data.frame(x)
(mylm <- lm(df))
(mysum <- summary(mylm))
bitmap(file='test0.png')
plot(x[,1], type='l', main='Actuals and Interpolation', ylab='value of Actuals and Interpolation (dots)', xlab='time or index')
points(x[,1]-mysum$resid)
grid()
dev.off()
bitmap(file='test1.png')
plot(mysum$resid, type='b', pch=19, main='Residuals', ylab='value of Residuals', xlab='time or index')
grid()
dev.off()
bitmap(file='test2.png')
hist(mysum$resid, main='Residual Histogram', xlab='values of Residuals')
grid()
dev.off()
bitmap(file='test3.png')
densityplot(~mysum$resid,col='black',main='Residual Density Plot', xlab='values of Residuals')
dev.off()
bitmap(file='test4.png')
qqnorm(mysum$resid, main='Residual Normal Q-Q Plot')
grid()
dev.off()
(myerror <- as.ts(mysum$resid))
bitmap(file='test5.png')
dum <- cbind(lag(myerror,k=1),myerror)
dum
dum1 <- dum[2:length(myerror),]
dum1
z <- as.data.frame(dum1)
z
plot(z,main=paste('Residual Lag plot, lowess, and regression line'), ylab='values of Residuals', xlab='lagged values of Residuals')
lines(lowess(z))
abline(lm(z))
grid()
dev.off()
bitmap(file='test6.png')
acf(mysum$resid, lag.max=length(mysum$resid)/2, main='Residual Autocorrelation Function')
grid()
dev.off()
bitmap(file='test7.png')
pacf(mysum$resid, lag.max=length(mysum$resid)/2, main='Residual Partial Autocorrelation Function')
grid()
dev.off()
bitmap(file='test8.png')
opar <- par(mfrow = c(2,2), oma = c(0, 0, 1.1, 0))
plot(mylm, las = 1, sub='Residual Diagnostics')
par(opar)
dev.off()
load(file='createtable')
a<-table.start()
a<-table.row.start(a)
a<-table.element(a, 'Multiple Linear Regression - Estimated Regression Equation', 1, TRUE)
a<-table.row.end(a)
myeq <- colnames(x)[1]
myeq <- paste(myeq, '[t] = ', sep='')
for (i in 1:k){
if (mysum$coefficients[i,1] > 0) myeq <- paste(myeq, '+', '')
myeq <- paste(myeq, mysum$coefficients[i,1], sep=' ')
if (rownames(mysum$coefficients)[i] != '(Intercept)') {
myeq <- paste(myeq, rownames(mysum$coefficients)[i], sep='')
if (rownames(mysum$coefficients)[i] != 't') myeq <- paste(myeq, '[t]', sep='')
}
}
myeq <- paste(myeq, ' + e[t]')
a<-table.row.start(a)
a<-table.element(a, myeq)
a<-table.row.end(a)
a<-table.end(a)
table.save(a,file='mytable1.tab')
a<-table.start()
a<-table.row.start(a)
a<-table.element(a,hyperlink('ols1.htm','Multiple Linear Regression - Ordinary Least Squares',''), 6, TRUE)
a<-table.row.end(a)
a<-table.row.start(a)
a<-table.element(a,'Variable',header=TRUE)
a<-table.element(a,'Parameter',header=TRUE)
a<-table.element(a,'S.D.',header=TRUE)
a<-table.element(a,'T-STAT
H0: parameter = 0',header=TRUE)
a<-table.element(a,'2-tail p-value',header=TRUE)
a<-table.element(a,'1-tail p-value',header=TRUE)
a<-table.row.end(a)
for (i in 1:k){
a<-table.row.start(a)
a<-table.element(a,rownames(mysum$coefficients)[i],header=TRUE)
a<-table.element(a,mysum$coefficients[i,1])
a<-table.element(a, round(mysum$coefficients[i,2],6))
a<-table.element(a, round(mysum$coefficients[i,3],4))
a<-table.element(a, round(mysum$coefficients[i,4],6))
a<-table.element(a, round(mysum$coefficients[i,4]/2,6))
a<-table.row.end(a)
}
a<-table.end(a)
table.save(a,file='mytable2.tab')
a<-table.start()
a<-table.row.start(a)
a<-table.element(a, 'Multiple Linear Regression - Regression Statistics', 2, TRUE)
a<-table.row.end(a)
a<-table.row.start(a)
a<-table.element(a, 'Multiple R',1,TRUE)
a<-table.element(a, sqrt(mysum$r.squared))
a<-table.row.end(a)
a<-table.row.start(a)
a<-table.element(a, 'R-squared',1,TRUE)
a<-table.element(a, mysum$r.squared)
a<-table.row.end(a)
a<-table.row.start(a)
a<-table.element(a, 'Adjusted R-squared',1,TRUE)
a<-table.element(a, mysum$adj.r.squared)
a<-table.row.end(a)
a<-table.row.start(a)
a<-table.element(a, 'F-TEST (value)',1,TRUE)
a<-table.element(a, mysum$fstatistic[1])
a<-table.row.end(a)
a<-table.row.start(a)
a<-table.element(a, 'F-TEST (DF numerator)',1,TRUE)
a<-table.element(a, mysum$fstatistic[2])
a<-table.row.end(a)
a<-table.row.start(a)
a<-table.element(a, 'F-TEST (DF denominator)',1,TRUE)
a<-table.element(a, mysum$fstatistic[3])
a<-table.row.end(a)
a<-table.row.start(a)
a<-table.element(a, 'p-value',1,TRUE)
a<-table.element(a, 1-pf(mysum$fstatistic[1],mysum$fstatistic[2],mysum$fstatistic[3]))
a<-table.row.end(a)
a<-table.row.start(a)
a<-table.element(a, 'Multiple Linear Regression - Residual Statistics', 2, TRUE)
a<-table.row.end(a)
a<-table.row.start(a)
a<-table.element(a, 'Residual Standard Deviation',1,TRUE)
a<-table.element(a, mysum$sigma)
a<-table.row.end(a)
a<-table.row.start(a)
a<-table.element(a, 'Sum Squared Residuals',1,TRUE)
a<-table.element(a, sum(myerror*myerror))
a<-table.row.end(a)
a<-table.end(a)
table.save(a,file='mytable3.tab')
a<-table.start()
a<-table.row.start(a)
a<-table.element(a, 'Multiple Linear Regression - Actuals, Interpolation, and Residuals', 4, TRUE)
a<-table.row.end(a)
a<-table.row.start(a)
a<-table.element(a, 'Time or Index', 1, TRUE)
a<-table.element(a, 'Actuals', 1, TRUE)
a<-table.element(a, 'Interpolation
Forecast', 1, TRUE)
a<-table.element(a, 'Residuals
Prediction Error', 1, TRUE)
a<-table.row.end(a)
for (i in 1:n) {
a<-table.row.start(a)
a<-table.element(a,i, 1, TRUE)
a<-table.element(a,x[i])
a<-table.element(a,x[i]-mysum$resid[i])
a<-table.element(a,mysum$resid[i])
a<-table.row.end(a)
}
a<-table.end(a)
table.save(a,file='mytable4.tab')