Free Statistics

of Irreproducible Research!

Author's title

Author*Unverified author*
R Software Modulerwasp_multipleregression.wasp
Title produced by softwareMultiple Regression
Date of computationWed, 14 Nov 2007 16:25:11 -0700
Cite this page as followsStatistical Computations at FreeStatistics.org, Office for Research Development and Education, URL https://freestatistics.org/blog/index.php?v=date/2007/Nov/15/t1195082382yufoomn3ghzbg8i.htm/, Retrieved Sat, 04 May 2024 19:07:14 +0000
Statistical Computations at FreeStatistics.org, Office for Research Development and Education, URL https://freestatistics.org/blog/index.php?pk=5409, Retrieved Sat, 04 May 2024 19:07:14 +0000
QR Codes:

Original text written by user:
IsPrivate?No (this computation is public)
User-defined keywords
Estimated Impact260
Family? (F = Feedback message, R = changed R code, M = changed R Module, P = changed Parameters, D = changed Data)
-       [Multiple Regression] [] [2007-11-14 23:25:11] [94abaf6e1c7b1fd4f9d5e2c2d987f350] [Current]
Feedback Forum

Post a new message
Dataseries X:
128	0
123	0
118	0
112	0
105	0
102	0
131	0
149	0
145	0
132	0
122	0
119	0
116	0
111	0
104	0
100	0
93	0
91	0
119	0
139	0
134	0
124	0
113	0
109	0
109	0
106	0
101	0
98	0
93	0
91	0
122	0
139	0
140	1
132	1
117	1
114	1
113	1
110	1
107	1
103	1
98	1
98	1
137	1
148	1
147	1
139	1
130	1
128	1
127	1
123	1
118	1
114	1
108	1
111	1
151	1
159	1
158	1
148	1
138	1
137	1
136	1
133	1
126	1
120	1
114	1
116	1
153	1
162	1
161	1
149	0
139	0
135	0
130	0
127	0
122	0
117	0
112	0
113	0
149	0
157	0
157	0
147	0
137	0
132	0
125	0
123	0
117	0
114	0
111	0
112	0
144	0
150	0
149	0
134	0
123	0
116	0
117	0
111	0
105	0
102	0
95	0
93	0
124	0
130	0
124	0
115	0


Summary of compuational transaction
Raw Inputview raw input (R code)
Raw Outputview raw output of R engine
Computing time4 seconds
R Server'Gwilym Jenkins' @ 72.249.127.135

\begin{tabular}{lllllllll}
\hline
Summary of compuational transaction \tabularnewline
Raw Input & view raw input (R code)  \tabularnewline
Raw Output & view raw output of R engine  \tabularnewline
Computing time & 4 seconds \tabularnewline
R Server & 'Gwilym Jenkins' @ 72.249.127.135 \tabularnewline
\hline
\end{tabular}
%Source: https://freestatistics.org/blog/index.php?pk=5409&T=0

[TABLE]
[ROW][C]Summary of compuational transaction[/C][/ROW]
[ROW][C]Raw Input[/C][C]view raw input (R code) [/C][/ROW]
[ROW][C]Raw Output[/C][C]view raw output of R engine [/C][/ROW]
[ROW][C]Computing time[/C][C]4 seconds[/C][/ROW]
[ROW][C]R Server[/C][C]'Gwilym Jenkins' @ 72.249.127.135[/C][/ROW]
[/TABLE]
Source: https://freestatistics.org/blog/index.php?pk=5409&T=0

Globally Unique Identifier (entire table): ba.freestatistics.org/blog/index.php?pk=5409&T=0

As an alternative you can also use a QR Code:  

The GUIDs for individual cells are displayed in the table below:

Summary of compuational transaction
Raw Inputview raw input (R code)
Raw Outputview raw output of R engine
Computing time4 seconds
R Server'Gwilym Jenkins' @ 72.249.127.135


Multiple Linear Regression - Estimated Regression Equation
y[t] = + 121.124348203940 + 7.00173812282735x[t] -1.12492757821549M1[t] -4.90270535599331M2[t] -10.3471498004377M3[t] -14.5693720226600M4[t] -20.2360386893266M5[t] -20.4582609115488M6[t] + 13.2084057551178M7[t] + 24.6528501995622M8[t] + 21.8748792970259M9[t] + 12.0972946440067M10[t] + 3.62500000000001M11[t] + e[t]

\begin{tabular}{lllllllll}
\hline
Multiple Linear Regression - Estimated Regression Equation \tabularnewline
y[t] =  +  121.124348203940 +  7.00173812282735x[t] -1.12492757821549M1[t] -4.90270535599331M2[t] -10.3471498004377M3[t] -14.5693720226600M4[t] -20.2360386893266M5[t] -20.4582609115488M6[t] +  13.2084057551178M7[t] +  24.6528501995622M8[t] +  21.8748792970259M9[t] +  12.0972946440067M10[t] +  3.62500000000001M11[t]  + e[t] \tabularnewline
\hline
\end{tabular}
%Source: https://freestatistics.org/blog/index.php?pk=5409&T=1

[TABLE]
[ROW][C]Multiple Linear Regression - Estimated Regression Equation[/C][/ROW]
[ROW][C]y[t] =  +  121.124348203940 +  7.00173812282735x[t] -1.12492757821549M1[t] -4.90270535599331M2[t] -10.3471498004377M3[t] -14.5693720226600M4[t] -20.2360386893266M5[t] -20.4582609115488M6[t] +  13.2084057551178M7[t] +  24.6528501995622M8[t] +  21.8748792970259M9[t] +  12.0972946440067M10[t] +  3.62500000000001M11[t]  + e[t][/C][/ROW]
[/TABLE]
Source: https://freestatistics.org/blog/index.php?pk=5409&T=1

Globally Unique Identifier (entire table): ba.freestatistics.org/blog/index.php?pk=5409&T=1

As an alternative you can also use a QR Code:  

The GUIDs for individual cells are displayed in the table below:

Multiple Linear Regression - Estimated Regression Equation
y[t] = + 121.124348203940 + 7.00173812282735x[t] -1.12492757821549M1[t] -4.90270535599331M2[t] -10.3471498004377M3[t] -14.5693720226600M4[t] -20.2360386893266M5[t] -20.4582609115488M6[t] + 13.2084057551178M7[t] + 24.6528501995622M8[t] + 21.8748792970259M9[t] + 12.0972946440067M10[t] + 3.62500000000001M11[t] + e[t]


Multiple Linear Regression - Ordinary Least Squares
VariableParameterS.D.T-STATH0: parameter = 02-tail p-value1-tail p-value
(Intercept)121.1243482039403.50687834.539100
x7.001738122827351.9799443.53630.0006350.000317
M1-1.124927578215494.711203-0.23880.8118040.405902
M2-4.902705355993314.711203-1.04060.3007370.150368
M3-10.34714980043774.711203-2.19630.0305580.015279
M4-14.56937202266004.711203-3.09250.002620.00131
M5-20.23603868932664.711203-4.29534.3e-052.1e-05
M6-20.45826091154884.711203-4.34253.6e-051.8e-05
M713.20840575511784.7112032.80360.0061510.003076
M824.65285019956224.7112035.23281e-061e-06
M921.87487929702594.7124874.64191.1e-056e-06
M1012.09729464400674.7112032.56780.0118290.005915
M113.625000000000014.8470440.74790.456420.22821

\begin{tabular}{lllllllll}
\hline
Multiple Linear Regression - Ordinary Least Squares \tabularnewline
Variable & Parameter & S.D. & T-STATH0: parameter = 0 & 2-tail p-value & 1-tail p-value \tabularnewline
(Intercept) & 121.124348203940 & 3.506878 & 34.5391 & 0 & 0 \tabularnewline
x & 7.00173812282735 & 1.979944 & 3.5363 & 0.000635 & 0.000317 \tabularnewline
M1 & -1.12492757821549 & 4.711203 & -0.2388 & 0.811804 & 0.405902 \tabularnewline
M2 & -4.90270535599331 & 4.711203 & -1.0406 & 0.300737 & 0.150368 \tabularnewline
M3 & -10.3471498004377 & 4.711203 & -2.1963 & 0.030558 & 0.015279 \tabularnewline
M4 & -14.5693720226600 & 4.711203 & -3.0925 & 0.00262 & 0.00131 \tabularnewline
M5 & -20.2360386893266 & 4.711203 & -4.2953 & 4.3e-05 & 2.1e-05 \tabularnewline
M6 & -20.4582609115488 & 4.711203 & -4.3425 & 3.6e-05 & 1.8e-05 \tabularnewline
M7 & 13.2084057551178 & 4.711203 & 2.8036 & 0.006151 & 0.003076 \tabularnewline
M8 & 24.6528501995622 & 4.711203 & 5.2328 & 1e-06 & 1e-06 \tabularnewline
M9 & 21.8748792970259 & 4.712487 & 4.6419 & 1.1e-05 & 6e-06 \tabularnewline
M10 & 12.0972946440067 & 4.711203 & 2.5678 & 0.011829 & 0.005915 \tabularnewline
M11 & 3.62500000000001 & 4.847044 & 0.7479 & 0.45642 & 0.22821 \tabularnewline
\hline
\end{tabular}
%Source: https://freestatistics.org/blog/index.php?pk=5409&T=2

[TABLE]
[ROW][C]Multiple Linear Regression - Ordinary Least Squares[/C][/ROW]
[ROW][C]Variable[/C][C]Parameter[/C][C]S.D.[/C][C]T-STATH0: parameter = 0[/C][C]2-tail p-value[/C][C]1-tail p-value[/C][/ROW]
[ROW][C](Intercept)[/C][C]121.124348203940[/C][C]3.506878[/C][C]34.5391[/C][C]0[/C][C]0[/C][/ROW]
[ROW][C]x[/C][C]7.00173812282735[/C][C]1.979944[/C][C]3.5363[/C][C]0.000635[/C][C]0.000317[/C][/ROW]
[ROW][C]M1[/C][C]-1.12492757821549[/C][C]4.711203[/C][C]-0.2388[/C][C]0.811804[/C][C]0.405902[/C][/ROW]
[ROW][C]M2[/C][C]-4.90270535599331[/C][C]4.711203[/C][C]-1.0406[/C][C]0.300737[/C][C]0.150368[/C][/ROW]
[ROW][C]M3[/C][C]-10.3471498004377[/C][C]4.711203[/C][C]-2.1963[/C][C]0.030558[/C][C]0.015279[/C][/ROW]
[ROW][C]M4[/C][C]-14.5693720226600[/C][C]4.711203[/C][C]-3.0925[/C][C]0.00262[/C][C]0.00131[/C][/ROW]
[ROW][C]M5[/C][C]-20.2360386893266[/C][C]4.711203[/C][C]-4.2953[/C][C]4.3e-05[/C][C]2.1e-05[/C][/ROW]
[ROW][C]M6[/C][C]-20.4582609115488[/C][C]4.711203[/C][C]-4.3425[/C][C]3.6e-05[/C][C]1.8e-05[/C][/ROW]
[ROW][C]M7[/C][C]13.2084057551178[/C][C]4.711203[/C][C]2.8036[/C][C]0.006151[/C][C]0.003076[/C][/ROW]
[ROW][C]M8[/C][C]24.6528501995622[/C][C]4.711203[/C][C]5.2328[/C][C]1e-06[/C][C]1e-06[/C][/ROW]
[ROW][C]M9[/C][C]21.8748792970259[/C][C]4.712487[/C][C]4.6419[/C][C]1.1e-05[/C][C]6e-06[/C][/ROW]
[ROW][C]M10[/C][C]12.0972946440067[/C][C]4.711203[/C][C]2.5678[/C][C]0.011829[/C][C]0.005915[/C][/ROW]
[ROW][C]M11[/C][C]3.62500000000001[/C][C]4.847044[/C][C]0.7479[/C][C]0.45642[/C][C]0.22821[/C][/ROW]
[/TABLE]
Source: https://freestatistics.org/blog/index.php?pk=5409&T=2

Globally Unique Identifier (entire table): ba.freestatistics.org/blog/index.php?pk=5409&T=2

As an alternative you can also use a QR Code:  

The GUIDs for individual cells are displayed in the table below:

Multiple Linear Regression - Ordinary Least Squares
VariableParameterS.D.T-STATH0: parameter = 02-tail p-value1-tail p-value
(Intercept)121.1243482039403.50687834.539100
x7.001738122827351.9799443.53630.0006350.000317
M1-1.124927578215494.711203-0.23880.8118040.405902
M2-4.902705355993314.711203-1.04060.3007370.150368
M3-10.34714980043774.711203-2.19630.0305580.015279
M4-14.56937202266004.711203-3.09250.002620.00131
M5-20.23603868932664.711203-4.29534.3e-052.1e-05
M6-20.45826091154884.711203-4.34253.6e-051.8e-05
M713.20840575511784.7112032.80360.0061510.003076
M824.65285019956224.7112035.23281e-061e-06
M921.87487929702594.7124874.64191.1e-056e-06
M1012.09729464400674.7112032.56780.0118290.005915
M113.625000000000014.8470440.74790.456420.22821


Multiple Linear Regression - Regression Statistics
Multiple R0.859946975859105
R-squared0.73950880128922
Adjusted R-squared0.705897033713636
F-TEST (value)22.0014850342592
F-TEST (DF numerator)12
F-TEST (DF denominator)93
p-value0
Multiple Linear Regression - Residual Statistics
Residual Standard Deviation9.69408879906772
Sum Squared Residuals8739.70826091156

\begin{tabular}{lllllllll}
\hline
Multiple Linear Regression - Regression Statistics \tabularnewline
Multiple R & 0.859946975859105 \tabularnewline
R-squared & 0.73950880128922 \tabularnewline
Adjusted R-squared & 0.705897033713636 \tabularnewline
F-TEST (value) & 22.0014850342592 \tabularnewline
F-TEST (DF numerator) & 12 \tabularnewline
F-TEST (DF denominator) & 93 \tabularnewline
p-value & 0 \tabularnewline
Multiple Linear Regression - Residual Statistics \tabularnewline
Residual Standard Deviation & 9.69408879906772 \tabularnewline
Sum Squared Residuals & 8739.70826091156 \tabularnewline
\hline
\end{tabular}
%Source: https://freestatistics.org/blog/index.php?pk=5409&T=3

[TABLE]
[ROW][C]Multiple Linear Regression - Regression Statistics[/C][/ROW]
[ROW][C]Multiple R[/C][C]0.859946975859105[/C][/ROW]
[ROW][C]R-squared[/C][C]0.73950880128922[/C][/ROW]
[ROW][C]Adjusted R-squared[/C][C]0.705897033713636[/C][/ROW]
[ROW][C]F-TEST (value)[/C][C]22.0014850342592[/C][/ROW]
[ROW][C]F-TEST (DF numerator)[/C][C]12[/C][/ROW]
[ROW][C]F-TEST (DF denominator)[/C][C]93[/C][/ROW]
[ROW][C]p-value[/C][C]0[/C][/ROW]
[ROW][C]Multiple Linear Regression - Residual Statistics[/C][/ROW]
[ROW][C]Residual Standard Deviation[/C][C]9.69408879906772[/C][/ROW]
[ROW][C]Sum Squared Residuals[/C][C]8739.70826091156[/C][/ROW]
[/TABLE]
Source: https://freestatistics.org/blog/index.php?pk=5409&T=3

Globally Unique Identifier (entire table): ba.freestatistics.org/blog/index.php?pk=5409&T=3

As an alternative you can also use a QR Code:  

The GUIDs for individual cells are displayed in the table below:

Multiple Linear Regression - Regression Statistics
Multiple R0.859946975859105
R-squared0.73950880128922
Adjusted R-squared0.705897033713636
F-TEST (value)22.0014850342592
F-TEST (DF numerator)12
F-TEST (DF denominator)93
p-value0
Multiple Linear Regression - Residual Statistics
Residual Standard Deviation9.69408879906772
Sum Squared Residuals8739.70826091156


Multiple Linear Regression - Actuals, Interpolation, and Residuals
Time or IndexActualsInterpolationForecastResidualsPrediction Error
1128119.9994206257248.00057937427622
2123116.2216428479466.77835715205356
3118110.7771984035027.22280159649805
4112106.5549761812805.44502381872025
5105100.8883095146134.11169048538683
6102100.6660872923911.33391270760911
7131134.332753959058-3.33275395905761
8149145.7771984035023.22280159649796
9145142.9992275009662.00077249903436
10132133.221642847946-1.22164284794641
11122124.749348203940-2.7493482039397
12119121.124348203940-2.12434820393975
13116119.999420625724-3.99942062572427
14111116.221642847946-5.22164284794644
15104110.777198403502-6.777198403502
16100106.554976181280-6.55497618127978
1793100.888309514613-7.8883095146131
1891100.666087292391-9.66608729239089
19119134.332753959058-15.3327539590575
20139145.777198403502-6.77719840350199
21134142.999227500966-8.99922750096562
22124133.221642847946-9.22164284794645
23113124.749348203940-11.7493482039398
24109121.124348203940-12.1243482039397
25109119.999420625724-10.9994206257243
26106116.221642847946-10.2216428479464
27101110.777198403502-9.777198403502
2898106.554976181280-8.55497618127978
2993100.888309514613-7.8883095146131
3091100.666087292391-9.66608729239089
31122134.332753959058-12.3327539590575
32139145.777198403502-6.77719840350199
33140150.000965623793-10.0009656237930
34132140.223380970774-8.22338097077379
35117131.751086326767-14.7510863267671
36114128.126086326767-14.1260863267671
37113127.001158748552-14.0011587485516
38110123.223380970774-13.2233809707738
39107117.778936526329-10.7789365263293
40103113.556714304107-10.5567143041071
4198107.890047637440-9.89004763744044
4298107.667825415218-9.66782541521823
43137141.334492081885-4.33449208188489
44148152.778936526329-4.77893652632933
45147150.000965623793-3.00096562379297
46139140.223380970774-1.22338097077378
47130131.751086326767-1.75108632676710
48128128.126086326767-0.126086326767089
49127127.001158748552-0.00115874855161735
50123123.223380970774-0.223380970773783
51118117.7789365263290.221063473670653
52114113.5567143041070.443285695892881
53108107.8900476374400.109952362559556
54111107.6678254152183.33217458478177
55151141.3344920818859.66550791811512
56159152.7789365263296.22106347367067
57158150.0009656237937.99903437620703
58148140.2233809707747.77661902922622
59138131.7510863267676.2489136732329
60137128.1260863267678.87391367323291
61136127.0011587485528.99884125144838
62133123.2233809707749.77661902922622
63126117.7789365263298.22106347367065
64120113.5567143041076.44328569589288
65114107.8900476374406.10995236255956
66116107.6678254152188.33217458478177
67153141.33449208188511.6655079181151
68162152.7789365263299.22106347367067
69161150.00096562379310.9990343762070
70149133.22164284794615.7783571520535
71139124.74934820394014.2506517960602
72135121.12434820394013.8756517960603
73130119.99942062572410.0005793742757
74127116.22164284794610.7783571520536
75122110.77719840350211.222801596498
76117106.55497618128010.4450238187202
77112100.88830951461311.1116904853869
78113100.66608729239112.3339127076091
79149134.33275395905814.6672460409424
80157145.77719840350211.222801596498
81157142.99922750096614.0007724990344
82147133.22164284794613.7783571520535
83137124.74934820394012.2506517960602
84132121.12434820394010.8756517960603
85125119.9994206257245.00057937427573
86123116.2216428479466.77835715205356
87117110.7771984035026.222801596498
88114106.5549761812807.44502381872022
89111100.88830951461310.1116904853869
90112100.66608729239111.3339127076091
91144134.3327539590589.66724604094245
92150145.7771984035024.222801596498
93149142.9992275009666.00077249903437
94134133.2216428479460.778357152053557
95123124.749348203940-1.74934820393975
96116121.124348203940-5.12434820393974
97117119.999420625724-2.99942062572427
98111116.221642847946-5.22164284794644
99105110.777198403502-5.77719840350200
100102106.554976181280-4.55497618127978
10195100.888309514613-5.8883095146131
10293100.666087292391-7.6660872923909
103124134.332753959058-10.3327539590575
104130145.777198403502-15.777198403502
105124142.999227500966-18.9992275009656
106115133.221642847946-18.2216428479464

\begin{tabular}{lllllllll}
\hline
Multiple Linear Regression - Actuals, Interpolation, and Residuals \tabularnewline
Time or Index & Actuals & InterpolationForecast & ResidualsPrediction Error \tabularnewline
1 & 128 & 119.999420625724 & 8.00057937427622 \tabularnewline
2 & 123 & 116.221642847946 & 6.77835715205356 \tabularnewline
3 & 118 & 110.777198403502 & 7.22280159649805 \tabularnewline
4 & 112 & 106.554976181280 & 5.44502381872025 \tabularnewline
5 & 105 & 100.888309514613 & 4.11169048538683 \tabularnewline
6 & 102 & 100.666087292391 & 1.33391270760911 \tabularnewline
7 & 131 & 134.332753959058 & -3.33275395905761 \tabularnewline
8 & 149 & 145.777198403502 & 3.22280159649796 \tabularnewline
9 & 145 & 142.999227500966 & 2.00077249903436 \tabularnewline
10 & 132 & 133.221642847946 & -1.22164284794641 \tabularnewline
11 & 122 & 124.749348203940 & -2.7493482039397 \tabularnewline
12 & 119 & 121.124348203940 & -2.12434820393975 \tabularnewline
13 & 116 & 119.999420625724 & -3.99942062572427 \tabularnewline
14 & 111 & 116.221642847946 & -5.22164284794644 \tabularnewline
15 & 104 & 110.777198403502 & -6.777198403502 \tabularnewline
16 & 100 & 106.554976181280 & -6.55497618127978 \tabularnewline
17 & 93 & 100.888309514613 & -7.8883095146131 \tabularnewline
18 & 91 & 100.666087292391 & -9.66608729239089 \tabularnewline
19 & 119 & 134.332753959058 & -15.3327539590575 \tabularnewline
20 & 139 & 145.777198403502 & -6.77719840350199 \tabularnewline
21 & 134 & 142.999227500966 & -8.99922750096562 \tabularnewline
22 & 124 & 133.221642847946 & -9.22164284794645 \tabularnewline
23 & 113 & 124.749348203940 & -11.7493482039398 \tabularnewline
24 & 109 & 121.124348203940 & -12.1243482039397 \tabularnewline
25 & 109 & 119.999420625724 & -10.9994206257243 \tabularnewline
26 & 106 & 116.221642847946 & -10.2216428479464 \tabularnewline
27 & 101 & 110.777198403502 & -9.777198403502 \tabularnewline
28 & 98 & 106.554976181280 & -8.55497618127978 \tabularnewline
29 & 93 & 100.888309514613 & -7.8883095146131 \tabularnewline
30 & 91 & 100.666087292391 & -9.66608729239089 \tabularnewline
31 & 122 & 134.332753959058 & -12.3327539590575 \tabularnewline
32 & 139 & 145.777198403502 & -6.77719840350199 \tabularnewline
33 & 140 & 150.000965623793 & -10.0009656237930 \tabularnewline
34 & 132 & 140.223380970774 & -8.22338097077379 \tabularnewline
35 & 117 & 131.751086326767 & -14.7510863267671 \tabularnewline
36 & 114 & 128.126086326767 & -14.1260863267671 \tabularnewline
37 & 113 & 127.001158748552 & -14.0011587485516 \tabularnewline
38 & 110 & 123.223380970774 & -13.2233809707738 \tabularnewline
39 & 107 & 117.778936526329 & -10.7789365263293 \tabularnewline
40 & 103 & 113.556714304107 & -10.5567143041071 \tabularnewline
41 & 98 & 107.890047637440 & -9.89004763744044 \tabularnewline
42 & 98 & 107.667825415218 & -9.66782541521823 \tabularnewline
43 & 137 & 141.334492081885 & -4.33449208188489 \tabularnewline
44 & 148 & 152.778936526329 & -4.77893652632933 \tabularnewline
45 & 147 & 150.000965623793 & -3.00096562379297 \tabularnewline
46 & 139 & 140.223380970774 & -1.22338097077378 \tabularnewline
47 & 130 & 131.751086326767 & -1.75108632676710 \tabularnewline
48 & 128 & 128.126086326767 & -0.126086326767089 \tabularnewline
49 & 127 & 127.001158748552 & -0.00115874855161735 \tabularnewline
50 & 123 & 123.223380970774 & -0.223380970773783 \tabularnewline
51 & 118 & 117.778936526329 & 0.221063473670653 \tabularnewline
52 & 114 & 113.556714304107 & 0.443285695892881 \tabularnewline
53 & 108 & 107.890047637440 & 0.109952362559556 \tabularnewline
54 & 111 & 107.667825415218 & 3.33217458478177 \tabularnewline
55 & 151 & 141.334492081885 & 9.66550791811512 \tabularnewline
56 & 159 & 152.778936526329 & 6.22106347367067 \tabularnewline
57 & 158 & 150.000965623793 & 7.99903437620703 \tabularnewline
58 & 148 & 140.223380970774 & 7.77661902922622 \tabularnewline
59 & 138 & 131.751086326767 & 6.2489136732329 \tabularnewline
60 & 137 & 128.126086326767 & 8.87391367323291 \tabularnewline
61 & 136 & 127.001158748552 & 8.99884125144838 \tabularnewline
62 & 133 & 123.223380970774 & 9.77661902922622 \tabularnewline
63 & 126 & 117.778936526329 & 8.22106347367065 \tabularnewline
64 & 120 & 113.556714304107 & 6.44328569589288 \tabularnewline
65 & 114 & 107.890047637440 & 6.10995236255956 \tabularnewline
66 & 116 & 107.667825415218 & 8.33217458478177 \tabularnewline
67 & 153 & 141.334492081885 & 11.6655079181151 \tabularnewline
68 & 162 & 152.778936526329 & 9.22106347367067 \tabularnewline
69 & 161 & 150.000965623793 & 10.9990343762070 \tabularnewline
70 & 149 & 133.221642847946 & 15.7783571520535 \tabularnewline
71 & 139 & 124.749348203940 & 14.2506517960602 \tabularnewline
72 & 135 & 121.124348203940 & 13.8756517960603 \tabularnewline
73 & 130 & 119.999420625724 & 10.0005793742757 \tabularnewline
74 & 127 & 116.221642847946 & 10.7783571520536 \tabularnewline
75 & 122 & 110.777198403502 & 11.222801596498 \tabularnewline
76 & 117 & 106.554976181280 & 10.4450238187202 \tabularnewline
77 & 112 & 100.888309514613 & 11.1116904853869 \tabularnewline
78 & 113 & 100.666087292391 & 12.3339127076091 \tabularnewline
79 & 149 & 134.332753959058 & 14.6672460409424 \tabularnewline
80 & 157 & 145.777198403502 & 11.222801596498 \tabularnewline
81 & 157 & 142.999227500966 & 14.0007724990344 \tabularnewline
82 & 147 & 133.221642847946 & 13.7783571520535 \tabularnewline
83 & 137 & 124.749348203940 & 12.2506517960602 \tabularnewline
84 & 132 & 121.124348203940 & 10.8756517960603 \tabularnewline
85 & 125 & 119.999420625724 & 5.00057937427573 \tabularnewline
86 & 123 & 116.221642847946 & 6.77835715205356 \tabularnewline
87 & 117 & 110.777198403502 & 6.222801596498 \tabularnewline
88 & 114 & 106.554976181280 & 7.44502381872022 \tabularnewline
89 & 111 & 100.888309514613 & 10.1116904853869 \tabularnewline
90 & 112 & 100.666087292391 & 11.3339127076091 \tabularnewline
91 & 144 & 134.332753959058 & 9.66724604094245 \tabularnewline
92 & 150 & 145.777198403502 & 4.222801596498 \tabularnewline
93 & 149 & 142.999227500966 & 6.00077249903437 \tabularnewline
94 & 134 & 133.221642847946 & 0.778357152053557 \tabularnewline
95 & 123 & 124.749348203940 & -1.74934820393975 \tabularnewline
96 & 116 & 121.124348203940 & -5.12434820393974 \tabularnewline
97 & 117 & 119.999420625724 & -2.99942062572427 \tabularnewline
98 & 111 & 116.221642847946 & -5.22164284794644 \tabularnewline
99 & 105 & 110.777198403502 & -5.77719840350200 \tabularnewline
100 & 102 & 106.554976181280 & -4.55497618127978 \tabularnewline
101 & 95 & 100.888309514613 & -5.8883095146131 \tabularnewline
102 & 93 & 100.666087292391 & -7.6660872923909 \tabularnewline
103 & 124 & 134.332753959058 & -10.3327539590575 \tabularnewline
104 & 130 & 145.777198403502 & -15.777198403502 \tabularnewline
105 & 124 & 142.999227500966 & -18.9992275009656 \tabularnewline
106 & 115 & 133.221642847946 & -18.2216428479464 \tabularnewline
\hline
\end{tabular}
%Source: https://freestatistics.org/blog/index.php?pk=5409&T=4

[TABLE]
[ROW][C]Multiple Linear Regression - Actuals, Interpolation, and Residuals[/C][/ROW]
[ROW][C]Time or Index[/C][C]Actuals[/C][C]InterpolationForecast[/C][C]ResidualsPrediction Error[/C][/ROW]
[ROW][C]1[/C][C]128[/C][C]119.999420625724[/C][C]8.00057937427622[/C][/ROW]
[ROW][C]2[/C][C]123[/C][C]116.221642847946[/C][C]6.77835715205356[/C][/ROW]
[ROW][C]3[/C][C]118[/C][C]110.777198403502[/C][C]7.22280159649805[/C][/ROW]
[ROW][C]4[/C][C]112[/C][C]106.554976181280[/C][C]5.44502381872025[/C][/ROW]
[ROW][C]5[/C][C]105[/C][C]100.888309514613[/C][C]4.11169048538683[/C][/ROW]
[ROW][C]6[/C][C]102[/C][C]100.666087292391[/C][C]1.33391270760911[/C][/ROW]
[ROW][C]7[/C][C]131[/C][C]134.332753959058[/C][C]-3.33275395905761[/C][/ROW]
[ROW][C]8[/C][C]149[/C][C]145.777198403502[/C][C]3.22280159649796[/C][/ROW]
[ROW][C]9[/C][C]145[/C][C]142.999227500966[/C][C]2.00077249903436[/C][/ROW]
[ROW][C]10[/C][C]132[/C][C]133.221642847946[/C][C]-1.22164284794641[/C][/ROW]
[ROW][C]11[/C][C]122[/C][C]124.749348203940[/C][C]-2.7493482039397[/C][/ROW]
[ROW][C]12[/C][C]119[/C][C]121.124348203940[/C][C]-2.12434820393975[/C][/ROW]
[ROW][C]13[/C][C]116[/C][C]119.999420625724[/C][C]-3.99942062572427[/C][/ROW]
[ROW][C]14[/C][C]111[/C][C]116.221642847946[/C][C]-5.22164284794644[/C][/ROW]
[ROW][C]15[/C][C]104[/C][C]110.777198403502[/C][C]-6.777198403502[/C][/ROW]
[ROW][C]16[/C][C]100[/C][C]106.554976181280[/C][C]-6.55497618127978[/C][/ROW]
[ROW][C]17[/C][C]93[/C][C]100.888309514613[/C][C]-7.8883095146131[/C][/ROW]
[ROW][C]18[/C][C]91[/C][C]100.666087292391[/C][C]-9.66608729239089[/C][/ROW]
[ROW][C]19[/C][C]119[/C][C]134.332753959058[/C][C]-15.3327539590575[/C][/ROW]
[ROW][C]20[/C][C]139[/C][C]145.777198403502[/C][C]-6.77719840350199[/C][/ROW]
[ROW][C]21[/C][C]134[/C][C]142.999227500966[/C][C]-8.99922750096562[/C][/ROW]
[ROW][C]22[/C][C]124[/C][C]133.221642847946[/C][C]-9.22164284794645[/C][/ROW]
[ROW][C]23[/C][C]113[/C][C]124.749348203940[/C][C]-11.7493482039398[/C][/ROW]
[ROW][C]24[/C][C]109[/C][C]121.124348203940[/C][C]-12.1243482039397[/C][/ROW]
[ROW][C]25[/C][C]109[/C][C]119.999420625724[/C][C]-10.9994206257243[/C][/ROW]
[ROW][C]26[/C][C]106[/C][C]116.221642847946[/C][C]-10.2216428479464[/C][/ROW]
[ROW][C]27[/C][C]101[/C][C]110.777198403502[/C][C]-9.777198403502[/C][/ROW]
[ROW][C]28[/C][C]98[/C][C]106.554976181280[/C][C]-8.55497618127978[/C][/ROW]
[ROW][C]29[/C][C]93[/C][C]100.888309514613[/C][C]-7.8883095146131[/C][/ROW]
[ROW][C]30[/C][C]91[/C][C]100.666087292391[/C][C]-9.66608729239089[/C][/ROW]
[ROW][C]31[/C][C]122[/C][C]134.332753959058[/C][C]-12.3327539590575[/C][/ROW]
[ROW][C]32[/C][C]139[/C][C]145.777198403502[/C][C]-6.77719840350199[/C][/ROW]
[ROW][C]33[/C][C]140[/C][C]150.000965623793[/C][C]-10.0009656237930[/C][/ROW]
[ROW][C]34[/C][C]132[/C][C]140.223380970774[/C][C]-8.22338097077379[/C][/ROW]
[ROW][C]35[/C][C]117[/C][C]131.751086326767[/C][C]-14.7510863267671[/C][/ROW]
[ROW][C]36[/C][C]114[/C][C]128.126086326767[/C][C]-14.1260863267671[/C][/ROW]
[ROW][C]37[/C][C]113[/C][C]127.001158748552[/C][C]-14.0011587485516[/C][/ROW]
[ROW][C]38[/C][C]110[/C][C]123.223380970774[/C][C]-13.2233809707738[/C][/ROW]
[ROW][C]39[/C][C]107[/C][C]117.778936526329[/C][C]-10.7789365263293[/C][/ROW]
[ROW][C]40[/C][C]103[/C][C]113.556714304107[/C][C]-10.5567143041071[/C][/ROW]
[ROW][C]41[/C][C]98[/C][C]107.890047637440[/C][C]-9.89004763744044[/C][/ROW]
[ROW][C]42[/C][C]98[/C][C]107.667825415218[/C][C]-9.66782541521823[/C][/ROW]
[ROW][C]43[/C][C]137[/C][C]141.334492081885[/C][C]-4.33449208188489[/C][/ROW]
[ROW][C]44[/C][C]148[/C][C]152.778936526329[/C][C]-4.77893652632933[/C][/ROW]
[ROW][C]45[/C][C]147[/C][C]150.000965623793[/C][C]-3.00096562379297[/C][/ROW]
[ROW][C]46[/C][C]139[/C][C]140.223380970774[/C][C]-1.22338097077378[/C][/ROW]
[ROW][C]47[/C][C]130[/C][C]131.751086326767[/C][C]-1.75108632676710[/C][/ROW]
[ROW][C]48[/C][C]128[/C][C]128.126086326767[/C][C]-0.126086326767089[/C][/ROW]
[ROW][C]49[/C][C]127[/C][C]127.001158748552[/C][C]-0.00115874855161735[/C][/ROW]
[ROW][C]50[/C][C]123[/C][C]123.223380970774[/C][C]-0.223380970773783[/C][/ROW]
[ROW][C]51[/C][C]118[/C][C]117.778936526329[/C][C]0.221063473670653[/C][/ROW]
[ROW][C]52[/C][C]114[/C][C]113.556714304107[/C][C]0.443285695892881[/C][/ROW]
[ROW][C]53[/C][C]108[/C][C]107.890047637440[/C][C]0.109952362559556[/C][/ROW]
[ROW][C]54[/C][C]111[/C][C]107.667825415218[/C][C]3.33217458478177[/C][/ROW]
[ROW][C]55[/C][C]151[/C][C]141.334492081885[/C][C]9.66550791811512[/C][/ROW]
[ROW][C]56[/C][C]159[/C][C]152.778936526329[/C][C]6.22106347367067[/C][/ROW]
[ROW][C]57[/C][C]158[/C][C]150.000965623793[/C][C]7.99903437620703[/C][/ROW]
[ROW][C]58[/C][C]148[/C][C]140.223380970774[/C][C]7.77661902922622[/C][/ROW]
[ROW][C]59[/C][C]138[/C][C]131.751086326767[/C][C]6.2489136732329[/C][/ROW]
[ROW][C]60[/C][C]137[/C][C]128.126086326767[/C][C]8.87391367323291[/C][/ROW]
[ROW][C]61[/C][C]136[/C][C]127.001158748552[/C][C]8.99884125144838[/C][/ROW]
[ROW][C]62[/C][C]133[/C][C]123.223380970774[/C][C]9.77661902922622[/C][/ROW]
[ROW][C]63[/C][C]126[/C][C]117.778936526329[/C][C]8.22106347367065[/C][/ROW]
[ROW][C]64[/C][C]120[/C][C]113.556714304107[/C][C]6.44328569589288[/C][/ROW]
[ROW][C]65[/C][C]114[/C][C]107.890047637440[/C][C]6.10995236255956[/C][/ROW]
[ROW][C]66[/C][C]116[/C][C]107.667825415218[/C][C]8.33217458478177[/C][/ROW]
[ROW][C]67[/C][C]153[/C][C]141.334492081885[/C][C]11.6655079181151[/C][/ROW]
[ROW][C]68[/C][C]162[/C][C]152.778936526329[/C][C]9.22106347367067[/C][/ROW]
[ROW][C]69[/C][C]161[/C][C]150.000965623793[/C][C]10.9990343762070[/C][/ROW]
[ROW][C]70[/C][C]149[/C][C]133.221642847946[/C][C]15.7783571520535[/C][/ROW]
[ROW][C]71[/C][C]139[/C][C]124.749348203940[/C][C]14.2506517960602[/C][/ROW]
[ROW][C]72[/C][C]135[/C][C]121.124348203940[/C][C]13.8756517960603[/C][/ROW]
[ROW][C]73[/C][C]130[/C][C]119.999420625724[/C][C]10.0005793742757[/C][/ROW]
[ROW][C]74[/C][C]127[/C][C]116.221642847946[/C][C]10.7783571520536[/C][/ROW]
[ROW][C]75[/C][C]122[/C][C]110.777198403502[/C][C]11.222801596498[/C][/ROW]
[ROW][C]76[/C][C]117[/C][C]106.554976181280[/C][C]10.4450238187202[/C][/ROW]
[ROW][C]77[/C][C]112[/C][C]100.888309514613[/C][C]11.1116904853869[/C][/ROW]
[ROW][C]78[/C][C]113[/C][C]100.666087292391[/C][C]12.3339127076091[/C][/ROW]
[ROW][C]79[/C][C]149[/C][C]134.332753959058[/C][C]14.6672460409424[/C][/ROW]
[ROW][C]80[/C][C]157[/C][C]145.777198403502[/C][C]11.222801596498[/C][/ROW]
[ROW][C]81[/C][C]157[/C][C]142.999227500966[/C][C]14.0007724990344[/C][/ROW]
[ROW][C]82[/C][C]147[/C][C]133.221642847946[/C][C]13.7783571520535[/C][/ROW]
[ROW][C]83[/C][C]137[/C][C]124.749348203940[/C][C]12.2506517960602[/C][/ROW]
[ROW][C]84[/C][C]132[/C][C]121.124348203940[/C][C]10.8756517960603[/C][/ROW]
[ROW][C]85[/C][C]125[/C][C]119.999420625724[/C][C]5.00057937427573[/C][/ROW]
[ROW][C]86[/C][C]123[/C][C]116.221642847946[/C][C]6.77835715205356[/C][/ROW]
[ROW][C]87[/C][C]117[/C][C]110.777198403502[/C][C]6.222801596498[/C][/ROW]
[ROW][C]88[/C][C]114[/C][C]106.554976181280[/C][C]7.44502381872022[/C][/ROW]
[ROW][C]89[/C][C]111[/C][C]100.888309514613[/C][C]10.1116904853869[/C][/ROW]
[ROW][C]90[/C][C]112[/C][C]100.666087292391[/C][C]11.3339127076091[/C][/ROW]
[ROW][C]91[/C][C]144[/C][C]134.332753959058[/C][C]9.66724604094245[/C][/ROW]
[ROW][C]92[/C][C]150[/C][C]145.777198403502[/C][C]4.222801596498[/C][/ROW]
[ROW][C]93[/C][C]149[/C][C]142.999227500966[/C][C]6.00077249903437[/C][/ROW]
[ROW][C]94[/C][C]134[/C][C]133.221642847946[/C][C]0.778357152053557[/C][/ROW]
[ROW][C]95[/C][C]123[/C][C]124.749348203940[/C][C]-1.74934820393975[/C][/ROW]
[ROW][C]96[/C][C]116[/C][C]121.124348203940[/C][C]-5.12434820393974[/C][/ROW]
[ROW][C]97[/C][C]117[/C][C]119.999420625724[/C][C]-2.99942062572427[/C][/ROW]
[ROW][C]98[/C][C]111[/C][C]116.221642847946[/C][C]-5.22164284794644[/C][/ROW]
[ROW][C]99[/C][C]105[/C][C]110.777198403502[/C][C]-5.77719840350200[/C][/ROW]
[ROW][C]100[/C][C]102[/C][C]106.554976181280[/C][C]-4.55497618127978[/C][/ROW]
[ROW][C]101[/C][C]95[/C][C]100.888309514613[/C][C]-5.8883095146131[/C][/ROW]
[ROW][C]102[/C][C]93[/C][C]100.666087292391[/C][C]-7.6660872923909[/C][/ROW]
[ROW][C]103[/C][C]124[/C][C]134.332753959058[/C][C]-10.3327539590575[/C][/ROW]
[ROW][C]104[/C][C]130[/C][C]145.777198403502[/C][C]-15.777198403502[/C][/ROW]
[ROW][C]105[/C][C]124[/C][C]142.999227500966[/C][C]-18.9992275009656[/C][/ROW]
[ROW][C]106[/C][C]115[/C][C]133.221642847946[/C][C]-18.2216428479464[/C][/ROW]
[/TABLE]
Source: https://freestatistics.org/blog/index.php?pk=5409&T=4

Globally Unique Identifier (entire table): ba.freestatistics.org/blog/index.php?pk=5409&T=4

As an alternative you can also use a QR Code:  

The GUIDs for individual cells are displayed in the table below:

Multiple Linear Regression - Actuals, Interpolation, and Residuals
Time or IndexActualsInterpolationForecastResidualsPrediction Error
1128119.9994206257248.00057937427622
2123116.2216428479466.77835715205356
3118110.7771984035027.22280159649805
4112106.5549761812805.44502381872025
5105100.8883095146134.11169048538683
6102100.6660872923911.33391270760911
7131134.332753959058-3.33275395905761
8149145.7771984035023.22280159649796
9145142.9992275009662.00077249903436
10132133.221642847946-1.22164284794641
11122124.749348203940-2.7493482039397
12119121.124348203940-2.12434820393975
13116119.999420625724-3.99942062572427
14111116.221642847946-5.22164284794644
15104110.777198403502-6.777198403502
16100106.554976181280-6.55497618127978
1793100.888309514613-7.8883095146131
1891100.666087292391-9.66608729239089
19119134.332753959058-15.3327539590575
20139145.777198403502-6.77719840350199
21134142.999227500966-8.99922750096562
22124133.221642847946-9.22164284794645
23113124.749348203940-11.7493482039398
24109121.124348203940-12.1243482039397
25109119.999420625724-10.9994206257243
26106116.221642847946-10.2216428479464
27101110.777198403502-9.777198403502
2898106.554976181280-8.55497618127978
2993100.888309514613-7.8883095146131
3091100.666087292391-9.66608729239089
31122134.332753959058-12.3327539590575
32139145.777198403502-6.77719840350199
33140150.000965623793-10.0009656237930
34132140.223380970774-8.22338097077379
35117131.751086326767-14.7510863267671
36114128.126086326767-14.1260863267671
37113127.001158748552-14.0011587485516
38110123.223380970774-13.2233809707738
39107117.778936526329-10.7789365263293
40103113.556714304107-10.5567143041071
4198107.890047637440-9.89004763744044
4298107.667825415218-9.66782541521823
43137141.334492081885-4.33449208188489
44148152.778936526329-4.77893652632933
45147150.000965623793-3.00096562379297
46139140.223380970774-1.22338097077378
47130131.751086326767-1.75108632676710
48128128.126086326767-0.126086326767089
49127127.001158748552-0.00115874855161735
50123123.223380970774-0.223380970773783
51118117.7789365263290.221063473670653
52114113.5567143041070.443285695892881
53108107.8900476374400.109952362559556
54111107.6678254152183.33217458478177
55151141.3344920818859.66550791811512
56159152.7789365263296.22106347367067
57158150.0009656237937.99903437620703
58148140.2233809707747.77661902922622
59138131.7510863267676.2489136732329
60137128.1260863267678.87391367323291
61136127.0011587485528.99884125144838
62133123.2233809707749.77661902922622
63126117.7789365263298.22106347367065
64120113.5567143041076.44328569589288
65114107.8900476374406.10995236255956
66116107.6678254152188.33217458478177
67153141.33449208188511.6655079181151
68162152.7789365263299.22106347367067
69161150.00096562379310.9990343762070
70149133.22164284794615.7783571520535
71139124.74934820394014.2506517960602
72135121.12434820394013.8756517960603
73130119.99942062572410.0005793742757
74127116.22164284794610.7783571520536
75122110.77719840350211.222801596498
76117106.55497618128010.4450238187202
77112100.88830951461311.1116904853869
78113100.66608729239112.3339127076091
79149134.33275395905814.6672460409424
80157145.77719840350211.222801596498
81157142.99922750096614.0007724990344
82147133.22164284794613.7783571520535
83137124.74934820394012.2506517960602
84132121.12434820394010.8756517960603
85125119.9994206257245.00057937427573
86123116.2216428479466.77835715205356
87117110.7771984035026.222801596498
88114106.5549761812807.44502381872022
89111100.88830951461310.1116904853869
90112100.66608729239111.3339127076091
91144134.3327539590589.66724604094245
92150145.7771984035024.222801596498
93149142.9992275009666.00077249903437
94134133.2216428479460.778357152053557
95123124.749348203940-1.74934820393975
96116121.124348203940-5.12434820393974
97117119.999420625724-2.99942062572427
98111116.221642847946-5.22164284794644
99105110.777198403502-5.77719840350200
100102106.554976181280-4.55497618127978
10195100.888309514613-5.8883095146131
10293100.666087292391-7.6660872923909
103124134.332753959058-10.3327539590575
104130145.777198403502-15.777198403502
105124142.999227500966-18.9992275009656
106115133.221642847946-18.2216428479464


Parameters (Session):
par1 = 1 ; par2 = Include Monthly Dummies ; par3 = No Linear Trend ;
Parameters (R input):
par1 = 1 ; par2 = Include Monthly Dummies ; par3 = No Linear Trend ;
R code (references can be found in the software module):
library(lattice)
par1 <- as.numeric(par1)
x <- t(y)
k <- length(x[1,])
n <- length(x[,1])
x1 <- cbind(x[,par1], x[,1:k!=par1])
mycolnames <- c(colnames(x)[par1], colnames(x)[1:k!=par1])
colnames(x1) <- mycolnames #colnames(x)[par1]
x <- x1
if (par3 == 'First Differences'){
x2 <- array(0, dim=c(n-1,k), dimnames=list(1:(n-1), paste('(1-B)',colnames(x),sep='')))
for (i in 1:n-1) {
for (j in 1:k) {
x2[i,j] <- x[i+1,j] - x[i,j]
}
}
x <- x2
}
if (par2 == 'Include Monthly Dummies'){
x2 <- array(0, dim=c(n,11), dimnames=list(1:n, paste('M', seq(1:11), sep ='')))
for (i in 1:11){
x2[seq(i,n,12),i] <- 1
}
x <- cbind(x, x2)
}
if (par2 == 'Include Quarterly Dummies'){
x2 <- array(0, dim=c(n,3), dimnames=list(1:n, paste('Q', seq(1:3), sep ='')))
for (i in 1:3){
x2[seq(i,n,4),i] <- 1
}
x <- cbind(x, x2)
}
k <- length(x[1,])
if (par3 == 'Linear Trend'){
x <- cbind(x, c(1:n))
colnames(x)[k+1] <- 't'
}
x
k <- length(x[1,])
df <- as.data.frame(x)
(mylm <- lm(df))
(mysum <- summary(mylm))
bitmap(file='test0.png')
plot(x[,1], type='l', main='Actuals and Interpolation', ylab='value of Actuals and Interpolation (dots)', xlab='time or index')
points(x[,1]-mysum$resid)
grid()
dev.off()
bitmap(file='test1.png')
plot(mysum$resid, type='b', pch=19, main='Residuals', ylab='value of Residuals', xlab='time or index')
grid()
dev.off()
bitmap(file='test2.png')
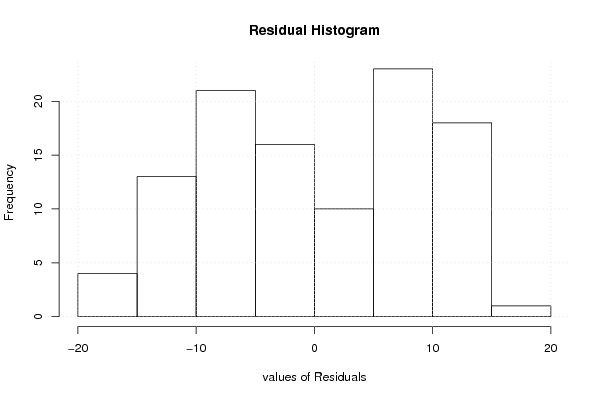
hist(mysum$resid, main='Residual Histogram', xlab='values of Residuals')
grid()
dev.off()
bitmap(file='test3.png')
densityplot(~mysum$resid,col='black',main='Residual Density Plot', xlab='values of Residuals')
dev.off()
bitmap(file='test4.png')
qqnorm(mysum$resid, main='Residual Normal Q-Q Plot')
grid()
dev.off()
(myerror <- as.ts(mysum$resid))
bitmap(file='test5.png')
dum <- cbind(lag(myerror,k=1),myerror)
dum
dum1 <- dum[2:length(myerror),]
dum1
z <- as.data.frame(dum1)
z
plot(z,main=paste('Residual Lag plot, lowess, and regression line'), ylab='values of Residuals', xlab='lagged values of Residuals')
lines(lowess(z))
abline(lm(z))
grid()
dev.off()
bitmap(file='test6.png')
acf(mysum$resid, lag.max=length(mysum$resid)/2, main='Residual Autocorrelation Function')
grid()
dev.off()
bitmap(file='test7.png')
pacf(mysum$resid, lag.max=length(mysum$resid)/2, main='Residual Partial Autocorrelation Function')
grid()
dev.off()
bitmap(file='test8.png')
opar <- par(mfrow = c(2,2), oma = c(0, 0, 1.1, 0))
plot(mylm, las = 1, sub='Residual Diagnostics')
par(opar)
dev.off()
load(file='createtable')
a<-table.start()
a<-table.row.start(a)
a<-table.element(a, 'Multiple Linear Regression - Estimated Regression Equation', 1, TRUE)
a<-table.row.end(a)
myeq <- colnames(x)[1]
myeq <- paste(myeq, '[t] = ', sep='')
for (i in 1:k){
if (mysum$coefficients[i,1] > 0) myeq <- paste(myeq, '+', '')
myeq <- paste(myeq, mysum$coefficients[i,1], sep=' ')
if (rownames(mysum$coefficients)[i] != '(Intercept)') {
myeq <- paste(myeq, rownames(mysum$coefficients)[i], sep='')
if (rownames(mysum$coefficients)[i] != 't') myeq <- paste(myeq, '[t]', sep='')
}
}
myeq <- paste(myeq, ' + e[t]')
a<-table.row.start(a)
a<-table.element(a, myeq)
a<-table.row.end(a)
a<-table.end(a)
table.save(a,file='mytable1.tab')
a<-table.start()
a<-table.row.start(a)
a<-table.element(a,hyperlink('ols1.htm','Multiple Linear Regression - Ordinary Least Squares',''), 6, TRUE)
a<-table.row.end(a)
a<-table.row.start(a)
a<-table.element(a,'Variable',header=TRUE)
a<-table.element(a,'Parameter',header=TRUE)
a<-table.element(a,'S.D.',header=TRUE)
a<-table.element(a,'T-STAT
H0: parameter = 0',header=TRUE)
a<-table.element(a,'2-tail p-value',header=TRUE)
a<-table.element(a,'1-tail p-value',header=TRUE)
a<-table.row.end(a)
for (i in 1:k){
a<-table.row.start(a)
a<-table.element(a,rownames(mysum$coefficients)[i],header=TRUE)
a<-table.element(a,mysum$coefficients[i,1])
a<-table.element(a, round(mysum$coefficients[i,2],6))
a<-table.element(a, round(mysum$coefficients[i,3],4))
a<-table.element(a, round(mysum$coefficients[i,4],6))
a<-table.element(a, round(mysum$coefficients[i,4]/2,6))
a<-table.row.end(a)
}
a<-table.end(a)
table.save(a,file='mytable2.tab')
a<-table.start()
a<-table.row.start(a)
a<-table.element(a, 'Multiple Linear Regression - Regression Statistics', 2, TRUE)
a<-table.row.end(a)
a<-table.row.start(a)
a<-table.element(a, 'Multiple R',1,TRUE)
a<-table.element(a, sqrt(mysum$r.squared))
a<-table.row.end(a)
a<-table.row.start(a)
a<-table.element(a, 'R-squared',1,TRUE)
a<-table.element(a, mysum$r.squared)
a<-table.row.end(a)
a<-table.row.start(a)
a<-table.element(a, 'Adjusted R-squared',1,TRUE)
a<-table.element(a, mysum$adj.r.squared)
a<-table.row.end(a)
a<-table.row.start(a)
a<-table.element(a, 'F-TEST (value)',1,TRUE)
a<-table.element(a, mysum$fstatistic[1])
a<-table.row.end(a)
a<-table.row.start(a)
a<-table.element(a, 'F-TEST (DF numerator)',1,TRUE)
a<-table.element(a, mysum$fstatistic[2])
a<-table.row.end(a)
a<-table.row.start(a)
a<-table.element(a, 'F-TEST (DF denominator)',1,TRUE)
a<-table.element(a, mysum$fstatistic[3])
a<-table.row.end(a)
a<-table.row.start(a)
a<-table.element(a, 'p-value',1,TRUE)
a<-table.element(a, 1-pf(mysum$fstatistic[1],mysum$fstatistic[2],mysum$fstatistic[3]))
a<-table.row.end(a)
a<-table.row.start(a)
a<-table.element(a, 'Multiple Linear Regression - Residual Statistics', 2, TRUE)
a<-table.row.end(a)
a<-table.row.start(a)
a<-table.element(a, 'Residual Standard Deviation',1,TRUE)
a<-table.element(a, mysum$sigma)
a<-table.row.end(a)
a<-table.row.start(a)
a<-table.element(a, 'Sum Squared Residuals',1,TRUE)
a<-table.element(a, sum(myerror*myerror))
a<-table.row.end(a)
a<-table.end(a)
table.save(a,file='mytable3.tab')
a<-table.start()
a<-table.row.start(a)
a<-table.element(a, 'Multiple Linear Regression - Actuals, Interpolation, and Residuals', 4, TRUE)
a<-table.row.end(a)
a<-table.row.start(a)
a<-table.element(a, 'Time or Index', 1, TRUE)
a<-table.element(a, 'Actuals', 1, TRUE)
a<-table.element(a, 'Interpolation
Forecast', 1, TRUE)
a<-table.element(a, 'Residuals
Prediction Error', 1, TRUE)
a<-table.row.end(a)
for (i in 1:n) {
a<-table.row.start(a)
a<-table.element(a,i, 1, TRUE)
a<-table.element(a,x[i])
a<-table.element(a,x[i]-mysum$resid[i])
a<-table.element(a,mysum$resid[i])
a<-table.row.end(a)
}
a<-table.end(a)
table.save(a,file='mytable4.tab')