Free Statistics

of Irreproducible Research!

Author's title

Author*Unverified author*
R Software Modulerwasp_centraltendency.wasp
Title produced by softwareCentral Tendency
Date of computationMon, 12 Nov 2007 02:53:53 -0700
Cite this page as followsStatistical Computations at FreeStatistics.org, Office for Research Development and Education, URL https://freestatistics.org/blog/index.php?v=date/2007/Nov/12/t1194861010gsocbhirvc6ag1i.htm/, Retrieved Sun, 28 Apr 2024 20:01:59 +0000
Statistical Computations at FreeStatistics.org, Office for Research Development and Education, URL https://freestatistics.org/blog/index.php?pk=5145, Retrieved Sun, 28 Apr 2024 20:01:59 +0000
QR Codes:

Original text written by user:
IsPrivate?No (this computation is public)
User-defined keywordsPCTCV
Estimated Impact211
Family? (F = Feedback message, R = changed R code, M = changed R Module, P = changed Parameters, D = changed Data)
-       [Central Tendency] [Cental Tendancy C...] [2007-11-12 09:53:53] [65108f21b143a71c6470aac06bd65b08] [Current]
Feedback Forum

Post a new message
Dataseries X:
96
86
82
92
99
101
102
100
101
100
99
97
97
97
96
92
91
87
82
89
91
90
87
89
95
85
94
94
97
99
97
96
94
100
96
98
98
94
93
94
94
97
98
95
89
89
89
90
86
92
91
95
99
98
95
96
94
98
98
98
98
102
101
92
99
101
99
102
102
101
99
98
98


Summary of compuational transaction
Raw Inputview raw input (R code)
Raw Outputview raw output of R engine
Computing time2 seconds
R Server'Gwilym Jenkins' @ 72.249.127.135

\begin{tabular}{lllllllll}
\hline
Summary of compuational transaction \tabularnewline
Raw Input & view raw input (R code)  \tabularnewline
Raw Output & view raw output of R engine  \tabularnewline
Computing time & 2 seconds \tabularnewline
R Server & 'Gwilym Jenkins' @ 72.249.127.135 \tabularnewline
\hline
\end{tabular}
%Source: https://freestatistics.org/blog/index.php?pk=5145&T=0

[TABLE]
[ROW][C]Summary of compuational transaction[/C][/ROW]
[ROW][C]Raw Input[/C][C]view raw input (R code) [/C][/ROW]
[ROW][C]Raw Output[/C][C]view raw output of R engine [/C][/ROW]
[ROW][C]Computing time[/C][C]2 seconds[/C][/ROW]
[ROW][C]R Server[/C][C]'Gwilym Jenkins' @ 72.249.127.135[/C][/ROW]
[/TABLE]
Source: https://freestatistics.org/blog/index.php?pk=5145&T=0

Globally Unique Identifier (entire table): ba.freestatistics.org/blog/index.php?pk=5145&T=0

As an alternative you can also use a QR Code:  

The GUIDs for individual cells are displayed in the table below:

Summary of compuational transaction
Raw Inputview raw input (R code)
Raw Outputview raw output of R engine
Computing time2 seconds
R Server'Gwilym Jenkins' @ 72.249.127.135


Central Tendency - Ungrouped Data
MeasureValueS.E.Value/S.E.
Arithmetic Mean95.0684931506850.574485663393068165.484535487247
Geometric Mean94.9399178530988
Harmonic Mean94.8076420119361
Quadratic Mean95.1933864400138
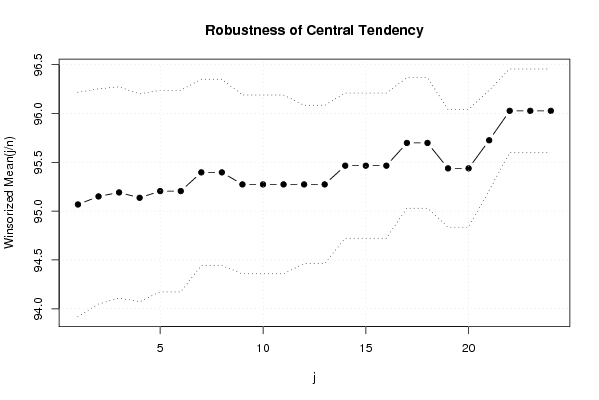
Winsorized Mean ( 1 / 24 )95.0684931506850.574485663393068165.484535487247
Winsorized Mean ( 2 / 24 )95.15068493150680.550933631566855172.708071316863
Winsorized Mean ( 3 / 24 )95.19178082191780.540821270118463176.013382020028
Winsorized Mean ( 4 / 24 )95.13698630136990.531831170959155178.885690603262
Winsorized Mean ( 5 / 24 )95.20547945205480.516087797722429184.475354527293
Winsorized Mean ( 6 / 24 )95.20547945205480.516087797722429184.475354527293
Winsorized Mean ( 7 / 24 )95.39726027397260.476917632797462200.028796826823
Winsorized Mean ( 8 / 24 )95.39726027397260.476917632797462200.028796826823
Winsorized Mean ( 9 / 24 )95.27397260273970.458000200217218208.021683303967
Winsorized Mean ( 10 / 24 )95.27397260273970.458000200217218208.021683303967
Winsorized Mean ( 11 / 24 )95.27397260273970.458000200217218208.021683303967
Winsorized Mean ( 12 / 24 )95.27397260273970.405095152948527235.189120159247
Winsorized Mean ( 13 / 24 )95.27397260273970.405095152948527235.189120159247
Winsorized Mean ( 14 / 24 )95.46575342465750.371697631540141256.837131377707
Winsorized Mean ( 15 / 24 )95.46575342465750.371697631540141256.837131377707
Winsorized Mean ( 16 / 24 )95.46575342465750.371697631540141256.837131377707
Winsorized Mean ( 17 / 24 )95.69863013698630.334293668863441286.271141366064
Winsorized Mean ( 18 / 24 )95.69863013698630.334293668863441286.271141366064
Winsorized Mean ( 19 / 24 )95.43835616438360.300928485419853317.146301491628
Winsorized Mean ( 20 / 24 )95.43835616438360.300928485419853317.146301491628
Winsorized Mean ( 21 / 24 )95.72602739726030.256765587570951372.814863170902
Winsorized Mean ( 22 / 24 )96.0273972602740.214551142675437447.573459935097
Winsorized Mean ( 23 / 24 )96.0273972602740.214551142675437447.573459935097
Winsorized Mean ( 24 / 24 )96.0273972602740.214551142675437447.573459935097
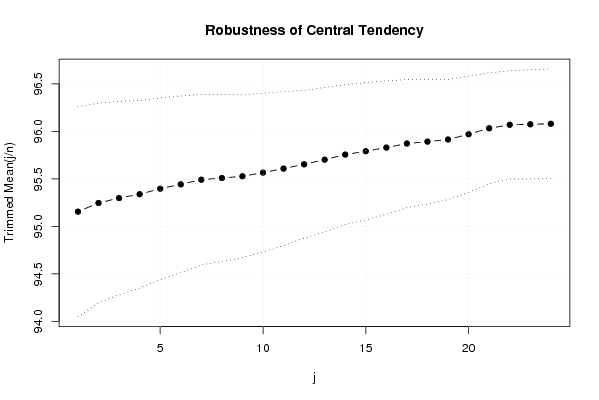
Trimmed Mean ( 1 / 24 )95.15492957746480.552167081456913172.329957313636
Trimmed Mean ( 2 / 24 )95.24637681159420.525320426351026181.311009497943
Trimmed Mean ( 3 / 24 )95.29850746268660.508638592882675187.359962055944
Trimmed Mean ( 4 / 24 )95.33846153846150.493358254074973193.243876535961
Trimmed Mean ( 5 / 24 )95.39682539682540.478166237420791199.505565075845
Trimmed Mean ( 6 / 24 )95.44262295081970.464901770084054205.296320841204
Trimmed Mean ( 7 / 24 )95.49152542372880.448631193957421212.850837636564
Trimmed Mean ( 8 / 24 )95.50877192982460.439385255662042217.369087148628
Trimmed Mean ( 9 / 24 )95.52727272727270.427863335629643223.265853304993
Trimmed Mean ( 10 / 24 )95.5660377358490.417774039419941228.750541485388
Trimmed Mean ( 11 / 24 )95.6078431372550.404948247840944236.098917940764
Trimmed Mean ( 12 / 24 )95.65306122448980.388559852339995246.173300325408
Trimmed Mean ( 13 / 24 )95.70212765957450.379779006795788251.994254413949
Trimmed Mean ( 14 / 24 )95.75555555555560.368117728691962260.122097068797
Trimmed Mean ( 15 / 24 )95.79069767441860.36081324952849265.485532473094
Trimmed Mean ( 16 / 24 )95.8292682926830.350787335728919273.183375031355
Trimmed Mean ( 17 / 24 )95.87179487179490.337049769026664284.444030769268
Trimmed Mean ( 18 / 24 )95.89189189189190.328303912761957292.082695832566
Trimmed Mean ( 19 / 24 )95.91428571428570.315885918593131303.635838347786
Trimmed Mean ( 20 / 24 )95.9696969696970.306139353805708313.483698768778
Trimmed Mean ( 21 / 24 )96.03225806451610.291395865564806329.559439281608
Trimmed Mean ( 22 / 24 )96.06896551724140.284799793488912337.321050483773
Trimmed Mean ( 23 / 24 )96.0740740740740.287071498712443334.669496989356
Trimmed Mean ( 24 / 24 )96.080.288212884282897333.364694083878
Median96
Midrange92
Midmean - Weighted Average at Xnp95.7027027027027
Midmean - Weighted Average at X(n+1)p96.2272727272727
Midmean - Empirical Distribution Function96.2272727272727
Midmean - Empirical Distribution Function - Averaging96.2272727272727
Midmean - Empirical Distribution Function - Interpolation96.2272727272727
Midmean - Closest Observation96.2272727272727
Midmean - True Basic - Statistics Graphics Toolkit96.2272727272727
Midmean - MS Excel (old versions)96.2272727272727
Number of observations73

\begin{tabular}{lllllllll}
\hline
Central Tendency - Ungrouped Data \tabularnewline
Measure & Value & S.E. & Value/S.E. \tabularnewline
Arithmetic Mean & 95.068493150685 & 0.574485663393068 & 165.484535487247 \tabularnewline
Geometric Mean & 94.9399178530988 &  &  \tabularnewline
Harmonic Mean & 94.8076420119361 &  &  \tabularnewline
Quadratic Mean & 95.1933864400138 &  &  \tabularnewline
Winsorized Mean ( 1 / 24 ) & 95.068493150685 & 0.574485663393068 & 165.484535487247 \tabularnewline
Winsorized Mean ( 2 / 24 ) & 95.1506849315068 & 0.550933631566855 & 172.708071316863 \tabularnewline
Winsorized Mean ( 3 / 24 ) & 95.1917808219178 & 0.540821270118463 & 176.013382020028 \tabularnewline
Winsorized Mean ( 4 / 24 ) & 95.1369863013699 & 0.531831170959155 & 178.885690603262 \tabularnewline
Winsorized Mean ( 5 / 24 ) & 95.2054794520548 & 0.516087797722429 & 184.475354527293 \tabularnewline
Winsorized Mean ( 6 / 24 ) & 95.2054794520548 & 0.516087797722429 & 184.475354527293 \tabularnewline
Winsorized Mean ( 7 / 24 ) & 95.3972602739726 & 0.476917632797462 & 200.028796826823 \tabularnewline
Winsorized Mean ( 8 / 24 ) & 95.3972602739726 & 0.476917632797462 & 200.028796826823 \tabularnewline
Winsorized Mean ( 9 / 24 ) & 95.2739726027397 & 0.458000200217218 & 208.021683303967 \tabularnewline
Winsorized Mean ( 10 / 24 ) & 95.2739726027397 & 0.458000200217218 & 208.021683303967 \tabularnewline
Winsorized Mean ( 11 / 24 ) & 95.2739726027397 & 0.458000200217218 & 208.021683303967 \tabularnewline
Winsorized Mean ( 12 / 24 ) & 95.2739726027397 & 0.405095152948527 & 235.189120159247 \tabularnewline
Winsorized Mean ( 13 / 24 ) & 95.2739726027397 & 0.405095152948527 & 235.189120159247 \tabularnewline
Winsorized Mean ( 14 / 24 ) & 95.4657534246575 & 0.371697631540141 & 256.837131377707 \tabularnewline
Winsorized Mean ( 15 / 24 ) & 95.4657534246575 & 0.371697631540141 & 256.837131377707 \tabularnewline
Winsorized Mean ( 16 / 24 ) & 95.4657534246575 & 0.371697631540141 & 256.837131377707 \tabularnewline
Winsorized Mean ( 17 / 24 ) & 95.6986301369863 & 0.334293668863441 & 286.271141366064 \tabularnewline
Winsorized Mean ( 18 / 24 ) & 95.6986301369863 & 0.334293668863441 & 286.271141366064 \tabularnewline
Winsorized Mean ( 19 / 24 ) & 95.4383561643836 & 0.300928485419853 & 317.146301491628 \tabularnewline
Winsorized Mean ( 20 / 24 ) & 95.4383561643836 & 0.300928485419853 & 317.146301491628 \tabularnewline
Winsorized Mean ( 21 / 24 ) & 95.7260273972603 & 0.256765587570951 & 372.814863170902 \tabularnewline
Winsorized Mean ( 22 / 24 ) & 96.027397260274 & 0.214551142675437 & 447.573459935097 \tabularnewline
Winsorized Mean ( 23 / 24 ) & 96.027397260274 & 0.214551142675437 & 447.573459935097 \tabularnewline
Winsorized Mean ( 24 / 24 ) & 96.027397260274 & 0.214551142675437 & 447.573459935097 \tabularnewline
Trimmed Mean ( 1 / 24 ) & 95.1549295774648 & 0.552167081456913 & 172.329957313636 \tabularnewline
Trimmed Mean ( 2 / 24 ) & 95.2463768115942 & 0.525320426351026 & 181.311009497943 \tabularnewline
Trimmed Mean ( 3 / 24 ) & 95.2985074626866 & 0.508638592882675 & 187.359962055944 \tabularnewline
Trimmed Mean ( 4 / 24 ) & 95.3384615384615 & 0.493358254074973 & 193.243876535961 \tabularnewline
Trimmed Mean ( 5 / 24 ) & 95.3968253968254 & 0.478166237420791 & 199.505565075845 \tabularnewline
Trimmed Mean ( 6 / 24 ) & 95.4426229508197 & 0.464901770084054 & 205.296320841204 \tabularnewline
Trimmed Mean ( 7 / 24 ) & 95.4915254237288 & 0.448631193957421 & 212.850837636564 \tabularnewline
Trimmed Mean ( 8 / 24 ) & 95.5087719298246 & 0.439385255662042 & 217.369087148628 \tabularnewline
Trimmed Mean ( 9 / 24 ) & 95.5272727272727 & 0.427863335629643 & 223.265853304993 \tabularnewline
Trimmed Mean ( 10 / 24 ) & 95.566037735849 & 0.417774039419941 & 228.750541485388 \tabularnewline
Trimmed Mean ( 11 / 24 ) & 95.607843137255 & 0.404948247840944 & 236.098917940764 \tabularnewline
Trimmed Mean ( 12 / 24 ) & 95.6530612244898 & 0.388559852339995 & 246.173300325408 \tabularnewline
Trimmed Mean ( 13 / 24 ) & 95.7021276595745 & 0.379779006795788 & 251.994254413949 \tabularnewline
Trimmed Mean ( 14 / 24 ) & 95.7555555555556 & 0.368117728691962 & 260.122097068797 \tabularnewline
Trimmed Mean ( 15 / 24 ) & 95.7906976744186 & 0.36081324952849 & 265.485532473094 \tabularnewline
Trimmed Mean ( 16 / 24 ) & 95.829268292683 & 0.350787335728919 & 273.183375031355 \tabularnewline
Trimmed Mean ( 17 / 24 ) & 95.8717948717949 & 0.337049769026664 & 284.444030769268 \tabularnewline
Trimmed Mean ( 18 / 24 ) & 95.8918918918919 & 0.328303912761957 & 292.082695832566 \tabularnewline
Trimmed Mean ( 19 / 24 ) & 95.9142857142857 & 0.315885918593131 & 303.635838347786 \tabularnewline
Trimmed Mean ( 20 / 24 ) & 95.969696969697 & 0.306139353805708 & 313.483698768778 \tabularnewline
Trimmed Mean ( 21 / 24 ) & 96.0322580645161 & 0.291395865564806 & 329.559439281608 \tabularnewline
Trimmed Mean ( 22 / 24 ) & 96.0689655172414 & 0.284799793488912 & 337.321050483773 \tabularnewline
Trimmed Mean ( 23 / 24 ) & 96.074074074074 & 0.287071498712443 & 334.669496989356 \tabularnewline
Trimmed Mean ( 24 / 24 ) & 96.08 & 0.288212884282897 & 333.364694083878 \tabularnewline
Median & 96 &  &  \tabularnewline
Midrange & 92 &  &  \tabularnewline
Midmean - Weighted Average at Xnp & 95.7027027027027 &  &  \tabularnewline
Midmean - Weighted Average at X(n+1)p & 96.2272727272727 &  &  \tabularnewline
Midmean - Empirical Distribution Function & 96.2272727272727 &  &  \tabularnewline
Midmean - Empirical Distribution Function - Averaging & 96.2272727272727 &  &  \tabularnewline
Midmean - Empirical Distribution Function - Interpolation & 96.2272727272727 &  &  \tabularnewline
Midmean - Closest Observation & 96.2272727272727 &  &  \tabularnewline
Midmean - True Basic - Statistics Graphics Toolkit & 96.2272727272727 &  &  \tabularnewline
Midmean - MS Excel (old versions) & 96.2272727272727 &  &  \tabularnewline
Number of observations & 73 &  &  \tabularnewline
\hline
\end{tabular}
%Source: https://freestatistics.org/blog/index.php?pk=5145&T=1

[TABLE]
[ROW][C]Central Tendency - Ungrouped Data[/C][/ROW]
[ROW][C]Measure[/C][C]Value[/C][C]S.E.[/C][C]Value/S.E.[/C][/ROW]
[ROW][C]Arithmetic Mean[/C][C]95.068493150685[/C][C]0.574485663393068[/C][C]165.484535487247[/C][/ROW]
[ROW][C]Geometric Mean[/C][C]94.9399178530988[/C][C][/C][C][/C][/ROW]
[ROW][C]Harmonic Mean[/C][C]94.8076420119361[/C][C][/C][C][/C][/ROW]
[ROW][C]Quadratic Mean[/C][C]95.1933864400138[/C][C][/C][C][/C][/ROW]
[ROW][C]Winsorized Mean ( 1 / 24 )[/C][C]95.068493150685[/C][C]0.574485663393068[/C][C]165.484535487247[/C][/ROW]
[ROW][C]Winsorized Mean ( 2 / 24 )[/C][C]95.1506849315068[/C][C]0.550933631566855[/C][C]172.708071316863[/C][/ROW]
[ROW][C]Winsorized Mean ( 3 / 24 )[/C][C]95.1917808219178[/C][C]0.540821270118463[/C][C]176.013382020028[/C][/ROW]
[ROW][C]Winsorized Mean ( 4 / 24 )[/C][C]95.1369863013699[/C][C]0.531831170959155[/C][C]178.885690603262[/C][/ROW]
[ROW][C]Winsorized Mean ( 5 / 24 )[/C][C]95.2054794520548[/C][C]0.516087797722429[/C][C]184.475354527293[/C][/ROW]
[ROW][C]Winsorized Mean ( 6 / 24 )[/C][C]95.2054794520548[/C][C]0.516087797722429[/C][C]184.475354527293[/C][/ROW]
[ROW][C]Winsorized Mean ( 7 / 24 )[/C][C]95.3972602739726[/C][C]0.476917632797462[/C][C]200.028796826823[/C][/ROW]
[ROW][C]Winsorized Mean ( 8 / 24 )[/C][C]95.3972602739726[/C][C]0.476917632797462[/C][C]200.028796826823[/C][/ROW]
[ROW][C]Winsorized Mean ( 9 / 24 )[/C][C]95.2739726027397[/C][C]0.458000200217218[/C][C]208.021683303967[/C][/ROW]
[ROW][C]Winsorized Mean ( 10 / 24 )[/C][C]95.2739726027397[/C][C]0.458000200217218[/C][C]208.021683303967[/C][/ROW]
[ROW][C]Winsorized Mean ( 11 / 24 )[/C][C]95.2739726027397[/C][C]0.458000200217218[/C][C]208.021683303967[/C][/ROW]
[ROW][C]Winsorized Mean ( 12 / 24 )[/C][C]95.2739726027397[/C][C]0.405095152948527[/C][C]235.189120159247[/C][/ROW]
[ROW][C]Winsorized Mean ( 13 / 24 )[/C][C]95.2739726027397[/C][C]0.405095152948527[/C][C]235.189120159247[/C][/ROW]
[ROW][C]Winsorized Mean ( 14 / 24 )[/C][C]95.4657534246575[/C][C]0.371697631540141[/C][C]256.837131377707[/C][/ROW]
[ROW][C]Winsorized Mean ( 15 / 24 )[/C][C]95.4657534246575[/C][C]0.371697631540141[/C][C]256.837131377707[/C][/ROW]
[ROW][C]Winsorized Mean ( 16 / 24 )[/C][C]95.4657534246575[/C][C]0.371697631540141[/C][C]256.837131377707[/C][/ROW]
[ROW][C]Winsorized Mean ( 17 / 24 )[/C][C]95.6986301369863[/C][C]0.334293668863441[/C][C]286.271141366064[/C][/ROW]
[ROW][C]Winsorized Mean ( 18 / 24 )[/C][C]95.6986301369863[/C][C]0.334293668863441[/C][C]286.271141366064[/C][/ROW]
[ROW][C]Winsorized Mean ( 19 / 24 )[/C][C]95.4383561643836[/C][C]0.300928485419853[/C][C]317.146301491628[/C][/ROW]
[ROW][C]Winsorized Mean ( 20 / 24 )[/C][C]95.4383561643836[/C][C]0.300928485419853[/C][C]317.146301491628[/C][/ROW]
[ROW][C]Winsorized Mean ( 21 / 24 )[/C][C]95.7260273972603[/C][C]0.256765587570951[/C][C]372.814863170902[/C][/ROW]
[ROW][C]Winsorized Mean ( 22 / 24 )[/C][C]96.027397260274[/C][C]0.214551142675437[/C][C]447.573459935097[/C][/ROW]
[ROW][C]Winsorized Mean ( 23 / 24 )[/C][C]96.027397260274[/C][C]0.214551142675437[/C][C]447.573459935097[/C][/ROW]
[ROW][C]Winsorized Mean ( 24 / 24 )[/C][C]96.027397260274[/C][C]0.214551142675437[/C][C]447.573459935097[/C][/ROW]
[ROW][C]Trimmed Mean ( 1 / 24 )[/C][C]95.1549295774648[/C][C]0.552167081456913[/C][C]172.329957313636[/C][/ROW]
[ROW][C]Trimmed Mean ( 2 / 24 )[/C][C]95.2463768115942[/C][C]0.525320426351026[/C][C]181.311009497943[/C][/ROW]
[ROW][C]Trimmed Mean ( 3 / 24 )[/C][C]95.2985074626866[/C][C]0.508638592882675[/C][C]187.359962055944[/C][/ROW]
[ROW][C]Trimmed Mean ( 4 / 24 )[/C][C]95.3384615384615[/C][C]0.493358254074973[/C][C]193.243876535961[/C][/ROW]
[ROW][C]Trimmed Mean ( 5 / 24 )[/C][C]95.3968253968254[/C][C]0.478166237420791[/C][C]199.505565075845[/C][/ROW]
[ROW][C]Trimmed Mean ( 6 / 24 )[/C][C]95.4426229508197[/C][C]0.464901770084054[/C][C]205.296320841204[/C][/ROW]
[ROW][C]Trimmed Mean ( 7 / 24 )[/C][C]95.4915254237288[/C][C]0.448631193957421[/C][C]212.850837636564[/C][/ROW]
[ROW][C]Trimmed Mean ( 8 / 24 )[/C][C]95.5087719298246[/C][C]0.439385255662042[/C][C]217.369087148628[/C][/ROW]
[ROW][C]Trimmed Mean ( 9 / 24 )[/C][C]95.5272727272727[/C][C]0.427863335629643[/C][C]223.265853304993[/C][/ROW]
[ROW][C]Trimmed Mean ( 10 / 24 )[/C][C]95.566037735849[/C][C]0.417774039419941[/C][C]228.750541485388[/C][/ROW]
[ROW][C]Trimmed Mean ( 11 / 24 )[/C][C]95.607843137255[/C][C]0.404948247840944[/C][C]236.098917940764[/C][/ROW]
[ROW][C]Trimmed Mean ( 12 / 24 )[/C][C]95.6530612244898[/C][C]0.388559852339995[/C][C]246.173300325408[/C][/ROW]
[ROW][C]Trimmed Mean ( 13 / 24 )[/C][C]95.7021276595745[/C][C]0.379779006795788[/C][C]251.994254413949[/C][/ROW]
[ROW][C]Trimmed Mean ( 14 / 24 )[/C][C]95.7555555555556[/C][C]0.368117728691962[/C][C]260.122097068797[/C][/ROW]
[ROW][C]Trimmed Mean ( 15 / 24 )[/C][C]95.7906976744186[/C][C]0.36081324952849[/C][C]265.485532473094[/C][/ROW]
[ROW][C]Trimmed Mean ( 16 / 24 )[/C][C]95.829268292683[/C][C]0.350787335728919[/C][C]273.183375031355[/C][/ROW]
[ROW][C]Trimmed Mean ( 17 / 24 )[/C][C]95.8717948717949[/C][C]0.337049769026664[/C][C]284.444030769268[/C][/ROW]
[ROW][C]Trimmed Mean ( 18 / 24 )[/C][C]95.8918918918919[/C][C]0.328303912761957[/C][C]292.082695832566[/C][/ROW]
[ROW][C]Trimmed Mean ( 19 / 24 )[/C][C]95.9142857142857[/C][C]0.315885918593131[/C][C]303.635838347786[/C][/ROW]
[ROW][C]Trimmed Mean ( 20 / 24 )[/C][C]95.969696969697[/C][C]0.306139353805708[/C][C]313.483698768778[/C][/ROW]
[ROW][C]Trimmed Mean ( 21 / 24 )[/C][C]96.0322580645161[/C][C]0.291395865564806[/C][C]329.559439281608[/C][/ROW]
[ROW][C]Trimmed Mean ( 22 / 24 )[/C][C]96.0689655172414[/C][C]0.284799793488912[/C][C]337.321050483773[/C][/ROW]
[ROW][C]Trimmed Mean ( 23 / 24 )[/C][C]96.074074074074[/C][C]0.287071498712443[/C][C]334.669496989356[/C][/ROW]
[ROW][C]Trimmed Mean ( 24 / 24 )[/C][C]96.08[/C][C]0.288212884282897[/C][C]333.364694083878[/C][/ROW]
[ROW][C]Median[/C][C]96[/C][C][/C][C][/C][/ROW]
[ROW][C]Midrange[/C][C]92[/C][C][/C][C][/C][/ROW]
[ROW][C]Midmean - Weighted Average at Xnp[/C][C]95.7027027027027[/C][C][/C][C][/C][/ROW]
[ROW][C]Midmean - Weighted Average at X(n+1)p[/C][C]96.2272727272727[/C][C][/C][C][/C][/ROW]
[ROW][C]Midmean - Empirical Distribution Function[/C][C]96.2272727272727[/C][C][/C][C][/C][/ROW]
[ROW][C]Midmean - Empirical Distribution Function - Averaging[/C][C]96.2272727272727[/C][C][/C][C][/C][/ROW]
[ROW][C]Midmean - Empirical Distribution Function - Interpolation[/C][C]96.2272727272727[/C][C][/C][C][/C][/ROW]
[ROW][C]Midmean - Closest Observation[/C][C]96.2272727272727[/C][C][/C][C][/C][/ROW]
[ROW][C]Midmean - True Basic - Statistics Graphics Toolkit[/C][C]96.2272727272727[/C][C][/C][C][/C][/ROW]
[ROW][C]Midmean - MS Excel (old versions)[/C][C]96.2272727272727[/C][C][/C][C][/C][/ROW]
[ROW][C]Number of observations[/C][C]73[/C][C][/C][C][/C][/ROW]
[/TABLE]
Source: https://freestatistics.org/blog/index.php?pk=5145&T=1

Globally Unique Identifier (entire table): ba.freestatistics.org/blog/index.php?pk=5145&T=1

As an alternative you can also use a QR Code:  

The GUIDs for individual cells are displayed in the table below:

Central Tendency - Ungrouped Data
MeasureValueS.E.Value/S.E.
Arithmetic Mean95.0684931506850.574485663393068165.484535487247
Geometric Mean94.9399178530988
Harmonic Mean94.8076420119361
Quadratic Mean95.1933864400138
Winsorized Mean ( 1 / 24 )95.0684931506850.574485663393068165.484535487247
Winsorized Mean ( 2 / 24 )95.15068493150680.550933631566855172.708071316863
Winsorized Mean ( 3 / 24 )95.19178082191780.540821270118463176.013382020028
Winsorized Mean ( 4 / 24 )95.13698630136990.531831170959155178.885690603262
Winsorized Mean ( 5 / 24 )95.20547945205480.516087797722429184.475354527293
Winsorized Mean ( 6 / 24 )95.20547945205480.516087797722429184.475354527293
Winsorized Mean ( 7 / 24 )95.39726027397260.476917632797462200.028796826823
Winsorized Mean ( 8 / 24 )95.39726027397260.476917632797462200.028796826823
Winsorized Mean ( 9 / 24 )95.27397260273970.458000200217218208.021683303967
Winsorized Mean ( 10 / 24 )95.27397260273970.458000200217218208.021683303967
Winsorized Mean ( 11 / 24 )95.27397260273970.458000200217218208.021683303967
Winsorized Mean ( 12 / 24 )95.27397260273970.405095152948527235.189120159247
Winsorized Mean ( 13 / 24 )95.27397260273970.405095152948527235.189120159247
Winsorized Mean ( 14 / 24 )95.46575342465750.371697631540141256.837131377707
Winsorized Mean ( 15 / 24 )95.46575342465750.371697631540141256.837131377707
Winsorized Mean ( 16 / 24 )95.46575342465750.371697631540141256.837131377707
Winsorized Mean ( 17 / 24 )95.69863013698630.334293668863441286.271141366064
Winsorized Mean ( 18 / 24 )95.69863013698630.334293668863441286.271141366064
Winsorized Mean ( 19 / 24 )95.43835616438360.300928485419853317.146301491628
Winsorized Mean ( 20 / 24 )95.43835616438360.300928485419853317.146301491628
Winsorized Mean ( 21 / 24 )95.72602739726030.256765587570951372.814863170902
Winsorized Mean ( 22 / 24 )96.0273972602740.214551142675437447.573459935097
Winsorized Mean ( 23 / 24 )96.0273972602740.214551142675437447.573459935097
Winsorized Mean ( 24 / 24 )96.0273972602740.214551142675437447.573459935097
Trimmed Mean ( 1 / 24 )95.15492957746480.552167081456913172.329957313636
Trimmed Mean ( 2 / 24 )95.24637681159420.525320426351026181.311009497943
Trimmed Mean ( 3 / 24 )95.29850746268660.508638592882675187.359962055944
Trimmed Mean ( 4 / 24 )95.33846153846150.493358254074973193.243876535961
Trimmed Mean ( 5 / 24 )95.39682539682540.478166237420791199.505565075845
Trimmed Mean ( 6 / 24 )95.44262295081970.464901770084054205.296320841204
Trimmed Mean ( 7 / 24 )95.49152542372880.448631193957421212.850837636564
Trimmed Mean ( 8 / 24 )95.50877192982460.439385255662042217.369087148628
Trimmed Mean ( 9 / 24 )95.52727272727270.427863335629643223.265853304993
Trimmed Mean ( 10 / 24 )95.5660377358490.417774039419941228.750541485388
Trimmed Mean ( 11 / 24 )95.6078431372550.404948247840944236.098917940764
Trimmed Mean ( 12 / 24 )95.65306122448980.388559852339995246.173300325408
Trimmed Mean ( 13 / 24 )95.70212765957450.379779006795788251.994254413949
Trimmed Mean ( 14 / 24 )95.75555555555560.368117728691962260.122097068797
Trimmed Mean ( 15 / 24 )95.79069767441860.36081324952849265.485532473094
Trimmed Mean ( 16 / 24 )95.8292682926830.350787335728919273.183375031355
Trimmed Mean ( 17 / 24 )95.87179487179490.337049769026664284.444030769268
Trimmed Mean ( 18 / 24 )95.89189189189190.328303912761957292.082695832566
Trimmed Mean ( 19 / 24 )95.91428571428570.315885918593131303.635838347786
Trimmed Mean ( 20 / 24 )95.9696969696970.306139353805708313.483698768778
Trimmed Mean ( 21 / 24 )96.03225806451610.291395865564806329.559439281608
Trimmed Mean ( 22 / 24 )96.06896551724140.284799793488912337.321050483773
Trimmed Mean ( 23 / 24 )96.0740740740740.287071498712443334.669496989356
Trimmed Mean ( 24 / 24 )96.080.288212884282897333.364694083878
Median96
Midrange92
Midmean - Weighted Average at Xnp95.7027027027027
Midmean - Weighted Average at X(n+1)p96.2272727272727
Midmean - Empirical Distribution Function96.2272727272727
Midmean - Empirical Distribution Function - Averaging96.2272727272727
Midmean - Empirical Distribution Function - Interpolation96.2272727272727
Midmean - Closest Observation96.2272727272727
Midmean - True Basic - Statistics Graphics Toolkit96.2272727272727
Midmean - MS Excel (old versions)96.2272727272727
Number of observations73


Parameters (Session):
Parameters (R input):
R code (references can be found in the software module):
geomean <- function(x) {
return(exp(mean(log(x))))
}
harmean <- function(x) {
return(1/mean(1/x))
}
quamean <- function(x) {
return(sqrt(mean(x*x)))
}
winmean <- function(x) {
x <-sort(x[!is.na(x)])
n<-length(x)
denom <- 3
nodenom <- n/denom
if (nodenom>40) denom <- n/40
sqrtn = sqrt(n)
roundnodenom = floor(nodenom)
win <- array(NA,dim=c(roundnodenom,2))
for (j in 1:roundnodenom) {
win[j,1] <- (j*x[j+1]+sum(x[(j+1):(n-j)])+j*x[n-j])/n
win[j,2] <- sd(c(rep(x[j+1],j),x[(j+1):(n-j)],rep(x[n-j],j)))/sqrtn
}
return(win)
}
trimean <- function(x) {
x <-sort(x[!is.na(x)])
n<-length(x)
denom <- 3
nodenom <- n/denom
if (nodenom>40) denom <- n/40
sqrtn = sqrt(n)
roundnodenom = floor(nodenom)
tri <- array(NA,dim=c(roundnodenom,2))
for (j in 1:roundnodenom) {
tri[j,1] <- mean(x,trim=j/n)
tri[j,2] <- sd(x[(j+1):(n-j)]) / sqrt(n-j*2)
}
return(tri)
}
midrange <- function(x) {
return((max(x)+min(x))/2)
}
q1 <- function(data,n,p,i,f) {
np <- n*p;
i <<- floor(np)
f <<- np - i
qvalue <- (1-f)*data[i] + f*data[i+1]
}
q2 <- function(data,n,p,i,f) {
np <- (n+1)*p
i <<- floor(np)
f <<- np - i
qvalue <- (1-f)*data[i] + f*data[i+1]
}
q3 <- function(data,n,p,i,f) {
np <- n*p
i <<- floor(np)
f <<- np - i
if (f==0) {
qvalue <- data[i]
} else {
qvalue <- data[i+1]
}
}
q4 <- function(data,n,p,i,f) {
np <- n*p
i <<- floor(np)
f <<- np - i
if (f==0) {
qvalue <- (data[i]+data[i+1])/2
} else {
qvalue <- data[i+1]
}
}
q5 <- function(data,n,p,i,f) {
np <- (n-1)*p
i <<- floor(np)
f <<- np - i
if (f==0) {
qvalue <- data[i+1]
} else {
qvalue <- data[i+1] + f*(data[i+2]-data[i+1])
}
}
q6 <- function(data,n,p,i,f) {
np <- n*p+0.5
i <<- floor(np)
f <<- np - i
qvalue <- data[i]
}
q7 <- function(data,n,p,i,f) {
np <- (n+1)*p
i <<- floor(np)
f <<- np - i
if (f==0) {
qvalue <- data[i]
} else {
qvalue <- f*data[i] + (1-f)*data[i+1]
}
}
q8 <- function(data,n,p,i,f) {
np <- (n+1)*p
i <<- floor(np)
f <<- np - i
if (f==0) {
qvalue <- data[i]
} else {
if (f == 0.5) {
qvalue <- (data[i]+data[i+1])/2
} else {
if (f < 0.5) {
qvalue <- data[i]
} else {
qvalue <- data[i+1]
}
}
}
}
midmean <- function(x,def) {
x <-sort(x[!is.na(x)])
n<-length(x)
if (def==1) {
qvalue1 <- q1(x,n,0.25,i,f)
qvalue3 <- q1(x,n,0.75,i,f)
}
if (def==2) {
qvalue1 <- q2(x,n,0.25,i,f)
qvalue3 <- q2(x,n,0.75,i,f)
}
if (def==3) {
qvalue1 <- q3(x,n,0.25,i,f)
qvalue3 <- q3(x,n,0.75,i,f)
}
if (def==4) {
qvalue1 <- q4(x,n,0.25,i,f)
qvalue3 <- q4(x,n,0.75,i,f)
}
if (def==5) {
qvalue1 <- q5(x,n,0.25,i,f)
qvalue3 <- q5(x,n,0.75,i,f)
}
if (def==6) {
qvalue1 <- q6(x,n,0.25,i,f)
qvalue3 <- q6(x,n,0.75,i,f)
}
if (def==7) {
qvalue1 <- q7(x,n,0.25,i,f)
qvalue3 <- q7(x,n,0.75,i,f)
}
if (def==8) {
qvalue1 <- q8(x,n,0.25,i,f)
qvalue3 <- q8(x,n,0.75,i,f)
}
midm <- 0
myn <- 0
roundno4 <- round(n/4)
round3no4 <- round(3*n/4)
for (i in 1:n) {
if ((x[i]>=qvalue1) & (x[i]<=qvalue3)){
midm = midm + x[i]
myn = myn + 1
}
}
midm = midm / myn
return(midm)
}
(arm <- mean(x))
sqrtn <- sqrt(length(x))
(armse <- sd(x) / sqrtn)
(armose <- arm / armse)
(geo <- geomean(x))
(har <- harmean(x))
(qua <- quamean(x))
(win <- winmean(x))
(tri <- trimean(x))
(midr <- midrange(x))
midm <- array(NA,dim=8)
for (j in 1:8) midm[j] <- midmean(x,j)
midm
bitmap(file='test1.png')
lb <- win[,1] - 2*win[,2]
ub <- win[,1] + 2*win[,2]
if ((ylimmin == '') | (ylimmax == '')) plot(win[,1],type='b',main=main, xlab='j', pch=19, ylab='Winsorized Mean(j/n)', ylim=c(min(lb),max(ub))) else plot(win[,1],type='l',main=main, xlab='j', pch=19, ylab='Winsorized Mean(j/n)', ylim=c(ylimmin,ylimmax))
lines(ub,lty=3)
lines(lb,lty=3)
grid()
dev.off()
bitmap(file='test2.png')
lb <- tri[,1] - 2*tri[,2]
ub <- tri[,1] + 2*tri[,2]
if ((ylimmin == '') | (ylimmax == '')) plot(tri[,1],type='b',main=main, xlab='j', pch=19, ylab='Trimmed Mean(j/n)', ylim=c(min(lb),max(ub))) else plot(tri[,1],type='l',main=main, xlab='j', pch=19, ylab='Trimmed Mean(j/n)', ylim=c(ylimmin,ylimmax))
lines(ub,lty=3)
lines(lb,lty=3)
grid()
dev.off()
load(file='createtable')
a<-table.start()
a<-table.row.start(a)
a<-table.element(a,'Central Tendency - Ungrouped Data',4,TRUE)
a<-table.row.end(a)
a<-table.row.start(a)
a<-table.element(a,'Measure',header=TRUE)
a<-table.element(a,'Value',header=TRUE)
a<-table.element(a,'S.E.',header=TRUE)
a<-table.element(a,'Value/S.E.',header=TRUE)
a<-table.row.end(a)
a<-table.row.start(a)
a<-table.element(a,hyperlink('arithmetic_mean.htm', 'Arithmetic Mean', 'click to view the definition of the Arithmetic Mean'),header=TRUE)
a<-table.element(a,arm)
a<-table.element(a,hyperlink('arithmetic_mean_standard_error.htm', armse, 'click to view the definition of the Standard Error of the Arithmetic Mean'))
a<-table.element(a,armose)
a<-table.row.end(a)
a<-table.row.start(a)
a<-table.element(a,hyperlink('geometric_mean.htm', 'Geometric Mean', 'click to view the definition of the Geometric Mean'),header=TRUE)
a<-table.element(a,geo)
a<-table.element(a,'')
a<-table.row.end(a)
a<-table.row.start(a)
a<-table.element(a,hyperlink('harmonic_mean.htm', 'Harmonic Mean', 'click to view the definition of the Harmonic Mean'),header=TRUE)
a<-table.element(a,har)
a<-table.element(a,'')
a<-table.row.end(a)
a<-table.row.start(a)
a<-table.element(a,hyperlink('quadratic_mean.htm', 'Quadratic Mean', 'click to view the definition of the Quadratic Mean'),header=TRUE)
a<-table.element(a,qua)
a<-table.element(a,'')
a<-table.row.end(a)
for (j in 1:length(win[,1])) {
a<-table.row.start(a)
mylabel <- paste('Winsorized Mean (',j)
mylabel <- paste(mylabel,'/')
mylabel <- paste(mylabel,length(win[,1]))
mylabel <- paste(mylabel,')')
a<-table.element(a,hyperlink('winsorized_mean.htm', mylabel, 'click to view the definition of the Winsorized Mean'),header=TRUE)
a<-table.element(a,win[j,1])
a<-table.element(a,win[j,2])
a<-table.element(a,win[j,1]/win[j,2])
a<-table.row.end(a)
}
for (j in 1:length(tri[,1])) {
a<-table.row.start(a)
mylabel <- paste('Trimmed Mean (',j)
mylabel <- paste(mylabel,'/')
mylabel <- paste(mylabel,length(tri[,1]))
mylabel <- paste(mylabel,')')
a<-table.element(a,hyperlink('arithmetic_mean.htm', mylabel, 'click to view the definition of the Trimmed Mean'),header=TRUE)
a<-table.element(a,tri[j,1])
a<-table.element(a,tri[j,2])
a<-table.element(a,tri[j,1]/tri[j,2])
a<-table.row.end(a)
}
a<-table.row.start(a)
a<-table.element(a,hyperlink('median_1.htm', 'Median', 'click to view the definition of the Median'),header=TRUE)
a<-table.element(a,median(x))
a<-table.element(a,'')
a<-table.row.end(a)
a<-table.row.start(a)
a<-table.element(a,hyperlink('midrange.htm', 'Midrange', 'click to view the definition of the Midrange'),header=TRUE)
a<-table.element(a,midr)
a<-table.element(a,'')
a<-table.row.end(a)
a<-table.row.start(a)
mymid <- hyperlink('midmean.htm', 'Midmean', 'click to view the definition of the Midmean')
mylabel <- paste(mymid,hyperlink('method_1.htm','Weighted Average at Xnp',''),sep=' - ')
a<-table.element(a,mylabel,header=TRUE)
a<-table.element(a,midm[1])
a<-table.element(a,'')
a<-table.row.end(a)
a<-table.row.start(a)
mymid <- hyperlink('midmean.htm', 'Midmean', 'click to view the definition of the Midmean')
mylabel <- paste(mymid,hyperlink('method_2.htm','Weighted Average at X(n+1)p',''),sep=' - ')
a<-table.element(a,mylabel,header=TRUE)
a<-table.element(a,midm[2])
a<-table.element(a,'')
a<-table.row.end(a)
a<-table.row.start(a)
mymid <- hyperlink('midmean.htm', 'Midmean', 'click to view the definition of the Midmean')
mylabel <- paste(mymid,hyperlink('method_3.htm','Empirical Distribution Function',''),sep=' - ')
a<-table.element(a,mylabel,header=TRUE)
a<-table.element(a,midm[3])
a<-table.element(a,'')
a<-table.row.end(a)
a<-table.row.start(a)
mymid <- hyperlink('midmean.htm', 'Midmean', 'click to view the definition of the Midmean')
mylabel <- paste(mymid,hyperlink('method_4.htm','Empirical Distribution Function - Averaging',''),sep=' - ')
a<-table.element(a,mylabel,header=TRUE)
a<-table.element(a,midm[4])
a<-table.element(a,'')
a<-table.row.end(a)
a<-table.row.start(a)
mymid <- hyperlink('midmean.htm', 'Midmean', 'click to view the definition of the Midmean')
mylabel <- paste(mymid,hyperlink('method_5.htm','Empirical Distribution Function - Interpolation',''),sep=' - ')
a<-table.element(a,mylabel,header=TRUE)
a<-table.element(a,midm[5])
a<-table.element(a,'')
a<-table.row.end(a)
a<-table.row.start(a)
mymid <- hyperlink('midmean.htm', 'Midmean', 'click to view the definition of the Midmean')
mylabel <- paste(mymid,hyperlink('method_6.htm','Closest Observation',''),sep=' - ')
a<-table.element(a,mylabel,header=TRUE)
a<-table.element(a,midm[6])
a<-table.element(a,'')
a<-table.row.end(a)
a<-table.row.start(a)
mymid <- hyperlink('midmean.htm', 'Midmean', 'click to view the definition of the Midmean')
mylabel <- paste(mymid,hyperlink('method_7.htm','True Basic - Statistics Graphics Toolkit',''),sep=' - ')
a<-table.element(a,mylabel,header=TRUE)
a<-table.element(a,midm[7])
a<-table.element(a,'')
a<-table.row.end(a)
a<-table.row.start(a)
mymid <- hyperlink('midmean.htm', 'Midmean', 'click to view the definition of the Midmean')
mylabel <- paste(mymid,hyperlink('method_8.htm','MS Excel (old versions)',''),sep=' - ')
a<-table.element(a,mylabel,header=TRUE)
a<-table.element(a,midm[8])
a<-table.element(a,'')
a<-table.row.end(a)
a<-table.row.start(a)
a<-table.element(a,'Number of observations',header=TRUE)
a<-table.element(a,length(x))
a<-table.element(a,'')
a<-table.row.end(a)
a<-table.end(a)
table.save(a,file='mytable.tab')