Free Statistics

of Irreproducible Research!

Author's title

Author*Unverified author*
R Software Modulerwasp_hierarchicalclustering.wasp
Title produced by softwareHierarchical Clustering
Date of computationMon, 05 Nov 2007 03:06:16 -0700
Cite this page as followsStatistical Computations at FreeStatistics.org, Office for Research Development and Education, URL https://freestatistics.org/blog/index.php?v=date/2007/Nov/05/y5kd1ibe3kin5bg1194257197.htm/, Retrieved Mon, 29 Apr 2024 03:08:46 +0000
Statistical Computations at FreeStatistics.org, Office for Research Development and Education, URL https://freestatistics.org/blog/index.php?pk=538, Retrieved Mon, 29 Apr 2024 03:08:46 +0000
QR Codes:

Original text written by user:
IsPrivate?No (this computation is public)
User-defined keywordshierarchical clustering
Estimated Impact237
Family? (F = Feedback message, R = changed R code, M = changed R Module, P = changed Parameters, D = changed Data)
-       [Hierarchical Clustering] [hierarchical clus...] [2007-11-05 10:06:16] [1a2581828a3030ed7733053b32a6f065] [Current]
F    D    [Hierarchical Clustering] [hierarchical clus...] [2008-11-06 16:18:16] [8545382734d98368249ce527c6558129]
Feedback Forum

Post a new message
Dataseries X:
96,8	96,9	96,7	95,4	96,8
91,2	98,0	88,0	101,2	87,0
97,1	97,9	96,7	101,5	96,3
104,9	100,9	106,8	101,9	107,1
110,9	103,9	114,3	101,7	115,2
104,8	103,1	105,7	100,1	106,1
94,1	102,5	90,1	97,4	89,5
95,8	104,3	91,6	96,5	91,3
99,3	102,6	97,7	99,2	97,6
101,1	101,7	100,8	102,2	100,7
104,0	102,8	104,6	105,3	104,6
99,0	105,4	95,9	111,1	94,7
105,4	110,9	102,7	114,9	101,8
107,1	113,5	104,0	124,5	102,5
110,7	116,3	107,9	142,2	105,3
117,1	124,0	113,8	159,7	110,3
118,7	128,8	113,8	165,2	109,8
126,5	133,5	123,1	198,6	117,3
127,5	132,6	125,1	207,8	118,8
134,6	128,4	137,6	219,6	131,3
131,8	127,3	134,0	239,6	125,9
135,9	126,7	140,3	235,3	133,1
142,7	123,3	152,1	218,5	147,0
141,7	123,2	150,6	213,8	145,8
153,4	124,4	167,3	205,5	164,4
145,0	128,2	153,2	198,4	149,8
137,7	128,7	142,0	198,5	137,7
148,3	135,7	154,4	190,2	151,7
152,2	139,0	158,5	180,7	156,8
169,4	145,4	180,9	193,6	180,0
168,6	142,4	181,3	192,8	180,4
161,1	137,7	172,4	195,5	170,4
174,1	137,0	192,0	197,2	191,6
179,0	137,1	199,3	196,9	199,5
190,6	139,3	215,4	178,9	218,2
190,0	139,6	214,3	172,4	217,5
181,6	140,4	201,5	156,4	205,0
174,8	142,3	190,5	143,7	194,0
180,5	148,3	196,0	153,6	199,3
196,8	157,7	215,7	168,8	219,3
193,8	161,6	209,4	185,8	211,1
197,0	161,7	214,1	199,9	215,2
216,3	171,8	237,8	205,4	240,2
221,4	185,1	239,0	197,5	242,2
217,9	176,7	237,8	199,6	240,7
229,7	184,4	251,5	200,5	255,4
227,4	183,0	248,8	193,7	253,0
204,2	180,9	215,4	179,6	218,2
196,6	187,0	201,2	169,1	203,7
198,8	189,9	203,1	169,8	205,6
207,5	193,8	214,2	195,5	215,6
190,7	194,5	188,9	194,8	188,5
201,6	198,7	203,0	204,5	202,9
210,5	204,7	213,3	203,8	214,0
223,5	213,2	228,5	204,8	230,3
223,8	214,7	228,2	204,9	230,0
231,2	211,0	240,9	240,0	241,0
244,0	213,2	258,8	248,3	259,6
234,7	206,3	248,5	258,4	247,8
250,2	210,8	269,2	254,9	270,3


Summary of compuational transaction
Raw Inputview raw input (R code)
Raw Outputview raw output of R engine
Computing time1 seconds
R Server'Gwilym Jenkins' @ 72.249.127.135

\begin{tabular}{lllllllll}
\hline
Summary of compuational transaction \tabularnewline
Raw Input & view raw input (R code)  \tabularnewline
Raw Output & view raw output of R engine  \tabularnewline
Computing time & 1 seconds \tabularnewline
R Server & 'Gwilym Jenkins' @ 72.249.127.135 \tabularnewline
\hline
\end{tabular}
%Source: https://freestatistics.org/blog/index.php?pk=538&T=0

[TABLE]
[ROW][C]Summary of compuational transaction[/C][/ROW]
[ROW][C]Raw Input[/C][C]view raw input (R code) [/C][/ROW]
[ROW][C]Raw Output[/C][C]view raw output of R engine [/C][/ROW]
[ROW][C]Computing time[/C][C]1 seconds[/C][/ROW]
[ROW][C]R Server[/C][C]'Gwilym Jenkins' @ 72.249.127.135[/C][/ROW]
[/TABLE]
Source: https://freestatistics.org/blog/index.php?pk=538&T=0

Globally Unique Identifier (entire table): ba.freestatistics.org/blog/index.php?pk=538&T=0

As an alternative you can also use a QR Code:  

The GUIDs for individual cells are displayed in the table below:

Summary of compuational transaction
Raw Inputview raw input (R code)
Raw Outputview raw output of R engine
Computing time1 seconds
R Server'Gwilym Jenkins' @ 72.249.127.135


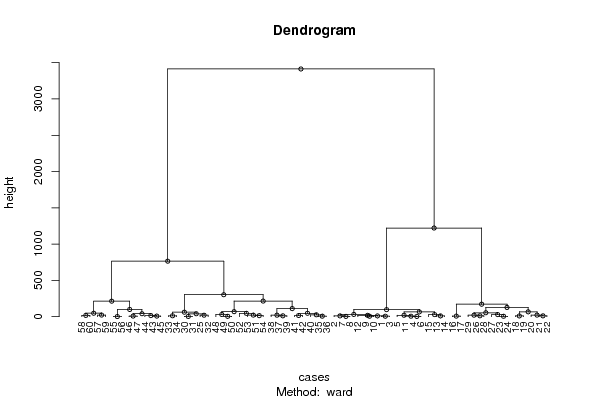
Summary of Dendrogram
LabelHeight
11.59059737205869
23.20936130717624
33.25576411921994
43.52562051276084
54.57820925690386
65.175905717843
75.68066897468951
86.12438931013497
96.20886463051015
106.66333249958307
117.48999332442961
127.77560287051749
138.15720540381325
149.62808392152875
1510.1975487250613
1610.2796543061681
1710.8430912916896
1811.2778544058699
1911.5844723660597
2011.8080481028831
2111.8241278748160
2214.1446102809515
2314.7342365347412
2415.7467456955397
2517.6184562320312
2617.8964328711026
2719.3359556887245
2819.9546986947936
2920.2349701761538
3020.3263432145169
3121.1839258603736
3221.4366382779137
3321.8380402051100
3425.589034711971
3528.5424536737741
3628.836328276247
3730.1824864808308
3830.9606046745631
3940.0243536815488
4040.4537529569372
4145.4252851537586
4246.5804363084871
4347.327049623301
4453.7458605364445
4561.6678346389096
4665.5590180930103
4766.4327692151587
4868.8183658341696
4996.987783624418
5098.8066877593632
51111.577760566497
52127.412914111299
53171.899732406559
54213.521190000939
55214.456311085589
56302.315502706050
57764.749376729712
581221.40936314200
593413.92226502828

\begin{tabular}{lllllllll}
\hline
Summary of Dendrogram \tabularnewline
Label & Height \tabularnewline
1 & 1.59059737205869 \tabularnewline
2 & 3.20936130717624 \tabularnewline
3 & 3.25576411921994 \tabularnewline
4 & 3.52562051276084 \tabularnewline
5 & 4.57820925690386 \tabularnewline
6 & 5.175905717843 \tabularnewline
7 & 5.68066897468951 \tabularnewline
8 & 6.12438931013497 \tabularnewline
9 & 6.20886463051015 \tabularnewline
10 & 6.66333249958307 \tabularnewline
11 & 7.48999332442961 \tabularnewline
12 & 7.77560287051749 \tabularnewline
13 & 8.15720540381325 \tabularnewline
14 & 9.62808392152875 \tabularnewline
15 & 10.1975487250613 \tabularnewline
16 & 10.2796543061681 \tabularnewline
17 & 10.8430912916896 \tabularnewline
18 & 11.2778544058699 \tabularnewline
19 & 11.5844723660597 \tabularnewline
20 & 11.8080481028831 \tabularnewline
21 & 11.8241278748160 \tabularnewline
22 & 14.1446102809515 \tabularnewline
23 & 14.7342365347412 \tabularnewline
24 & 15.7467456955397 \tabularnewline
25 & 17.6184562320312 \tabularnewline
26 & 17.8964328711026 \tabularnewline
27 & 19.3359556887245 \tabularnewline
28 & 19.9546986947936 \tabularnewline
29 & 20.2349701761538 \tabularnewline
30 & 20.3263432145169 \tabularnewline
31 & 21.1839258603736 \tabularnewline
32 & 21.4366382779137 \tabularnewline
33 & 21.8380402051100 \tabularnewline
34 & 25.589034711971 \tabularnewline
35 & 28.5424536737741 \tabularnewline
36 & 28.836328276247 \tabularnewline
37 & 30.1824864808308 \tabularnewline
38 & 30.9606046745631 \tabularnewline
39 & 40.0243536815488 \tabularnewline
40 & 40.4537529569372 \tabularnewline
41 & 45.4252851537586 \tabularnewline
42 & 46.5804363084871 \tabularnewline
43 & 47.327049623301 \tabularnewline
44 & 53.7458605364445 \tabularnewline
45 & 61.6678346389096 \tabularnewline
46 & 65.5590180930103 \tabularnewline
47 & 66.4327692151587 \tabularnewline
48 & 68.8183658341696 \tabularnewline
49 & 96.987783624418 \tabularnewline
50 & 98.8066877593632 \tabularnewline
51 & 111.577760566497 \tabularnewline
52 & 127.412914111299 \tabularnewline
53 & 171.899732406559 \tabularnewline
54 & 213.521190000939 \tabularnewline
55 & 214.456311085589 \tabularnewline
56 & 302.315502706050 \tabularnewline
57 & 764.749376729712 \tabularnewline
58 & 1221.40936314200 \tabularnewline
59 & 3413.92226502828 \tabularnewline
\hline
\end{tabular}
%Source: https://freestatistics.org/blog/index.php?pk=538&T=1

[TABLE]
[ROW][C]Summary of Dendrogram[/C][/ROW]
[ROW][C]Label[/C][C]Height[/C][/ROW]
[ROW][C]1[/C][C]1.59059737205869[/C][/ROW]
[ROW][C]2[/C][C]3.20936130717624[/C][/ROW]
[ROW][C]3[/C][C]3.25576411921994[/C][/ROW]
[ROW][C]4[/C][C]3.52562051276084[/C][/ROW]
[ROW][C]5[/C][C]4.57820925690386[/C][/ROW]
[ROW][C]6[/C][C]5.175905717843[/C][/ROW]
[ROW][C]7[/C][C]5.68066897468951[/C][/ROW]
[ROW][C]8[/C][C]6.12438931013497[/C][/ROW]
[ROW][C]9[/C][C]6.20886463051015[/C][/ROW]
[ROW][C]10[/C][C]6.66333249958307[/C][/ROW]
[ROW][C]11[/C][C]7.48999332442961[/C][/ROW]
[ROW][C]12[/C][C]7.77560287051749[/C][/ROW]
[ROW][C]13[/C][C]8.15720540381325[/C][/ROW]
[ROW][C]14[/C][C]9.62808392152875[/C][/ROW]
[ROW][C]15[/C][C]10.1975487250613[/C][/ROW]
[ROW][C]16[/C][C]10.2796543061681[/C][/ROW]
[ROW][C]17[/C][C]10.8430912916896[/C][/ROW]
[ROW][C]18[/C][C]11.2778544058699[/C][/ROW]
[ROW][C]19[/C][C]11.5844723660597[/C][/ROW]
[ROW][C]20[/C][C]11.8080481028831[/C][/ROW]
[ROW][C]21[/C][C]11.8241278748160[/C][/ROW]
[ROW][C]22[/C][C]14.1446102809515[/C][/ROW]
[ROW][C]23[/C][C]14.7342365347412[/C][/ROW]
[ROW][C]24[/C][C]15.7467456955397[/C][/ROW]
[ROW][C]25[/C][C]17.6184562320312[/C][/ROW]
[ROW][C]26[/C][C]17.8964328711026[/C][/ROW]
[ROW][C]27[/C][C]19.3359556887245[/C][/ROW]
[ROW][C]28[/C][C]19.9546986947936[/C][/ROW]
[ROW][C]29[/C][C]20.2349701761538[/C][/ROW]
[ROW][C]30[/C][C]20.3263432145169[/C][/ROW]
[ROW][C]31[/C][C]21.1839258603736[/C][/ROW]
[ROW][C]32[/C][C]21.4366382779137[/C][/ROW]
[ROW][C]33[/C][C]21.8380402051100[/C][/ROW]
[ROW][C]34[/C][C]25.589034711971[/C][/ROW]
[ROW][C]35[/C][C]28.5424536737741[/C][/ROW]
[ROW][C]36[/C][C]28.836328276247[/C][/ROW]
[ROW][C]37[/C][C]30.1824864808308[/C][/ROW]
[ROW][C]38[/C][C]30.9606046745631[/C][/ROW]
[ROW][C]39[/C][C]40.0243536815488[/C][/ROW]
[ROW][C]40[/C][C]40.4537529569372[/C][/ROW]
[ROW][C]41[/C][C]45.4252851537586[/C][/ROW]
[ROW][C]42[/C][C]46.5804363084871[/C][/ROW]
[ROW][C]43[/C][C]47.327049623301[/C][/ROW]
[ROW][C]44[/C][C]53.7458605364445[/C][/ROW]
[ROW][C]45[/C][C]61.6678346389096[/C][/ROW]
[ROW][C]46[/C][C]65.5590180930103[/C][/ROW]
[ROW][C]47[/C][C]66.4327692151587[/C][/ROW]
[ROW][C]48[/C][C]68.8183658341696[/C][/ROW]
[ROW][C]49[/C][C]96.987783624418[/C][/ROW]
[ROW][C]50[/C][C]98.8066877593632[/C][/ROW]
[ROW][C]51[/C][C]111.577760566497[/C][/ROW]
[ROW][C]52[/C][C]127.412914111299[/C][/ROW]
[ROW][C]53[/C][C]171.899732406559[/C][/ROW]
[ROW][C]54[/C][C]213.521190000939[/C][/ROW]
[ROW][C]55[/C][C]214.456311085589[/C][/ROW]
[ROW][C]56[/C][C]302.315502706050[/C][/ROW]
[ROW][C]57[/C][C]764.749376729712[/C][/ROW]
[ROW][C]58[/C][C]1221.40936314200[/C][/ROW]
[ROW][C]59[/C][C]3413.92226502828[/C][/ROW]
[/TABLE]
Source: https://freestatistics.org/blog/index.php?pk=538&T=1

Globally Unique Identifier (entire table): ba.freestatistics.org/blog/index.php?pk=538&T=1

As an alternative you can also use a QR Code:  

The GUIDs for individual cells are displayed in the table below:

Summary of Dendrogram
LabelHeight
11.59059737205869
23.20936130717624
33.25576411921994
43.52562051276084
54.57820925690386
65.175905717843
75.68066897468951
86.12438931013497
96.20886463051015
106.66333249958307
117.48999332442961
127.77560287051749
138.15720540381325
149.62808392152875
1510.1975487250613
1610.2796543061681
1710.8430912916896
1811.2778544058699
1911.5844723660597
2011.8080481028831
2111.8241278748160
2214.1446102809515
2314.7342365347412
2415.7467456955397
2517.6184562320312
2617.8964328711026
2719.3359556887245
2819.9546986947936
2920.2349701761538
3020.3263432145169
3121.1839258603736
3221.4366382779137
3321.8380402051100
3425.589034711971
3528.5424536737741
3628.836328276247
3730.1824864808308
3830.9606046745631
3940.0243536815488
4040.4537529569372
4145.4252851537586
4246.5804363084871
4347.327049623301
4453.7458605364445
4561.6678346389096
4665.5590180930103
4766.4327692151587
4868.8183658341696
4996.987783624418
5098.8066877593632
51111.577760566497
52127.412914111299
53171.899732406559
54213.521190000939
55214.456311085589
56302.315502706050
57764.749376729712
581221.40936314200
593413.92226502828


Parameters (Session):
par1 = ward ; par2 = ALL ; par3 = FALSE ; par4 = FALSE ;
Parameters (R input):
par1 = ward ; par2 = ALL ; par3 = FALSE ; par4 = FALSE ;
R code (references can be found in the software module):
par3 <- as.logical(par3)
par4 <- as.logical(par4)
if (par3 == 'TRUE'){
dum = xlab
xlab = ylab
ylab = dum
}
x <- t(y)
hc <- hclust(dist(x),method=par1)
d <- as.dendrogram(hc)
str(d)
mysub <- paste('Method: ',par1)
bitmap(file='test1.png')
if (par4 == 'TRUE'){
plot(d,main=main,ylab=ylab,xlab=xlab,horiz=par3, nodePar=list(pch = c(1,NA), cex=0.8, lab.cex = 0.8),type='t',center=T, sub=mysub)
} else {
plot(d,main=main,ylab=ylab,xlab=xlab,horiz=par3, nodePar=list(pch = c(1,NA), cex=0.8, lab.cex = 0.8), sub=mysub)
}
dev.off()
if (par2 != 'ALL'){
if (par3 == 'TRUE'){
ylab = 'cluster'
} else {
xlab = 'cluster'
}
par2 <- as.numeric(par2)
memb <- cutree(hc, k = par2)
cent <- NULL
for(k in 1:par2){
cent <- rbind(cent, colMeans(x[memb == k, , drop = FALSE]))
}
hc1 <- hclust(dist(cent),method=par1, members = table(memb))
de <- as.dendrogram(hc1)
bitmap(file='test2.png')
if (par4 == 'TRUE'){
plot(de,main=main,ylab=ylab,xlab=xlab,horiz=par3, nodePar=list(pch = c(1,NA), cex=0.8, lab.cex = 0.8),type='t',center=T, sub=mysub)
} else {
plot(de,main=main,ylab=ylab,xlab=xlab,horiz=par3, nodePar=list(pch = c(1,NA), cex=0.8, lab.cex = 0.8), sub=mysub)
}
dev.off()
str(de)
}
load(file='createtable')
a<-table.start()
a<-table.row.start(a)
a<-table.element(a,'Summary of Dendrogram',2,TRUE)
a<-table.row.end(a)
a<-table.row.start(a)
a<-table.element(a,'Label',header=TRUE)
a<-table.element(a,'Height',header=TRUE)
a<-table.row.end(a)
num <- length(x[,1])-1
for (i in 1:num)
{
a<-table.row.start(a)
a<-table.element(a,hc$labels[i])
a<-table.element(a,hc$height[i])
a<-table.row.end(a)
}
a<-table.end(a)
table.save(a,file='mytable1.tab')
if (par2 != 'ALL'){
a<-table.start()
a<-table.row.start(a)
a<-table.element(a,'Summary of Cut Dendrogram',2,TRUE)
a<-table.row.end(a)
a<-table.row.start(a)
a<-table.element(a,'Label',header=TRUE)
a<-table.element(a,'Height',header=TRUE)
a<-table.row.end(a)
num <- par2-1
for (i in 1:num)
{
a<-table.row.start(a)
a<-table.element(a,i)
a<-table.element(a,hc1$height[i])
a<-table.row.end(a)
}
a<-table.end(a)
table.save(a,file='mytable2.tab')
}