Free Statistics

of Irreproducible Research!

Author's title

Author*Unverified author*
R Software Modulerwasp_hierarchicalclustering.wasp
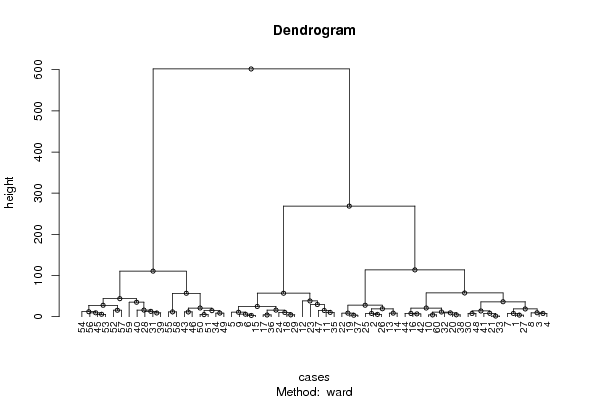
Title produced by softwareHierarchical Clustering
Date of computationMon, 05 Nov 2007 13:16:05 -0700
Cite this page as followsStatistical Computations at FreeStatistics.org, Office for Research Development and Education, URL https://freestatistics.org/blog/index.php?v=date/2007/Nov/05/ofxs5zjsqn3xw2v1194293627.htm/, Retrieved Mon, 29 Apr 2024 02:41:49 +0000
Statistical Computations at FreeStatistics.org, Office for Research Development and Education, URL https://freestatistics.org/blog/index.php?pk=506, Retrieved Mon, 29 Apr 2024 02:41:49 +0000
QR Codes:

Original text written by user:
IsPrivate?No (this computation is public)
User-defined keywords
Estimated Impact185
Family? (F = Feedback message, R = changed R code, M = changed R Module, P = changed Parameters, D = changed Data)
-       [Hierarchical Clustering] [Q2 Dendrogram] [2007-11-05 20:16:05] [d41d8cd98f00b204e9800998ecf8427e] [Current]
Feedback Forum

Post a new message
Dataseries X:
106.8	112.6	105.1	88.8
113.7	113.8	113.3	93.4
102.5	107.8	99.1	92.6
96.6	103.2	100.3	90.7
92.1	103.3	93.5	81.6
95.6	101.2	98.8	84.1
102.3	107.7	106.2	88.1
98.6	110.4	98.3	85.3
98.2	101.9	102.1	82.9
104.5	115.9	117.1	84.8
84.0	89.9	101.5	71.2
73.8	88.6	80.5	68.9
103.9	117.2	105.9	94.3
106.0	123.9	109.5	97.6
97.2	100.0	97.2	85.6
102.6	103.6	114.5	91.9
89.0	94.1	93.5	75.8
93.8	98.7	100.9	79.8
116.7	119.5	121.1	99.0
106.8	112.7	116.5	88.5
98.5	104.4	109.3	86.7
118.7	124.7	118.1	97.9
90.0	89.1	108.3	94.3
91.9	97.0	105.4	72.9
113.3	121.6	116.2	91.8
113.1	118.8	111.2	93.2
104.1	114.0	105.8	86.5
108.7	111.5	122.7	98.9
96.7	97.2	99.5	77.2
101.0	102.5	107.9	79.4
116.9	113.4	124.6	90.4
105.8	109.8	115.0	81.4
99.0	104.9	110.3	85.8
129.4	126.1	132.7	103.6
83.0	80.0	99.7	73.6
88.9	96.8	96.5	75.7
115.9	117.2	118.7	99.2
104.2	112.3	112.9	88.7
113.4	117.3	130.5	94.6
112.2	111.1	137.9	98.7
100.8	102.2	115.0	84.2
107.3	104.3	116.8	87.7
126.6	122.9	140.9	103.3
102.9	107.6	120.7	88.2
117.9	121.3	134.2	93.4
128.8	131.5	147.3	106.3
87.5	89.0	112.4	73.1
93.8	104.4	107.1	78.6
122.7	128.9	128.4	101.6
126.2	135.9	137.7	101.4
124.6	133.3	135.0	98.5
116.7	121.3	151.0	99.0
115.2	120.5	137.4	89.5
111.1	120.4	132.4	83.5
129.9	137.9	161.3	97.4
113.3	126.1	139.8	87.8
118.5	133.2	146.0	90.4
133.5	146.6	154.6	97.1
102.1	103.4	142.1	79.4
102.4	117.2	120.5	85.0


Summary of compuational transaction
Raw Inputview raw input (R code)
Raw Outputview raw output of R engine
Computing time1 seconds
R Server'Gwilym Jenkins' @ 72.249.127.135

\begin{tabular}{lllllllll}
\hline
Summary of compuational transaction \tabularnewline
Raw Input & view raw input (R code)  \tabularnewline
Raw Output & view raw output of R engine  \tabularnewline
Computing time & 1 seconds \tabularnewline
R Server & 'Gwilym Jenkins' @ 72.249.127.135 \tabularnewline
\hline
\end{tabular}
%Source: https://freestatistics.org/blog/index.php?pk=506&T=0

[TABLE]
[ROW][C]Summary of compuational transaction[/C][/ROW]
[ROW][C]Raw Input[/C][C]view raw input (R code) [/C][/ROW]
[ROW][C]Raw Output[/C][C]view raw output of R engine [/C][/ROW]
[ROW][C]Computing time[/C][C]1 seconds[/C][/ROW]
[ROW][C]R Server[/C][C]'Gwilym Jenkins' @ 72.249.127.135[/C][/ROW]
[/TABLE]
Source: https://freestatistics.org/blog/index.php?pk=506&T=0

Globally Unique Identifier (entire table): ba.freestatistics.org/blog/index.php?pk=506&T=0

As an alternative you can also use a QR Code:  

The GUIDs for individual cells are displayed in the table below:

Summary of compuational transaction
Raw Inputview raw input (R code)
Raw Outputview raw output of R engine
Computing time1 seconds
R Server'Gwilym Jenkins' @ 72.249.127.135


Summary of Dendrogram
LabelHeight
11.51986841535707
22.96816441593117
33.42490875790873
43.87685439499603
54.03856410126174
64.20713679359253
74.40227214061103
84.46318272088427
95.00199960015992
105.45985347788748
115.77754273026173
125.95556165108892
136.74610999020918
147.53193202306023
157.73162111854456
167.76493469414086
177.77075233967372
187.81152993977492
198.10803130766324
208.55277732669336
218.56187476994479
228.6729464428186
238.9392393412415
249.20148439701667
259.3706568593473
269.49351784534597
2710.1077690607966
2810.3927859595009
2910.7776222316501
3011.3135694991563
3111.3472463620034
3211.5598442896087
3311.9705079896396
3412.8428682803040
3513.7837211523946
3614.5893865363313
3715.1026623411332
3815.6144164156077
3915.8789738600582
4015.8988266296851
4118.7057275853576
4219.1563018470054
4320.9202580686970
4420.9768171177605
4524.7672985653974
4627.635753303834
4727.7703816419078
4829.5016533524986
4935.0342692904719
5036.2000486847536
5138.1613643971129
5243.6878425180021
5356.8296496129134
5456.9369615798996
5557.4872566337914
56110.562460455701
57113.651598434183
58268.632436258444
59601.92664096967

\begin{tabular}{lllllllll}
\hline
Summary of Dendrogram \tabularnewline
Label & Height \tabularnewline
1 & 1.51986841535707 \tabularnewline
2 & 2.96816441593117 \tabularnewline
3 & 3.42490875790873 \tabularnewline
4 & 3.87685439499603 \tabularnewline
5 & 4.03856410126174 \tabularnewline
6 & 4.20713679359253 \tabularnewline
7 & 4.40227214061103 \tabularnewline
8 & 4.46318272088427 \tabularnewline
9 & 5.00199960015992 \tabularnewline
10 & 5.45985347788748 \tabularnewline
11 & 5.77754273026173 \tabularnewline
12 & 5.95556165108892 \tabularnewline
13 & 6.74610999020918 \tabularnewline
14 & 7.53193202306023 \tabularnewline
15 & 7.73162111854456 \tabularnewline
16 & 7.76493469414086 \tabularnewline
17 & 7.77075233967372 \tabularnewline
18 & 7.81152993977492 \tabularnewline
19 & 8.10803130766324 \tabularnewline
20 & 8.55277732669336 \tabularnewline
21 & 8.56187476994479 \tabularnewline
22 & 8.6729464428186 \tabularnewline
23 & 8.9392393412415 \tabularnewline
24 & 9.20148439701667 \tabularnewline
25 & 9.3706568593473 \tabularnewline
26 & 9.49351784534597 \tabularnewline
27 & 10.1077690607966 \tabularnewline
28 & 10.3927859595009 \tabularnewline
29 & 10.7776222316501 \tabularnewline
30 & 11.3135694991563 \tabularnewline
31 & 11.3472463620034 \tabularnewline
32 & 11.5598442896087 \tabularnewline
33 & 11.9705079896396 \tabularnewline
34 & 12.8428682803040 \tabularnewline
35 & 13.7837211523946 \tabularnewline
36 & 14.5893865363313 \tabularnewline
37 & 15.1026623411332 \tabularnewline
38 & 15.6144164156077 \tabularnewline
39 & 15.8789738600582 \tabularnewline
40 & 15.8988266296851 \tabularnewline
41 & 18.7057275853576 \tabularnewline
42 & 19.1563018470054 \tabularnewline
43 & 20.9202580686970 \tabularnewline
44 & 20.9768171177605 \tabularnewline
45 & 24.7672985653974 \tabularnewline
46 & 27.635753303834 \tabularnewline
47 & 27.7703816419078 \tabularnewline
48 & 29.5016533524986 \tabularnewline
49 & 35.0342692904719 \tabularnewline
50 & 36.2000486847536 \tabularnewline
51 & 38.1613643971129 \tabularnewline
52 & 43.6878425180021 \tabularnewline
53 & 56.8296496129134 \tabularnewline
54 & 56.9369615798996 \tabularnewline
55 & 57.4872566337914 \tabularnewline
56 & 110.562460455701 \tabularnewline
57 & 113.651598434183 \tabularnewline
58 & 268.632436258444 \tabularnewline
59 & 601.92664096967 \tabularnewline
\hline
\end{tabular}
%Source: https://freestatistics.org/blog/index.php?pk=506&T=1

[TABLE]
[ROW][C]Summary of Dendrogram[/C][/ROW]
[ROW][C]Label[/C][C]Height[/C][/ROW]
[ROW][C]1[/C][C]1.51986841535707[/C][/ROW]
[ROW][C]2[/C][C]2.96816441593117[/C][/ROW]
[ROW][C]3[/C][C]3.42490875790873[/C][/ROW]
[ROW][C]4[/C][C]3.87685439499603[/C][/ROW]
[ROW][C]5[/C][C]4.03856410126174[/C][/ROW]
[ROW][C]6[/C][C]4.20713679359253[/C][/ROW]
[ROW][C]7[/C][C]4.40227214061103[/C][/ROW]
[ROW][C]8[/C][C]4.46318272088427[/C][/ROW]
[ROW][C]9[/C][C]5.00199960015992[/C][/ROW]
[ROW][C]10[/C][C]5.45985347788748[/C][/ROW]
[ROW][C]11[/C][C]5.77754273026173[/C][/ROW]
[ROW][C]12[/C][C]5.95556165108892[/C][/ROW]
[ROW][C]13[/C][C]6.74610999020918[/C][/ROW]
[ROW][C]14[/C][C]7.53193202306023[/C][/ROW]
[ROW][C]15[/C][C]7.73162111854456[/C][/ROW]
[ROW][C]16[/C][C]7.76493469414086[/C][/ROW]
[ROW][C]17[/C][C]7.77075233967372[/C][/ROW]
[ROW][C]18[/C][C]7.81152993977492[/C][/ROW]
[ROW][C]19[/C][C]8.10803130766324[/C][/ROW]
[ROW][C]20[/C][C]8.55277732669336[/C][/ROW]
[ROW][C]21[/C][C]8.56187476994479[/C][/ROW]
[ROW][C]22[/C][C]8.6729464428186[/C][/ROW]
[ROW][C]23[/C][C]8.9392393412415[/C][/ROW]
[ROW][C]24[/C][C]9.20148439701667[/C][/ROW]
[ROW][C]25[/C][C]9.3706568593473[/C][/ROW]
[ROW][C]26[/C][C]9.49351784534597[/C][/ROW]
[ROW][C]27[/C][C]10.1077690607966[/C][/ROW]
[ROW][C]28[/C][C]10.3927859595009[/C][/ROW]
[ROW][C]29[/C][C]10.7776222316501[/C][/ROW]
[ROW][C]30[/C][C]11.3135694991563[/C][/ROW]
[ROW][C]31[/C][C]11.3472463620034[/C][/ROW]
[ROW][C]32[/C][C]11.5598442896087[/C][/ROW]
[ROW][C]33[/C][C]11.9705079896396[/C][/ROW]
[ROW][C]34[/C][C]12.8428682803040[/C][/ROW]
[ROW][C]35[/C][C]13.7837211523946[/C][/ROW]
[ROW][C]36[/C][C]14.5893865363313[/C][/ROW]
[ROW][C]37[/C][C]15.1026623411332[/C][/ROW]
[ROW][C]38[/C][C]15.6144164156077[/C][/ROW]
[ROW][C]39[/C][C]15.8789738600582[/C][/ROW]
[ROW][C]40[/C][C]15.8988266296851[/C][/ROW]
[ROW][C]41[/C][C]18.7057275853576[/C][/ROW]
[ROW][C]42[/C][C]19.1563018470054[/C][/ROW]
[ROW][C]43[/C][C]20.9202580686970[/C][/ROW]
[ROW][C]44[/C][C]20.9768171177605[/C][/ROW]
[ROW][C]45[/C][C]24.7672985653974[/C][/ROW]
[ROW][C]46[/C][C]27.635753303834[/C][/ROW]
[ROW][C]47[/C][C]27.7703816419078[/C][/ROW]
[ROW][C]48[/C][C]29.5016533524986[/C][/ROW]
[ROW][C]49[/C][C]35.0342692904719[/C][/ROW]
[ROW][C]50[/C][C]36.2000486847536[/C][/ROW]
[ROW][C]51[/C][C]38.1613643971129[/C][/ROW]
[ROW][C]52[/C][C]43.6878425180021[/C][/ROW]
[ROW][C]53[/C][C]56.8296496129134[/C][/ROW]
[ROW][C]54[/C][C]56.9369615798996[/C][/ROW]
[ROW][C]55[/C][C]57.4872566337914[/C][/ROW]
[ROW][C]56[/C][C]110.562460455701[/C][/ROW]
[ROW][C]57[/C][C]113.651598434183[/C][/ROW]
[ROW][C]58[/C][C]268.632436258444[/C][/ROW]
[ROW][C]59[/C][C]601.92664096967[/C][/ROW]
[/TABLE]
Source: https://freestatistics.org/blog/index.php?pk=506&T=1

Globally Unique Identifier (entire table): ba.freestatistics.org/blog/index.php?pk=506&T=1

As an alternative you can also use a QR Code:  

The GUIDs for individual cells are displayed in the table below:

Summary of Dendrogram
LabelHeight
11.51986841535707
22.96816441593117
33.42490875790873
43.87685439499603
54.03856410126174
64.20713679359253
74.40227214061103
84.46318272088427
95.00199960015992
105.45985347788748
115.77754273026173
125.95556165108892
136.74610999020918
147.53193202306023
157.73162111854456
167.76493469414086
177.77075233967372
187.81152993977492
198.10803130766324
208.55277732669336
218.56187476994479
228.6729464428186
238.9392393412415
249.20148439701667
259.3706568593473
269.49351784534597
2710.1077690607966
2810.3927859595009
2910.7776222316501
3011.3135694991563
3111.3472463620034
3211.5598442896087
3311.9705079896396
3412.8428682803040
3513.7837211523946
3614.5893865363313
3715.1026623411332
3815.6144164156077
3915.8789738600582
4015.8988266296851
4118.7057275853576
4219.1563018470054
4320.9202580686970
4420.9768171177605
4524.7672985653974
4627.635753303834
4727.7703816419078
4829.5016533524986
4935.0342692904719
5036.2000486847536
5138.1613643971129
5243.6878425180021
5356.8296496129134
5456.9369615798996
5557.4872566337914
56110.562460455701
57113.651598434183
58268.632436258444
59601.92664096967


Parameters (Session):
par1 = ward ; par2 = ALL ; par3 = FALSE ; par4 = FALSE ;
Parameters (R input):
par1 = ward ; par2 = ALL ; par3 = FALSE ; par4 = FALSE ;
R code (references can be found in the software module):
par3 <- as.logical(par3)
par4 <- as.logical(par4)
if (par3 == 'TRUE'){
dum = xlab
xlab = ylab
ylab = dum
}
x <- t(y)
hc <- hclust(dist(x),method=par1)
d <- as.dendrogram(hc)
str(d)
mysub <- paste('Method: ',par1)
bitmap(file='test1.png')
if (par4 == 'TRUE'){
plot(d,main=main,ylab=ylab,xlab=xlab,horiz=par3, nodePar=list(pch = c(1,NA), cex=0.8, lab.cex = 0.8),type='t',center=T, sub=mysub)
} else {
plot(d,main=main,ylab=ylab,xlab=xlab,horiz=par3, nodePar=list(pch = c(1,NA), cex=0.8, lab.cex = 0.8), sub=mysub)
}
dev.off()
if (par2 != 'ALL'){
if (par3 == 'TRUE'){
ylab = 'cluster'
} else {
xlab = 'cluster'
}
par2 <- as.numeric(par2)
memb <- cutree(hc, k = par2)
cent <- NULL
for(k in 1:par2){
cent <- rbind(cent, colMeans(x[memb == k, , drop = FALSE]))
}
hc1 <- hclust(dist(cent),method=par1, members = table(memb))
de <- as.dendrogram(hc1)
bitmap(file='test2.png')
if (par4 == 'TRUE'){
plot(de,main=main,ylab=ylab,xlab=xlab,horiz=par3, nodePar=list(pch = c(1,NA), cex=0.8, lab.cex = 0.8),type='t',center=T, sub=mysub)
} else {
plot(de,main=main,ylab=ylab,xlab=xlab,horiz=par3, nodePar=list(pch = c(1,NA), cex=0.8, lab.cex = 0.8), sub=mysub)
}
dev.off()
str(de)
}
load(file='createtable')
a<-table.start()
a<-table.row.start(a)
a<-table.element(a,'Summary of Dendrogram',2,TRUE)
a<-table.row.end(a)
a<-table.row.start(a)
a<-table.element(a,'Label',header=TRUE)
a<-table.element(a,'Height',header=TRUE)
a<-table.row.end(a)
num <- length(x[,1])-1
for (i in 1:num)
{
a<-table.row.start(a)
a<-table.element(a,hc$labels[i])
a<-table.element(a,hc$height[i])
a<-table.row.end(a)
}
a<-table.end(a)
table.save(a,file='mytable1.tab')
if (par2 != 'ALL'){
a<-table.start()
a<-table.row.start(a)
a<-table.element(a,'Summary of Cut Dendrogram',2,TRUE)
a<-table.row.end(a)
a<-table.row.start(a)
a<-table.element(a,'Label',header=TRUE)
a<-table.element(a,'Height',header=TRUE)
a<-table.row.end(a)
num <- par2-1
for (i in 1:num)
{
a<-table.row.start(a)
a<-table.element(a,i)
a<-table.element(a,hc1$height[i])
a<-table.row.end(a)
}
a<-table.end(a)
table.save(a,file='mytable2.tab')
}