Free Statistics

of Irreproducible Research!

Author's title

Author*Unverified author*
R Software Modulerwasp_hierarchicalclustering.wasp
Title produced by softwareHierarchical Clustering
Date of computationMon, 05 Nov 2007 03:13:00 -0700
Cite this page as followsStatistical Computations at FreeStatistics.org, Office for Research Development and Education, URL https://freestatistics.org/blog/index.php?v=date/2007/Nov/05/de1ve7higzngski1194257477.htm/, Retrieved Sun, 28 Apr 2024 21:37:16 +0000
Statistical Computations at FreeStatistics.org, Office for Research Development and Education, URL https://freestatistics.org/blog/index.php?pk=14441, Retrieved Sun, 28 Apr 2024 21:37:16 +0000
QR Codes:

Original text written by user:
IsPrivate?No (this computation is public)
User-defined keywords
Estimated Impact199
Family? (F = Feedback message, R = changed R code, M = changed R Module, P = changed Parameters, D = changed Data)
-       [Hierarchical Clustering] [hierarhcical clus...] [2007-11-05 10:13:00] [81dc9bdb52d04dc20036dbd8313ed055] [Current]
Feedback Forum

Post a new message
Dataseries X:
95,90	2,90	96,92	95,86
96,06	2,63	96,06	96,02
96,31	2,67	96,59	96,34
96,34	1,81	96,67	96,84
96,49	1,33	97,27	96,73
96,22	0,88	96,38	96,34
96,53	1,28	96,47	96,60
96,50	1,26	96,05	96,64
96,77	1,26	96,76	97,20
96,66	1,29	96,51	97,50
96,58	1,10	96,55	96,99
96,63	1,37	95,97	97,08
97,06	1,21	97,00	97,55
97,73	1,74	97,46	98,42
98,01	1,76	97,90	98,78
97,76	1,48	98,42	97,49
97,49	1,04	98,54	96,99
97,77	1,62	99,00	97,16
97,96	1,49	98,94	97,29
98,23	1,79	99,02	97,80
98,51	1,80	100,07	98,12
98,19	1,58	98,72	98,03
98,37	1,86	98,73	98,11
98,31	1,74	98,04	98,07
98,60	1,59	99,08	98,21
98,97	1,26	99,22	98,48
99,11	1,13	99,57	98,83
99,64	1,92	100,44	99,20
100,03	2,61	100,84	99,88
99,98	2,26	100,75	99,71
100,32	2,41	100,49	100,03
100,44	2,26	99,98	100,60
100,51	2,03	99,96	100,85
101,00	2,86	99,76	101,96
100,88	2,55	100,11	101,40
100,55	2,27	99,79	100,81
100,83	2,26	100,29	100,66
101,51	2,57	101,12	101,55
102,16	3,07	102,65	102,23
102,39	2,76	102,71	102,90
102,54	2,51	103,39	102,68
102,85	2,87	102,80	103,41
103,47	3,14	102,07	104,62
103,57	3,11	102,15	104,93
103,69	3,16	101,21	105,88
103,50	2,47	101,27	105,18
103,47	2,57	101,86	104,54
103,45	2,89	101,65	104,58
103,48	2,63	101,94	104,34
103,93	2,38	102,62	104,66
103,89	1,69	102,71	104,73
104,40	1,96	103,39	105,44
104,79	2,19	104,51	105,72
104,77	1,87	104,09	105,68
105,13	1,60	104,29	105,90
105,26	1,63	104,57	105,97
104,96	1,22	105,39	105,21
104,75	1,21	105,15	104,75
105,01	1,49	106,13	104,89
105,15	1,64	105,46	105,26
105,20	1,66	106,47	104,84
105,77	1,77	106,62	105,47
105,78	1,82	106,52	105,40
106,26	1,78	108,04	105,73
106,13	1,28	107,15	105,72
106,12	1,29	107,32	105,63
106,57	1,37	107,76	105,97
106,44	1,12	107,26	105,92
106,54	1,51	107,89	106,32


Summary of compuational transaction
Raw Inputview raw input (R code)
Raw Outputview raw output of R engine
Computing time1 seconds
R Server'Gwilym Jenkins' @ 72.249.127.135

\begin{tabular}{lllllllll}
\hline
Summary of compuational transaction \tabularnewline
Raw Input & view raw input (R code)  \tabularnewline
Raw Output & view raw output of R engine  \tabularnewline
Computing time & 1 seconds \tabularnewline
R Server & 'Gwilym Jenkins' @ 72.249.127.135 \tabularnewline
\hline
\end{tabular}
%Source: https://freestatistics.org/blog/index.php?pk=14441&T=0

[TABLE]
[ROW][C]Summary of compuational transaction[/C][/ROW]
[ROW][C]Raw Input[/C][C]view raw input (R code) [/C][/ROW]
[ROW][C]Raw Output[/C][C]view raw output of R engine [/C][/ROW]
[ROW][C]Computing time[/C][C]1 seconds[/C][/ROW]
[ROW][C]R Server[/C][C]'Gwilym Jenkins' @ 72.249.127.135[/C][/ROW]
[/TABLE]
Source: https://freestatistics.org/blog/index.php?pk=14441&T=0

Globally Unique Identifier (entire table): ba.freestatistics.org/blog/index.php?pk=14441&T=0

As an alternative you can also use a QR Code:  

The GUIDs for individual cells are displayed in the table below:

Summary of compuational transaction
Raw Inputview raw input (R code)
Raw Outputview raw output of R engine
Computing time1 seconds
R Server'Gwilym Jenkins' @ 72.249.127.135


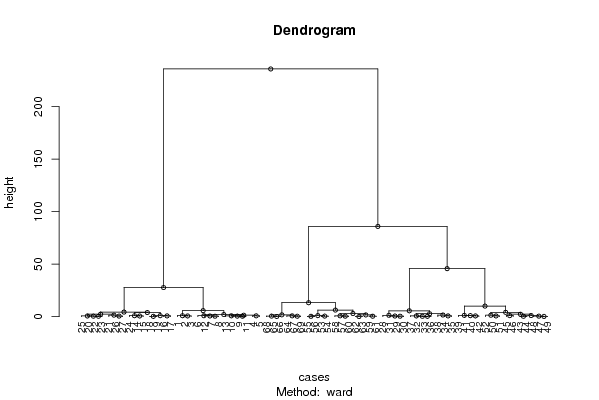
Summary of Dendrogram
LabelHeight
10.132287565553233
20.192873015219849
30.223830292855996
40.271108834234523
50.29949958263743
60.317962261911684
70.334428631382339
80.336749164809658
90.342490875790878
100.387169213652126
110.399874980462637
120.402492235949963
130.423438307194805
140.427901857906695
150.468934963507739
160.476982278767515
170.487945044257233
180.509850396423737
190.525620748250331
200.529905651979672
210.530565735795285
220.581713292969237
230.631774772905535
240.634034699365903
250.648577076857977
260.662640772349327
270.66887966032763
280.700499821556008
290.701355829803949
300.728628849277879
310.73932401557097
320.770068401848224
330.775114041702953
340.789213895019265
350.790569415042089
360.87476948236093
370.895631120704817
380.905615946026887
390.952158678866097
400.982134002514492
410.993400978785342
421.00289580715047
431.06805644813109
441.21127983953589
451.28662759632268
461.36937584873134
471.3747741900212
481.43272709512621
491.57809583153990
501.64931679875173
511.71855568619222
522.00284658245665
532.33907058716814
542.39686588400049
552.77902356129487
562.96298859056425
573.93224420812851
584.10922383106238
594.3354098598628
605.56688477000092
615.7163090099975
626.26554264877576
6310.0302969509425
6413.2890158967772
6527.7197022374139
6645.7316410082011
6785.9532780967705
68235.957597303874

\begin{tabular}{lllllllll}
\hline
Summary of Dendrogram \tabularnewline
Label & Height \tabularnewline
1 & 0.132287565553233 \tabularnewline
2 & 0.192873015219849 \tabularnewline
3 & 0.223830292855996 \tabularnewline
4 & 0.271108834234523 \tabularnewline
5 & 0.29949958263743 \tabularnewline
6 & 0.317962261911684 \tabularnewline
7 & 0.334428631382339 \tabularnewline
8 & 0.336749164809658 \tabularnewline
9 & 0.342490875790878 \tabularnewline
10 & 0.387169213652126 \tabularnewline
11 & 0.399874980462637 \tabularnewline
12 & 0.402492235949963 \tabularnewline
13 & 0.423438307194805 \tabularnewline
14 & 0.427901857906695 \tabularnewline
15 & 0.468934963507739 \tabularnewline
16 & 0.476982278767515 \tabularnewline
17 & 0.487945044257233 \tabularnewline
18 & 0.509850396423737 \tabularnewline
19 & 0.525620748250331 \tabularnewline
20 & 0.529905651979672 \tabularnewline
21 & 0.530565735795285 \tabularnewline
22 & 0.581713292969237 \tabularnewline
23 & 0.631774772905535 \tabularnewline
24 & 0.634034699365903 \tabularnewline
25 & 0.648577076857977 \tabularnewline
26 & 0.662640772349327 \tabularnewline
27 & 0.66887966032763 \tabularnewline
28 & 0.700499821556008 \tabularnewline
29 & 0.701355829803949 \tabularnewline
30 & 0.728628849277879 \tabularnewline
31 & 0.73932401557097 \tabularnewline
32 & 0.770068401848224 \tabularnewline
33 & 0.775114041702953 \tabularnewline
34 & 0.789213895019265 \tabularnewline
35 & 0.790569415042089 \tabularnewline
36 & 0.87476948236093 \tabularnewline
37 & 0.895631120704817 \tabularnewline
38 & 0.905615946026887 \tabularnewline
39 & 0.952158678866097 \tabularnewline
40 & 0.982134002514492 \tabularnewline
41 & 0.993400978785342 \tabularnewline
42 & 1.00289580715047 \tabularnewline
43 & 1.06805644813109 \tabularnewline
44 & 1.21127983953589 \tabularnewline
45 & 1.28662759632268 \tabularnewline
46 & 1.36937584873134 \tabularnewline
47 & 1.3747741900212 \tabularnewline
48 & 1.43272709512621 \tabularnewline
49 & 1.57809583153990 \tabularnewline
50 & 1.64931679875173 \tabularnewline
51 & 1.71855568619222 \tabularnewline
52 & 2.00284658245665 \tabularnewline
53 & 2.33907058716814 \tabularnewline
54 & 2.39686588400049 \tabularnewline
55 & 2.77902356129487 \tabularnewline
56 & 2.96298859056425 \tabularnewline
57 & 3.93224420812851 \tabularnewline
58 & 4.10922383106238 \tabularnewline
59 & 4.3354098598628 \tabularnewline
60 & 5.56688477000092 \tabularnewline
61 & 5.7163090099975 \tabularnewline
62 & 6.26554264877576 \tabularnewline
63 & 10.0302969509425 \tabularnewline
64 & 13.2890158967772 \tabularnewline
65 & 27.7197022374139 \tabularnewline
66 & 45.7316410082011 \tabularnewline
67 & 85.9532780967705 \tabularnewline
68 & 235.957597303874 \tabularnewline
\hline
\end{tabular}
%Source: https://freestatistics.org/blog/index.php?pk=14441&T=1

[TABLE]
[ROW][C]Summary of Dendrogram[/C][/ROW]
[ROW][C]Label[/C][C]Height[/C][/ROW]
[ROW][C]1[/C][C]0.132287565553233[/C][/ROW]
[ROW][C]2[/C][C]0.192873015219849[/C][/ROW]
[ROW][C]3[/C][C]0.223830292855996[/C][/ROW]
[ROW][C]4[/C][C]0.271108834234523[/C][/ROW]
[ROW][C]5[/C][C]0.29949958263743[/C][/ROW]
[ROW][C]6[/C][C]0.317962261911684[/C][/ROW]
[ROW][C]7[/C][C]0.334428631382339[/C][/ROW]
[ROW][C]8[/C][C]0.336749164809658[/C][/ROW]
[ROW][C]9[/C][C]0.342490875790878[/C][/ROW]
[ROW][C]10[/C][C]0.387169213652126[/C][/ROW]
[ROW][C]11[/C][C]0.399874980462637[/C][/ROW]
[ROW][C]12[/C][C]0.402492235949963[/C][/ROW]
[ROW][C]13[/C][C]0.423438307194805[/C][/ROW]
[ROW][C]14[/C][C]0.427901857906695[/C][/ROW]
[ROW][C]15[/C][C]0.468934963507739[/C][/ROW]
[ROW][C]16[/C][C]0.476982278767515[/C][/ROW]
[ROW][C]17[/C][C]0.487945044257233[/C][/ROW]
[ROW][C]18[/C][C]0.509850396423737[/C][/ROW]
[ROW][C]19[/C][C]0.525620748250331[/C][/ROW]
[ROW][C]20[/C][C]0.529905651979672[/C][/ROW]
[ROW][C]21[/C][C]0.530565735795285[/C][/ROW]
[ROW][C]22[/C][C]0.581713292969237[/C][/ROW]
[ROW][C]23[/C][C]0.631774772905535[/C][/ROW]
[ROW][C]24[/C][C]0.634034699365903[/C][/ROW]
[ROW][C]25[/C][C]0.648577076857977[/C][/ROW]
[ROW][C]26[/C][C]0.662640772349327[/C][/ROW]
[ROW][C]27[/C][C]0.66887966032763[/C][/ROW]
[ROW][C]28[/C][C]0.700499821556008[/C][/ROW]
[ROW][C]29[/C][C]0.701355829803949[/C][/ROW]
[ROW][C]30[/C][C]0.728628849277879[/C][/ROW]
[ROW][C]31[/C][C]0.73932401557097[/C][/ROW]
[ROW][C]32[/C][C]0.770068401848224[/C][/ROW]
[ROW][C]33[/C][C]0.775114041702953[/C][/ROW]
[ROW][C]34[/C][C]0.789213895019265[/C][/ROW]
[ROW][C]35[/C][C]0.790569415042089[/C][/ROW]
[ROW][C]36[/C][C]0.87476948236093[/C][/ROW]
[ROW][C]37[/C][C]0.895631120704817[/C][/ROW]
[ROW][C]38[/C][C]0.905615946026887[/C][/ROW]
[ROW][C]39[/C][C]0.952158678866097[/C][/ROW]
[ROW][C]40[/C][C]0.982134002514492[/C][/ROW]
[ROW][C]41[/C][C]0.993400978785342[/C][/ROW]
[ROW][C]42[/C][C]1.00289580715047[/C][/ROW]
[ROW][C]43[/C][C]1.06805644813109[/C][/ROW]
[ROW][C]44[/C][C]1.21127983953589[/C][/ROW]
[ROW][C]45[/C][C]1.28662759632268[/C][/ROW]
[ROW][C]46[/C][C]1.36937584873134[/C][/ROW]
[ROW][C]47[/C][C]1.3747741900212[/C][/ROW]
[ROW][C]48[/C][C]1.43272709512621[/C][/ROW]
[ROW][C]49[/C][C]1.57809583153990[/C][/ROW]
[ROW][C]50[/C][C]1.64931679875173[/C][/ROW]
[ROW][C]51[/C][C]1.71855568619222[/C][/ROW]
[ROW][C]52[/C][C]2.00284658245665[/C][/ROW]
[ROW][C]53[/C][C]2.33907058716814[/C][/ROW]
[ROW][C]54[/C][C]2.39686588400049[/C][/ROW]
[ROW][C]55[/C][C]2.77902356129487[/C][/ROW]
[ROW][C]56[/C][C]2.96298859056425[/C][/ROW]
[ROW][C]57[/C][C]3.93224420812851[/C][/ROW]
[ROW][C]58[/C][C]4.10922383106238[/C][/ROW]
[ROW][C]59[/C][C]4.3354098598628[/C][/ROW]
[ROW][C]60[/C][C]5.56688477000092[/C][/ROW]
[ROW][C]61[/C][C]5.7163090099975[/C][/ROW]
[ROW][C]62[/C][C]6.26554264877576[/C][/ROW]
[ROW][C]63[/C][C]10.0302969509425[/C][/ROW]
[ROW][C]64[/C][C]13.2890158967772[/C][/ROW]
[ROW][C]65[/C][C]27.7197022374139[/C][/ROW]
[ROW][C]66[/C][C]45.7316410082011[/C][/ROW]
[ROW][C]67[/C][C]85.9532780967705[/C][/ROW]
[ROW][C]68[/C][C]235.957597303874[/C][/ROW]
[/TABLE]
Source: https://freestatistics.org/blog/index.php?pk=14441&T=1

Globally Unique Identifier (entire table): ba.freestatistics.org/blog/index.php?pk=14441&T=1

As an alternative you can also use a QR Code:  

The GUIDs for individual cells are displayed in the table below:

Summary of Dendrogram
LabelHeight
10.132287565553233
20.192873015219849
30.223830292855996
40.271108834234523
50.29949958263743
60.317962261911684
70.334428631382339
80.336749164809658
90.342490875790878
100.387169213652126
110.399874980462637
120.402492235949963
130.423438307194805
140.427901857906695
150.468934963507739
160.476982278767515
170.487945044257233
180.509850396423737
190.525620748250331
200.529905651979672
210.530565735795285
220.581713292969237
230.631774772905535
240.634034699365903
250.648577076857977
260.662640772349327
270.66887966032763
280.700499821556008
290.701355829803949
300.728628849277879
310.73932401557097
320.770068401848224
330.775114041702953
340.789213895019265
350.790569415042089
360.87476948236093
370.895631120704817
380.905615946026887
390.952158678866097
400.982134002514492
410.993400978785342
421.00289580715047
431.06805644813109
441.21127983953589
451.28662759632268
461.36937584873134
471.3747741900212
481.43272709512621
491.57809583153990
501.64931679875173
511.71855568619222
522.00284658245665
532.33907058716814
542.39686588400049
552.77902356129487
562.96298859056425
573.93224420812851
584.10922383106238
594.3354098598628
605.56688477000092
615.7163090099975
626.26554264877576
6310.0302969509425
6413.2890158967772
6527.7197022374139
6645.7316410082011
6785.9532780967705
68235.957597303874


Parameters (Session):
par1 = single ; par2 = ALL ; par3 = FALSE ; par4 = FALSE ;
Parameters (R input):
par1 = ward ; par2 = ALL ; par3 = FALSE ; par4 = FALSE ;
R code (references can be found in the software module):
par3 <- as.logical(par3)
par4 <- as.logical(par4)
if (par3 == 'TRUE'){
dum = xlab
xlab = ylab
ylab = dum
}
x <- t(y)
hc <- hclust(dist(x),method=par1)
d <- as.dendrogram(hc)
str(d)
mysub <- paste('Method: ',par1)
bitmap(file='test1.png')
if (par4 == 'TRUE'){
plot(d,main=main,ylab=ylab,xlab=xlab,horiz=par3, nodePar=list(pch = c(1,NA), cex=0.8, lab.cex = 0.8),type='t',center=T, sub=mysub)
} else {
plot(d,main=main,ylab=ylab,xlab=xlab,horiz=par3, nodePar=list(pch = c(1,NA), cex=0.8, lab.cex = 0.8), sub=mysub)
}
dev.off()
if (par2 != 'ALL'){
if (par3 == 'TRUE'){
ylab = 'cluster'
} else {
xlab = 'cluster'
}
par2 <- as.numeric(par2)
memb <- cutree(hc, k = par2)
cent <- NULL
for(k in 1:par2){
cent <- rbind(cent, colMeans(x[memb == k, , drop = FALSE]))
}
hc1 <- hclust(dist(cent),method=par1, members = table(memb))
de <- as.dendrogram(hc1)
bitmap(file='test2.png')
if (par4 == 'TRUE'){
plot(de,main=main,ylab=ylab,xlab=xlab,horiz=par3, nodePar=list(pch = c(1,NA), cex=0.8, lab.cex = 0.8),type='t',center=T, sub=mysub)
} else {
plot(de,main=main,ylab=ylab,xlab=xlab,horiz=par3, nodePar=list(pch = c(1,NA), cex=0.8, lab.cex = 0.8), sub=mysub)
}
dev.off()
str(de)
}
load(file='createtable')
a<-table.start()
a<-table.row.start(a)
a<-table.element(a,'Summary of Dendrogram',2,TRUE)
a<-table.row.end(a)
a<-table.row.start(a)
a<-table.element(a,'Label',header=TRUE)
a<-table.element(a,'Height',header=TRUE)
a<-table.row.end(a)
num <- length(x[,1])-1
for (i in 1:num)
{
a<-table.row.start(a)
a<-table.element(a,hc$labels[i])
a<-table.element(a,hc$height[i])
a<-table.row.end(a)
}
a<-table.end(a)
table.save(a,file='mytable1.tab')
if (par2 != 'ALL'){
a<-table.start()
a<-table.row.start(a)
a<-table.element(a,'Summary of Cut Dendrogram',2,TRUE)
a<-table.row.end(a)
a<-table.row.start(a)
a<-table.element(a,'Label',header=TRUE)
a<-table.element(a,'Height',header=TRUE)
a<-table.row.end(a)
num <- par2-1
for (i in 1:num)
{
a<-table.row.start(a)
a<-table.element(a,i)
a<-table.element(a,hc1$height[i])
a<-table.row.end(a)
}
a<-table.end(a)
table.save(a,file='mytable2.tab')
}