Free Statistics

of Irreproducible Research!

Author's title

Author*Unverified author*
R Software Modulerwasp_hierarchicalclustering.wasp
Title produced by softwareHierarchical Clustering
Date of computationMon, 05 Nov 2007 13:12:50 -0700
Cite this page as followsStatistical Computations at FreeStatistics.org, Office for Research Development and Education, URL https://freestatistics.org/blog/index.php?v=date/2007/Nov/05/blr7826rhbut8dt1194293432.htm/, Retrieved Sun, 28 Apr 2024 19:01:11 +0000
Statistical Computations at FreeStatistics.org, Office for Research Development and Education, URL https://freestatistics.org/blog/index.php?pk=453, Retrieved Sun, 28 Apr 2024 19:01:11 +0000
QR Codes:

Original text written by user:
IsPrivate?No (this computation is public)
User-defined keywords
Estimated Impact179
Family? (F = Feedback message, R = changed R code, M = changed R Module, P = changed Parameters, D = changed Data)
-       [Hierarchical Clustering] [WS5Q2] [2007-11-05 20:12:50] [d66dce91cbb8b108f7114f1eb0c2faa2] [Current]
Feedback Forum

Post a new message
Dataseries X:
1178	2529	22	476049
2141	2196	27	474605
2238	3202	24	470439
2685	2718	24	461251
4341	2728	22	454724
5376	2354	23	455626
4478	2697	25	516847
6404	2651	23	525192
4617	2067	21	522975
3024	2641	21	518585
1897	2539	22	509239
2075	2294	20	512238
1351	2712	22	519164
2211	2314	22	517009
2453	3092	20	509933
3042	2677	21	509127
4765	2813	20	500857
4992	2668	21	506971
4601	2939	21	569323
6266	2617	21	579714
4812	2231	19	577992
3159	2481	21	565464
1916	2421	21	547344
2237	2408	22	554788
1595	2560	19	562325
2453	2100	24	560854
2226	3315	22	555332
3597	2801	22	543599
4706	2403	22	536662
4974	3024	24	542722
5756	2507	22	593530
5493	2980	23	610763
5004	2211	24	612613
3225	2471	21	611324
2006	2594	20	594167
2291	2452	22	595454
1588	2232	23	590865
2105	2373	23	589379
2191	3127	22	584428
3591	2802	20	573100
4668	2641	21	567456
4885	2787	21	569028
5822	2619	20	620735
5599	2806	20	628884
5340	2193	17	628232
3082	2323	18	612117
2010	2529	19	595404
2301	2412	19	597141
1514	2262	20	593408
1979	2154	21	590072
2480	3230	20	579799
3499	2295	21	574205
4676	2715	19	572775
5585	2733	22	572942
5610	2317	20	619567
5796	2730	18	625809
6199	1913	16	619916
3030	2390	17	587625
1930	2484	18	565742
2552	1960	19	557274


Summary of compuational transaction
Raw Inputview raw input (R code)
Raw Outputview raw output of R engine
Computing time1 seconds
R Server'Gwilym Jenkins' @ 72.249.127.135

\begin{tabular}{lllllllll}
\hline
Summary of compuational transaction \tabularnewline
Raw Input & view raw input (R code)  \tabularnewline
Raw Output & view raw output of R engine  \tabularnewline
Computing time & 1 seconds \tabularnewline
R Server & 'Gwilym Jenkins' @ 72.249.127.135 \tabularnewline
\hline
\end{tabular}
%Source: https://freestatistics.org/blog/index.php?pk=453&T=0

[TABLE]
[ROW][C]Summary of compuational transaction[/C][/ROW]
[ROW][C]Raw Input[/C][C]view raw input (R code) [/C][/ROW]
[ROW][C]Raw Output[/C][C]view raw output of R engine [/C][/ROW]
[ROW][C]Computing time[/C][C]1 seconds[/C][/ROW]
[ROW][C]R Server[/C][C]'Gwilym Jenkins' @ 72.249.127.135[/C][/ROW]
[/TABLE]
Source: https://freestatistics.org/blog/index.php?pk=453&T=0

Globally Unique Identifier (entire table): ba.freestatistics.org/blog/index.php?pk=453&T=0

As an alternative you can also use a QR Code:  

The GUIDs for individual cells are displayed in the table below:

Summary of compuational transaction
Raw Inputview raw input (R code)
Raw Outputview raw output of R engine
Computing time1 seconds
R Server'Gwilym Jenkins' @ 72.249.127.135


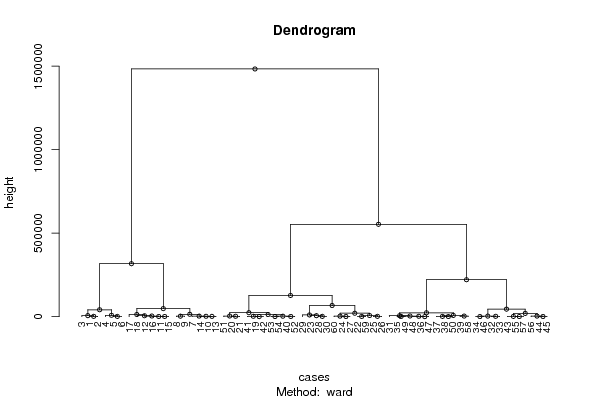
Summary of Dendrogram
LabelHeight
1295.633218701823
2436.789422948862
3737.62456575144
4794.955344657799
5819.274679213266
6924.393314558257
7931.645318777484
8963.519070906228
91047.17954525478
101057.68899020459
111144.15008093993
121219.23705652346
131260.05674475398
141315.03831839524
151398.96772675149
161422.92164225582
171647.72297428906
181763.98129241781
191767.31972206503
201771.78215365208
212062.27616967272
222178.02256336572
232181.00033463836
242203.18585645415
252286.56948287167
262685.23606573742
272906.80546304702
282938.06366876046
293243.51423575889
303276.0696565543
313386.43234097479
323426.50474947386
333833.5941467454
343871.78756077010
353881.33023526377
365476.18247872772
375844.8708710094
385915.60865715773
396101.31712069218
406764.14582855694
417302.86604888784
428179.0094372526
4310196.3373274743
4412735.6111602773
4512919.1564568013
4614135.9444337693
4719556.7934320916
4820433.3942626019
4923160.7762778737
5023707.7381125374
5141319.0411505885
5245071.3359821024
5348238.9100280187
5466807.8201752917
55126929.855936428
56221312.535286180
57317410.901249286
58553018.837273959
591483488.19364296

\begin{tabular}{lllllllll}
\hline
Summary of Dendrogram \tabularnewline
Label & Height \tabularnewline
1 & 295.633218701823 \tabularnewline
2 & 436.789422948862 \tabularnewline
3 & 737.62456575144 \tabularnewline
4 & 794.955344657799 \tabularnewline
5 & 819.274679213266 \tabularnewline
6 & 924.393314558257 \tabularnewline
7 & 931.645318777484 \tabularnewline
8 & 963.519070906228 \tabularnewline
9 & 1047.17954525478 \tabularnewline
10 & 1057.68899020459 \tabularnewline
11 & 1144.15008093993 \tabularnewline
12 & 1219.23705652346 \tabularnewline
13 & 1260.05674475398 \tabularnewline
14 & 1315.03831839524 \tabularnewline
15 & 1398.96772675149 \tabularnewline
16 & 1422.92164225582 \tabularnewline
17 & 1647.72297428906 \tabularnewline
18 & 1763.98129241781 \tabularnewline
19 & 1767.31972206503 \tabularnewline
20 & 1771.78215365208 \tabularnewline
21 & 2062.27616967272 \tabularnewline
22 & 2178.02256336572 \tabularnewline
23 & 2181.00033463836 \tabularnewline
24 & 2203.18585645415 \tabularnewline
25 & 2286.56948287167 \tabularnewline
26 & 2685.23606573742 \tabularnewline
27 & 2906.80546304702 \tabularnewline
28 & 2938.06366876046 \tabularnewline
29 & 3243.51423575889 \tabularnewline
30 & 3276.0696565543 \tabularnewline
31 & 3386.43234097479 \tabularnewline
32 & 3426.50474947386 \tabularnewline
33 & 3833.5941467454 \tabularnewline
34 & 3871.78756077010 \tabularnewline
35 & 3881.33023526377 \tabularnewline
36 & 5476.18247872772 \tabularnewline
37 & 5844.8708710094 \tabularnewline
38 & 5915.60865715773 \tabularnewline
39 & 6101.31712069218 \tabularnewline
40 & 6764.14582855694 \tabularnewline
41 & 7302.86604888784 \tabularnewline
42 & 8179.0094372526 \tabularnewline
43 & 10196.3373274743 \tabularnewline
44 & 12735.6111602773 \tabularnewline
45 & 12919.1564568013 \tabularnewline
46 & 14135.9444337693 \tabularnewline
47 & 19556.7934320916 \tabularnewline
48 & 20433.3942626019 \tabularnewline
49 & 23160.7762778737 \tabularnewline
50 & 23707.7381125374 \tabularnewline
51 & 41319.0411505885 \tabularnewline
52 & 45071.3359821024 \tabularnewline
53 & 48238.9100280187 \tabularnewline
54 & 66807.8201752917 \tabularnewline
55 & 126929.855936428 \tabularnewline
56 & 221312.535286180 \tabularnewline
57 & 317410.901249286 \tabularnewline
58 & 553018.837273959 \tabularnewline
59 & 1483488.19364296 \tabularnewline
\hline
\end{tabular}
%Source: https://freestatistics.org/blog/index.php?pk=453&T=1

[TABLE]
[ROW][C]Summary of Dendrogram[/C][/ROW]
[ROW][C]Label[/C][C]Height[/C][/ROW]
[ROW][C]1[/C][C]295.633218701823[/C][/ROW]
[ROW][C]2[/C][C]436.789422948862[/C][/ROW]
[ROW][C]3[/C][C]737.62456575144[/C][/ROW]
[ROW][C]4[/C][C]794.955344657799[/C][/ROW]
[ROW][C]5[/C][C]819.274679213266[/C][/ROW]
[ROW][C]6[/C][C]924.393314558257[/C][/ROW]
[ROW][C]7[/C][C]931.645318777484[/C][/ROW]
[ROW][C]8[/C][C]963.519070906228[/C][/ROW]
[ROW][C]9[/C][C]1047.17954525478[/C][/ROW]
[ROW][C]10[/C][C]1057.68899020459[/C][/ROW]
[ROW][C]11[/C][C]1144.15008093993[/C][/ROW]
[ROW][C]12[/C][C]1219.23705652346[/C][/ROW]
[ROW][C]13[/C][C]1260.05674475398[/C][/ROW]
[ROW][C]14[/C][C]1315.03831839524[/C][/ROW]
[ROW][C]15[/C][C]1398.96772675149[/C][/ROW]
[ROW][C]16[/C][C]1422.92164225582[/C][/ROW]
[ROW][C]17[/C][C]1647.72297428906[/C][/ROW]
[ROW][C]18[/C][C]1763.98129241781[/C][/ROW]
[ROW][C]19[/C][C]1767.31972206503[/C][/ROW]
[ROW][C]20[/C][C]1771.78215365208[/C][/ROW]
[ROW][C]21[/C][C]2062.27616967272[/C][/ROW]
[ROW][C]22[/C][C]2178.02256336572[/C][/ROW]
[ROW][C]23[/C][C]2181.00033463836[/C][/ROW]
[ROW][C]24[/C][C]2203.18585645415[/C][/ROW]
[ROW][C]25[/C][C]2286.56948287167[/C][/ROW]
[ROW][C]26[/C][C]2685.23606573742[/C][/ROW]
[ROW][C]27[/C][C]2906.80546304702[/C][/ROW]
[ROW][C]28[/C][C]2938.06366876046[/C][/ROW]
[ROW][C]29[/C][C]3243.51423575889[/C][/ROW]
[ROW][C]30[/C][C]3276.0696565543[/C][/ROW]
[ROW][C]31[/C][C]3386.43234097479[/C][/ROW]
[ROW][C]32[/C][C]3426.50474947386[/C][/ROW]
[ROW][C]33[/C][C]3833.5941467454[/C][/ROW]
[ROW][C]34[/C][C]3871.78756077010[/C][/ROW]
[ROW][C]35[/C][C]3881.33023526377[/C][/ROW]
[ROW][C]36[/C][C]5476.18247872772[/C][/ROW]
[ROW][C]37[/C][C]5844.8708710094[/C][/ROW]
[ROW][C]38[/C][C]5915.60865715773[/C][/ROW]
[ROW][C]39[/C][C]6101.31712069218[/C][/ROW]
[ROW][C]40[/C][C]6764.14582855694[/C][/ROW]
[ROW][C]41[/C][C]7302.86604888784[/C][/ROW]
[ROW][C]42[/C][C]8179.0094372526[/C][/ROW]
[ROW][C]43[/C][C]10196.3373274743[/C][/ROW]
[ROW][C]44[/C][C]12735.6111602773[/C][/ROW]
[ROW][C]45[/C][C]12919.1564568013[/C][/ROW]
[ROW][C]46[/C][C]14135.9444337693[/C][/ROW]
[ROW][C]47[/C][C]19556.7934320916[/C][/ROW]
[ROW][C]48[/C][C]20433.3942626019[/C][/ROW]
[ROW][C]49[/C][C]23160.7762778737[/C][/ROW]
[ROW][C]50[/C][C]23707.7381125374[/C][/ROW]
[ROW][C]51[/C][C]41319.0411505885[/C][/ROW]
[ROW][C]52[/C][C]45071.3359821024[/C][/ROW]
[ROW][C]53[/C][C]48238.9100280187[/C][/ROW]
[ROW][C]54[/C][C]66807.8201752917[/C][/ROW]
[ROW][C]55[/C][C]126929.855936428[/C][/ROW]
[ROW][C]56[/C][C]221312.535286180[/C][/ROW]
[ROW][C]57[/C][C]317410.901249286[/C][/ROW]
[ROW][C]58[/C][C]553018.837273959[/C][/ROW]
[ROW][C]59[/C][C]1483488.19364296[/C][/ROW]
[/TABLE]
Source: https://freestatistics.org/blog/index.php?pk=453&T=1

Globally Unique Identifier (entire table): ba.freestatistics.org/blog/index.php?pk=453&T=1

As an alternative you can also use a QR Code:  

The GUIDs for individual cells are displayed in the table below:

Summary of Dendrogram
LabelHeight
1295.633218701823
2436.789422948862
3737.62456575144
4794.955344657799
5819.274679213266
6924.393314558257
7931.645318777484
8963.519070906228
91047.17954525478
101057.68899020459
111144.15008093993
121219.23705652346
131260.05674475398
141315.03831839524
151398.96772675149
161422.92164225582
171647.72297428906
181763.98129241781
191767.31972206503
201771.78215365208
212062.27616967272
222178.02256336572
232181.00033463836
242203.18585645415
252286.56948287167
262685.23606573742
272906.80546304702
282938.06366876046
293243.51423575889
303276.0696565543
313386.43234097479
323426.50474947386
333833.5941467454
343871.78756077010
353881.33023526377
365476.18247872772
375844.8708710094
385915.60865715773
396101.31712069218
406764.14582855694
417302.86604888784
428179.0094372526
4310196.3373274743
4412735.6111602773
4512919.1564568013
4614135.9444337693
4719556.7934320916
4820433.3942626019
4923160.7762778737
5023707.7381125374
5141319.0411505885
5245071.3359821024
5348238.9100280187
5466807.8201752917
55126929.855936428
56221312.535286180
57317410.901249286
58553018.837273959
591483488.19364296


Parameters (Session):
par1 = ward ; par2 = ALL ; par3 = FALSE ; par4 = FALSE ;
Parameters (R input):
par1 = ward ; par2 = ALL ; par3 = FALSE ; par4 = FALSE ;
R code (references can be found in the software module):
par3 <- as.logical(par3)
par4 <- as.logical(par4)
if (par3 == 'TRUE'){
dum = xlab
xlab = ylab
ylab = dum
}
x <- t(y)
hc <- hclust(dist(x),method=par1)
d <- as.dendrogram(hc)
str(d)
mysub <- paste('Method: ',par1)
bitmap(file='test1.png')
if (par4 == 'TRUE'){
plot(d,main=main,ylab=ylab,xlab=xlab,horiz=par3, nodePar=list(pch = c(1,NA), cex=0.8, lab.cex = 0.8),type='t',center=T, sub=mysub)
} else {
plot(d,main=main,ylab=ylab,xlab=xlab,horiz=par3, nodePar=list(pch = c(1,NA), cex=0.8, lab.cex = 0.8), sub=mysub)
}
dev.off()
if (par2 != 'ALL'){
if (par3 == 'TRUE'){
ylab = 'cluster'
} else {
xlab = 'cluster'
}
par2 <- as.numeric(par2)
memb <- cutree(hc, k = par2)
cent <- NULL
for(k in 1:par2){
cent <- rbind(cent, colMeans(x[memb == k, , drop = FALSE]))
}
hc1 <- hclust(dist(cent),method=par1, members = table(memb))
de <- as.dendrogram(hc1)
bitmap(file='test2.png')
if (par4 == 'TRUE'){
plot(de,main=main,ylab=ylab,xlab=xlab,horiz=par3, nodePar=list(pch = c(1,NA), cex=0.8, lab.cex = 0.8),type='t',center=T, sub=mysub)
} else {
plot(de,main=main,ylab=ylab,xlab=xlab,horiz=par3, nodePar=list(pch = c(1,NA), cex=0.8, lab.cex = 0.8), sub=mysub)
}
dev.off()
str(de)
}
load(file='createtable')
a<-table.start()
a<-table.row.start(a)
a<-table.element(a,'Summary of Dendrogram',2,TRUE)
a<-table.row.end(a)
a<-table.row.start(a)
a<-table.element(a,'Label',header=TRUE)
a<-table.element(a,'Height',header=TRUE)
a<-table.row.end(a)
num <- length(x[,1])-1
for (i in 1:num)
{
a<-table.row.start(a)
a<-table.element(a,hc$labels[i])
a<-table.element(a,hc$height[i])
a<-table.row.end(a)
}
a<-table.end(a)
table.save(a,file='mytable1.tab')
if (par2 != 'ALL'){
a<-table.start()
a<-table.row.start(a)
a<-table.element(a,'Summary of Cut Dendrogram',2,TRUE)
a<-table.row.end(a)
a<-table.row.start(a)
a<-table.element(a,'Label',header=TRUE)
a<-table.element(a,'Height',header=TRUE)
a<-table.row.end(a)
num <- par2-1
for (i in 1:num)
{
a<-table.row.start(a)
a<-table.element(a,i)
a<-table.element(a,hc1$height[i])
a<-table.row.end(a)
}
a<-table.end(a)
table.save(a,file='mytable2.tab')
}