Free Statistics

of Irreproducible Research!

Author's title

Author*Unverified author*
R Software Modulerwasp_hierarchicalclustering.wasp
Title produced by softwareHierarchical Clustering
Date of computationMon, 05 Nov 2007 13:13:21 -0700
Cite this page as followsStatistical Computations at FreeStatistics.org, Office for Research Development and Education, URL https://freestatistics.org/blog/index.php?v=date/2007/Nov/05/6f1uns2lprz5i771194293472.htm/, Retrieved Mon, 29 Apr 2024 04:17:05 +0000
Statistical Computations at FreeStatistics.org, Office for Research Development and Education, URL https://freestatistics.org/blog/index.php?pk=424, Retrieved Mon, 29 Apr 2024 04:17:05 +0000
QR Codes:

Original text written by user:
IsPrivate?No (this computation is public)
User-defined keywords
Estimated Impact246
Family? (F = Feedback message, R = changed R code, M = changed R Module, P = changed Parameters, D = changed Data)
-       [Hierarchical Clustering] [deel Q2 Dendrogram] [2007-11-05 20:13:21] [d41d8cd98f00b204e9800998ecf8427e] [Current]
Feedback Forum

Post a new message
Dataseries X:
112.6	105.1	88.8
113.8	113.3	93.4
107.8	99.1	92.6
103.2	100.3	90.7
103.3	93.5	81.6
101.2	98.8	84.1
107.7	106.2	88.1
110.4	98.3	85.3
101.9	102.1	82.9
115.9	117.1	84.8
89.9	101.5	71.2
88.6	80.5	68.9
117.2	105.9	94.3
123.9	109.5	97.6
100.0	97.2	85.6
103.6	114.5	91.9
94.1	93.5	75.8
98.7	100.9	79.8
119.5	121.1	99.0
112.7	116.5	88.5
104.4	109.3	86.7
124.7	118.1	97.9
89.1	108.3	94.3
97.0	105.4	72.9
121.6	116.2	91.8
118.8	111.2	93.2
114.0	105.8	86.5
111.5	122.7	98.9
97.2	99.5	77.2
102.5	107.9	79.4
113.4	124.6	90.4
109.8	115.0	81.4
104.9	110.3	85.8
126.1	132.7	103.6
80.0	99.7	73.6
96.8	96.5	75.7
117.2	118.7	99.2
112.3	112.9	88.7
117.3	130.5	94.6
111.1	137.9	98.7
102.2	115.0	84.2
104.3	116.8	87.7
122.9	140.9	103.3
107.6	120.7	88.2
121.3	134.2	93.4
131.5	147.3	106.3
89.0	112.4	73.1
104.4	107.1	78.6
128.9	128.4	101.6
135.9	137.7	101.4
133.3	135.0	98.5
121.3	151.0	99.0
120.5	137.4	89.5
120.4	132.4	83.5
137.9	161.3	97.4
126.1	139.8	87.8
133.2	146.0	90.4
146.6	154.6	97.1
103.4	142.1	79.4
117.2	120.5	85.0


Summary of compuational transaction
Raw Inputview raw input (R code)
Raw Outputview raw output of R engine
Computing time2 seconds
R Server'Gwilym Jenkins' @ 72.249.127.135

\begin{tabular}{lllllllll}
\hline
Summary of compuational transaction \tabularnewline
Raw Input & view raw input (R code)  \tabularnewline
Raw Output & view raw output of R engine  \tabularnewline
Computing time & 2 seconds \tabularnewline
R Server & 'Gwilym Jenkins' @ 72.249.127.135 \tabularnewline
\hline
\end{tabular}
%Source: https://freestatistics.org/blog/index.php?pk=424&T=0

[TABLE]
[ROW][C]Summary of compuational transaction[/C][/ROW]
[ROW][C]Raw Input[/C][C]view raw input (R code) [/C][/ROW]
[ROW][C]Raw Output[/C][C]view raw output of R engine [/C][/ROW]
[ROW][C]Computing time[/C][C]2 seconds[/C][/ROW]
[ROW][C]R Server[/C][C]'Gwilym Jenkins' @ 72.249.127.135[/C][/ROW]
[/TABLE]
Source: https://freestatistics.org/blog/index.php?pk=424&T=0

Globally Unique Identifier (entire table): ba.freestatistics.org/blog/index.php?pk=424&T=0

As an alternative you can also use a QR Code:  

The GUIDs for individual cells are displayed in the table below:

Summary of compuational transaction
Raw Inputview raw input (R code)
Raw Outputview raw output of R engine
Computing time2 seconds
R Server'Gwilym Jenkins' @ 72.249.127.135


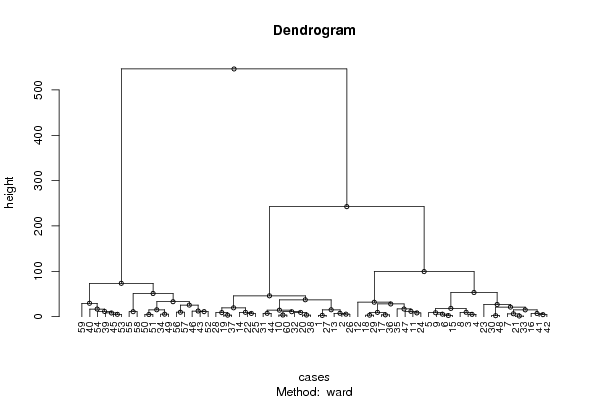
Summary of Dendrogram
LabelHeight
11.43527000944074
22.21133443874961
32.5
42.78208554864871
53.31209903233584
63.33016516106933
73.62767142944341
83.64554522671164
94.03732584763727
104.46094160463909
114.73919824442911
125.10783711564887
135.11957029446807
145.42678542048605
155.49264750445506
165.50726792520574
176.32887256522034
186.96742948092311
197.1014083110324
207.32734604068895
217.41624236261916
228.12201234317024
238.27707677867011
248.70426158295742
258.97593127893952
269.33184557100894
279.41008788745003
289.49797320653737
299.63342532765586
309.7780366127357
3110.8775844869988
3210.9849897587572
3311.0932411855147
3411.4893826934431
3511.7295930420072
3612.4418513164528
3714.3391448490011
3814.9928687645068
3915.1247316299383
4015.1608662566339
4116.8063405942193
4216.9293629047498
4318.2144136233904
4419.4688428696746
4521.0718313992064
4625.4898075869372
4726.7932621860244
4828.0133373133468
4929.5135530284135
5031.8323656778116
5132.9792526066896
5237.2312808889184
5345.9127771504856
5451.1128890074464
5553.1906678636262
5673.5283321668913
5799.4066206469529
58242.640006945078
59546.248787385934

\begin{tabular}{lllllllll}
\hline
Summary of Dendrogram \tabularnewline
Label & Height \tabularnewline
1 & 1.43527000944074 \tabularnewline
2 & 2.21133443874961 \tabularnewline
3 & 2.5 \tabularnewline
4 & 2.78208554864871 \tabularnewline
5 & 3.31209903233584 \tabularnewline
6 & 3.33016516106933 \tabularnewline
7 & 3.62767142944341 \tabularnewline
8 & 3.64554522671164 \tabularnewline
9 & 4.03732584763727 \tabularnewline
10 & 4.46094160463909 \tabularnewline
11 & 4.73919824442911 \tabularnewline
12 & 5.10783711564887 \tabularnewline
13 & 5.11957029446807 \tabularnewline
14 & 5.42678542048605 \tabularnewline
15 & 5.49264750445506 \tabularnewline
16 & 5.50726792520574 \tabularnewline
17 & 6.32887256522034 \tabularnewline
18 & 6.96742948092311 \tabularnewline
19 & 7.1014083110324 \tabularnewline
20 & 7.32734604068895 \tabularnewline
21 & 7.41624236261916 \tabularnewline
22 & 8.12201234317024 \tabularnewline
23 & 8.27707677867011 \tabularnewline
24 & 8.70426158295742 \tabularnewline
25 & 8.97593127893952 \tabularnewline
26 & 9.33184557100894 \tabularnewline
27 & 9.41008788745003 \tabularnewline
28 & 9.49797320653737 \tabularnewline
29 & 9.63342532765586 \tabularnewline
30 & 9.7780366127357 \tabularnewline
31 & 10.8775844869988 \tabularnewline
32 & 10.9849897587572 \tabularnewline
33 & 11.0932411855147 \tabularnewline
34 & 11.4893826934431 \tabularnewline
35 & 11.7295930420072 \tabularnewline
36 & 12.4418513164528 \tabularnewline
37 & 14.3391448490011 \tabularnewline
38 & 14.9928687645068 \tabularnewline
39 & 15.1247316299383 \tabularnewline
40 & 15.1608662566339 \tabularnewline
41 & 16.8063405942193 \tabularnewline
42 & 16.9293629047498 \tabularnewline
43 & 18.2144136233904 \tabularnewline
44 & 19.4688428696746 \tabularnewline
45 & 21.0718313992064 \tabularnewline
46 & 25.4898075869372 \tabularnewline
47 & 26.7932621860244 \tabularnewline
48 & 28.0133373133468 \tabularnewline
49 & 29.5135530284135 \tabularnewline
50 & 31.8323656778116 \tabularnewline
51 & 32.9792526066896 \tabularnewline
52 & 37.2312808889184 \tabularnewline
53 & 45.9127771504856 \tabularnewline
54 & 51.1128890074464 \tabularnewline
55 & 53.1906678636262 \tabularnewline
56 & 73.5283321668913 \tabularnewline
57 & 99.4066206469529 \tabularnewline
58 & 242.640006945078 \tabularnewline
59 & 546.248787385934 \tabularnewline
\hline
\end{tabular}
%Source: https://freestatistics.org/blog/index.php?pk=424&T=1

[TABLE]
[ROW][C]Summary of Dendrogram[/C][/ROW]
[ROW][C]Label[/C][C]Height[/C][/ROW]
[ROW][C]1[/C][C]1.43527000944074[/C][/ROW]
[ROW][C]2[/C][C]2.21133443874961[/C][/ROW]
[ROW][C]3[/C][C]2.5[/C][/ROW]
[ROW][C]4[/C][C]2.78208554864871[/C][/ROW]
[ROW][C]5[/C][C]3.31209903233584[/C][/ROW]
[ROW][C]6[/C][C]3.33016516106933[/C][/ROW]
[ROW][C]7[/C][C]3.62767142944341[/C][/ROW]
[ROW][C]8[/C][C]3.64554522671164[/C][/ROW]
[ROW][C]9[/C][C]4.03732584763727[/C][/ROW]
[ROW][C]10[/C][C]4.46094160463909[/C][/ROW]
[ROW][C]11[/C][C]4.73919824442911[/C][/ROW]
[ROW][C]12[/C][C]5.10783711564887[/C][/ROW]
[ROW][C]13[/C][C]5.11957029446807[/C][/ROW]
[ROW][C]14[/C][C]5.42678542048605[/C][/ROW]
[ROW][C]15[/C][C]5.49264750445506[/C][/ROW]
[ROW][C]16[/C][C]5.50726792520574[/C][/ROW]
[ROW][C]17[/C][C]6.32887256522034[/C][/ROW]
[ROW][C]18[/C][C]6.96742948092311[/C][/ROW]
[ROW][C]19[/C][C]7.1014083110324[/C][/ROW]
[ROW][C]20[/C][C]7.32734604068895[/C][/ROW]
[ROW][C]21[/C][C]7.41624236261916[/C][/ROW]
[ROW][C]22[/C][C]8.12201234317024[/C][/ROW]
[ROW][C]23[/C][C]8.27707677867011[/C][/ROW]
[ROW][C]24[/C][C]8.70426158295742[/C][/ROW]
[ROW][C]25[/C][C]8.97593127893952[/C][/ROW]
[ROW][C]26[/C][C]9.33184557100894[/C][/ROW]
[ROW][C]27[/C][C]9.41008788745003[/C][/ROW]
[ROW][C]28[/C][C]9.49797320653737[/C][/ROW]
[ROW][C]29[/C][C]9.63342532765586[/C][/ROW]
[ROW][C]30[/C][C]9.7780366127357[/C][/ROW]
[ROW][C]31[/C][C]10.8775844869988[/C][/ROW]
[ROW][C]32[/C][C]10.9849897587572[/C][/ROW]
[ROW][C]33[/C][C]11.0932411855147[/C][/ROW]
[ROW][C]34[/C][C]11.4893826934431[/C][/ROW]
[ROW][C]35[/C][C]11.7295930420072[/C][/ROW]
[ROW][C]36[/C][C]12.4418513164528[/C][/ROW]
[ROW][C]37[/C][C]14.3391448490011[/C][/ROW]
[ROW][C]38[/C][C]14.9928687645068[/C][/ROW]
[ROW][C]39[/C][C]15.1247316299383[/C][/ROW]
[ROW][C]40[/C][C]15.1608662566339[/C][/ROW]
[ROW][C]41[/C][C]16.8063405942193[/C][/ROW]
[ROW][C]42[/C][C]16.9293629047498[/C][/ROW]
[ROW][C]43[/C][C]18.2144136233904[/C][/ROW]
[ROW][C]44[/C][C]19.4688428696746[/C][/ROW]
[ROW][C]45[/C][C]21.0718313992064[/C][/ROW]
[ROW][C]46[/C][C]25.4898075869372[/C][/ROW]
[ROW][C]47[/C][C]26.7932621860244[/C][/ROW]
[ROW][C]48[/C][C]28.0133373133468[/C][/ROW]
[ROW][C]49[/C][C]29.5135530284135[/C][/ROW]
[ROW][C]50[/C][C]31.8323656778116[/C][/ROW]
[ROW][C]51[/C][C]32.9792526066896[/C][/ROW]
[ROW][C]52[/C][C]37.2312808889184[/C][/ROW]
[ROW][C]53[/C][C]45.9127771504856[/C][/ROW]
[ROW][C]54[/C][C]51.1128890074464[/C][/ROW]
[ROW][C]55[/C][C]53.1906678636262[/C][/ROW]
[ROW][C]56[/C][C]73.5283321668913[/C][/ROW]
[ROW][C]57[/C][C]99.4066206469529[/C][/ROW]
[ROW][C]58[/C][C]242.640006945078[/C][/ROW]
[ROW][C]59[/C][C]546.248787385934[/C][/ROW]
[/TABLE]
Source: https://freestatistics.org/blog/index.php?pk=424&T=1

Globally Unique Identifier (entire table): ba.freestatistics.org/blog/index.php?pk=424&T=1

As an alternative you can also use a QR Code:  

The GUIDs for individual cells are displayed in the table below:

Summary of Dendrogram
LabelHeight
11.43527000944074
22.21133443874961
32.5
42.78208554864871
53.31209903233584
63.33016516106933
73.62767142944341
83.64554522671164
94.03732584763727
104.46094160463909
114.73919824442911
125.10783711564887
135.11957029446807
145.42678542048605
155.49264750445506
165.50726792520574
176.32887256522034
186.96742948092311
197.1014083110324
207.32734604068895
217.41624236261916
228.12201234317024
238.27707677867011
248.70426158295742
258.97593127893952
269.33184557100894
279.41008788745003
289.49797320653737
299.63342532765586
309.7780366127357
3110.8775844869988
3210.9849897587572
3311.0932411855147
3411.4893826934431
3511.7295930420072
3612.4418513164528
3714.3391448490011
3814.9928687645068
3915.1247316299383
4015.1608662566339
4116.8063405942193
4216.9293629047498
4318.2144136233904
4419.4688428696746
4521.0718313992064
4625.4898075869372
4726.7932621860244
4828.0133373133468
4929.5135530284135
5031.8323656778116
5132.9792526066896
5237.2312808889184
5345.9127771504856
5451.1128890074464
5553.1906678636262
5673.5283321668913
5799.4066206469529
58242.640006945078
59546.248787385934


Parameters (Session):
par1 = ward ; par2 = ALL ; par3 = FALSE ; par4 = FALSE ;
Parameters (R input):
par1 = ward ; par2 = ALL ; par3 = FALSE ; par4 = FALSE ;
R code (references can be found in the software module):
par3 <- as.logical(par3)
par4 <- as.logical(par4)
if (par3 == 'TRUE'){
dum = xlab
xlab = ylab
ylab = dum
}
x <- t(y)
hc <- hclust(dist(x),method=par1)
d <- as.dendrogram(hc)
str(d)
mysub <- paste('Method: ',par1)
bitmap(file='test1.png')
if (par4 == 'TRUE'){
plot(d,main=main,ylab=ylab,xlab=xlab,horiz=par3, nodePar=list(pch = c(1,NA), cex=0.8, lab.cex = 0.8),type='t',center=T, sub=mysub)
} else {
plot(d,main=main,ylab=ylab,xlab=xlab,horiz=par3, nodePar=list(pch = c(1,NA), cex=0.8, lab.cex = 0.8), sub=mysub)
}
dev.off()
if (par2 != 'ALL'){
if (par3 == 'TRUE'){
ylab = 'cluster'
} else {
xlab = 'cluster'
}
par2 <- as.numeric(par2)
memb <- cutree(hc, k = par2)
cent <- NULL
for(k in 1:par2){
cent <- rbind(cent, colMeans(x[memb == k, , drop = FALSE]))
}
hc1 <- hclust(dist(cent),method=par1, members = table(memb))
de <- as.dendrogram(hc1)
bitmap(file='test2.png')
if (par4 == 'TRUE'){
plot(de,main=main,ylab=ylab,xlab=xlab,horiz=par3, nodePar=list(pch = c(1,NA), cex=0.8, lab.cex = 0.8),type='t',center=T, sub=mysub)
} else {
plot(de,main=main,ylab=ylab,xlab=xlab,horiz=par3, nodePar=list(pch = c(1,NA), cex=0.8, lab.cex = 0.8), sub=mysub)
}
dev.off()
str(de)
}
load(file='createtable')
a<-table.start()
a<-table.row.start(a)
a<-table.element(a,'Summary of Dendrogram',2,TRUE)
a<-table.row.end(a)
a<-table.row.start(a)
a<-table.element(a,'Label',header=TRUE)
a<-table.element(a,'Height',header=TRUE)
a<-table.row.end(a)
num <- length(x[,1])-1
for (i in 1:num)
{
a<-table.row.start(a)
a<-table.element(a,hc$labels[i])
a<-table.element(a,hc$height[i])
a<-table.row.end(a)
}
a<-table.end(a)
table.save(a,file='mytable1.tab')
if (par2 != 'ALL'){
a<-table.start()
a<-table.row.start(a)
a<-table.element(a,'Summary of Cut Dendrogram',2,TRUE)
a<-table.row.end(a)
a<-table.row.start(a)
a<-table.element(a,'Label',header=TRUE)
a<-table.element(a,'Height',header=TRUE)
a<-table.row.end(a)
num <- par2-1
for (i in 1:num)
{
a<-table.row.start(a)
a<-table.element(a,i)
a<-table.element(a,hc1$height[i])
a<-table.row.end(a)
}
a<-table.end(a)
table.save(a,file='mytable2.tab')
}