Free Statistics
of Irreproducible Research!
Description of Statistical Computation | |||||||||||||||||||||
|---|---|---|---|---|---|---|---|---|---|---|---|---|---|---|---|---|---|---|---|---|---|
| Author's title | |||||||||||||||||||||
| Author | *Unverified author* | ||||||||||||||||||||
| R Software Module | rwasp_cloud.wasp | ||||||||||||||||||||
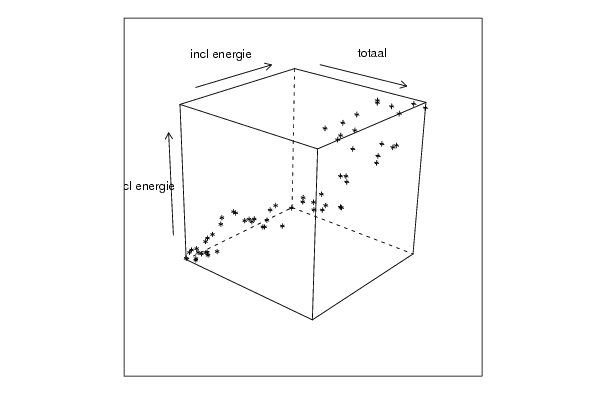
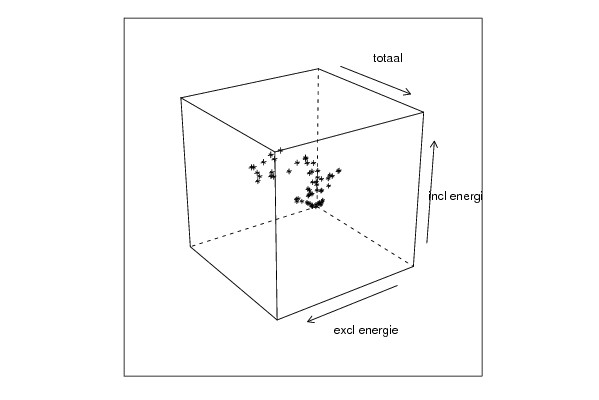
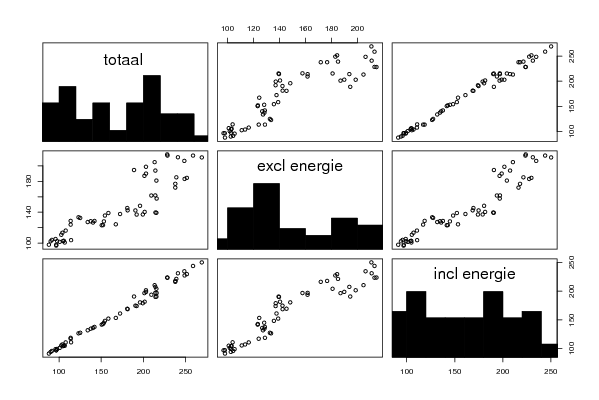
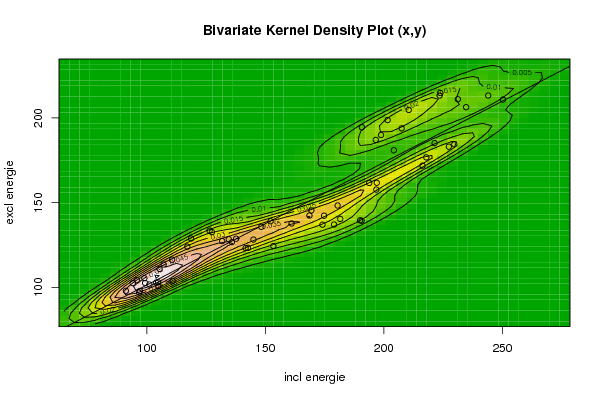
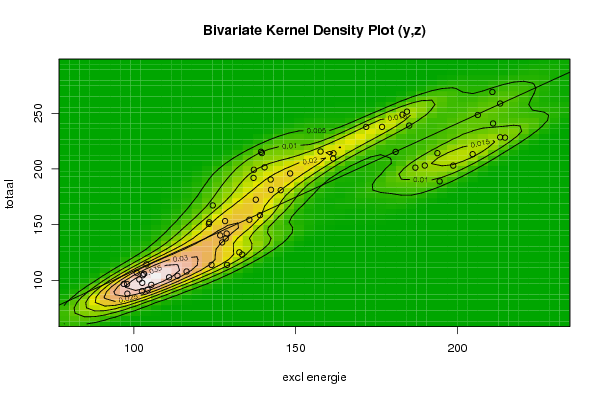
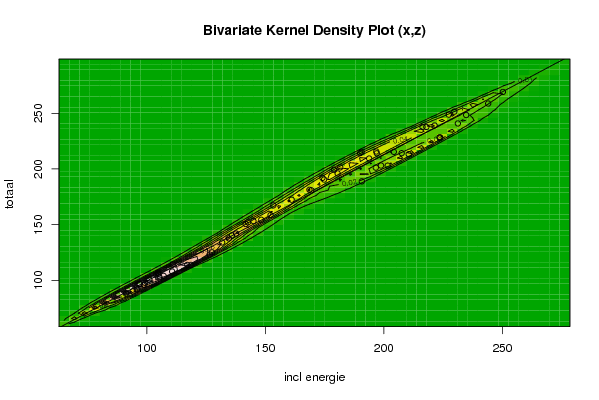
| Title produced by software | Trivariate Scatterplots | ||||||||||||||||||||
| Date of computation | Mon, 05 Nov 2007 03:19:55 -0700 | ||||||||||||||||||||
| Cite this page as follows | Statistical Computations at FreeStatistics.org, Office for Research Development and Education, URL https://freestatistics.org/blog/index.php?v=date/2007/Nov/05/4n22ak8um5s437d1194257862.htm/, Retrieved Sun, 28 Apr 2024 20:46:04 +0000 | ||||||||||||||||||||
| Statistical Computations at FreeStatistics.org, Office for Research Development and Education, URL https://freestatistics.org/blog/index.php?pk=418, Retrieved Sun, 28 Apr 2024 20:46:04 +0000 | |||||||||||||||||||||
| QR Codes: | |||||||||||||||||||||
|
| |||||||||||||||||||||
| Original text written by user: | |||||||||||||||||||||
| IsPrivate? | No (this computation is public) | ||||||||||||||||||||
| User-defined keywords | |||||||||||||||||||||
| Estimated Impact | 252 | ||||||||||||||||||||
Tree of Dependent Computations | |||||||||||||||||||||
| Family? (F = Feedback message, R = changed R code, M = changed R Module, P = changed Parameters, D = changed Data) | |||||||||||||||||||||
| - [Trivariate Scatterplots] [trivariate ] [2007-11-05 10:19:55] [1a2581828a3030ed7733053b32a6f065] [Current] F D [Trivariate Scatterplots] [] [2008-11-06 16:16:57] [139ab77a283673d78791815259c298e6] | |||||||||||||||||||||
| Feedback Forum | |||||||||||||||||||||
Post a new message | |||||||||||||||||||||
Dataset | |||||||||||||||||||||
| Dataseries X: | |||||||||||||||||||||
96,8 91,2 97,1 104,9 110,9 104,8 94,1 95,8 99,3 101,1 104,0 99,0 105,4 107,1 110,7 117,1 118,7 126,5 127,5 134,6 131,8 135,9 142,7 141,7 153,4 145,0 137,7 148,3 152,2 169,4 168,6 161,1 174,1 179,0 190,6 190,0 181,6 174,8 180,5 196,8 193,8 197,0 216,3 221,4 217,9 229,7 227,4 204,2 196,6 198,8 207,5 190,7 201,6 210,5 223,5 223,8 231,2 244,0 234,7 250,2 | |||||||||||||||||||||
| Dataseries Y: | |||||||||||||||||||||
96,9 98,0 97,9 100,9 103,9 103,1 102,5 104,3 102,6 101,7 102,8 105,4 110,9 113,5 116,3 124,0 128,8 133,5 132,6 128,4 127,3 126,7 123,3 123,2 124,4 128,2 128,7 135,7 139,0 145,4 142,4 137,7 137,0 137,1 139,3 139,6 140,4 142,3 148,3 157,7 161,6 161,7 171,8 185,1 176,7 184,4 183,0 180,9 187,0 189,9 193,8 194,5 198,7 204,7 213,2 214,7 211,0 213,2 206,3 210,8 | |||||||||||||||||||||
| Dataseries Z: | |||||||||||||||||||||
96,7 88,0 96,7 106,8 114,3 105,7 90,1 91,6 97,7 100,8 104,6 95,9 102,7 104,0 107,9 113,8 113,8 123,1 125,1 137,6 134,0 140,3 152,1 150,6 167,3 153,2 142,0 154,4 158,5 180,9 181,3 172,4 192,0 199,3 215,4 214,3 201,5 190,5 196,0 215,7 209,4 214,1 237,8 239,0 237,8 251,5 248,8 215,4 201,2 203,1 214,2 188,9 203,0 213,3 228,5 228,2 240,9 258,8 248,5 269,2 | |||||||||||||||||||||
Tables (Output of Computation) | |||||||||||||||||||||
| |||||||||||||||||||||
Figures (Output of Computation) | |||||||||||||||||||||
Input Parameters & R Code | |||||||||||||||||||||
| Parameters (Session): | |||||||||||||||||||||
| par1 = 50 ; par2 = 50 ; par3 = Y ; par4 = Y ; par5 = incl energie ; par6 = excl energie ; par7 = totaal ; | |||||||||||||||||||||
| Parameters (R input): | |||||||||||||||||||||
| par1 = 50 ; par2 = 50 ; par3 = Y ; par4 = Y ; par5 = incl energie ; par6 = excl energie ; par7 = totaal ; | |||||||||||||||||||||
| R code (references can be found in the software module): | |||||||||||||||||||||
x <- array(x,dim=c(length(x),1)) | |||||||||||||||||||||