Free Statistics

of Irreproducible Research!

Author's title

Author*Unverified author*
R Software Modulerwasp_hierarchicalclustering.wasp
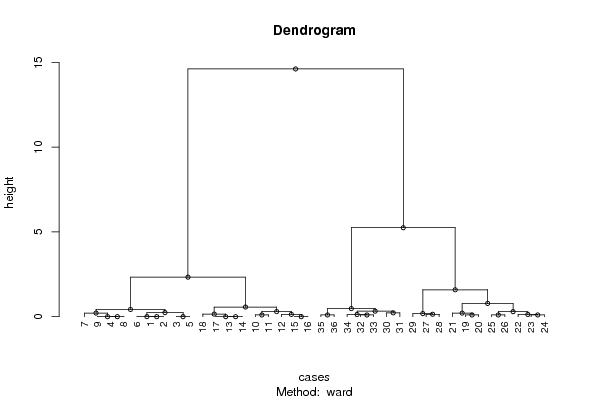
Title produced by softwareHierarchical Clustering
Date of computationMon, 05 Nov 2007 08:21:39 -0700
Cite this page as followsStatistical Computations at FreeStatistics.org, Office for Research Development and Education, URL https://freestatistics.org/blog/index.php?v=date/2007/Nov/05/1gc5p4s0o0ohlha1194276062.htm/, Retrieved Mon, 29 Apr 2024 04:02:46 +0000
Statistical Computations at FreeStatistics.org, Office for Research Development and Education, URL https://freestatistics.org/blog/index.php?pk=401, Retrieved Mon, 29 Apr 2024 04:02:46 +0000
QR Codes:

Original text written by user:
IsPrivate?No (this computation is public)
User-defined keywordsWorkshop 4 EDA Deel 3 Q2
Estimated Impact233
Family? (F = Feedback message, R = changed R code, M = changed R Module, P = changed Parameters, D = changed Data)
-       [Hierarchical Clustering] [Workshop 4 - EDA ...] [2007-11-05 15:21:39] [3463f71ebce131edf0c83e066f45702c] [Current]
Feedback Forum

Post a new message
Dataseries X:
8,5	8,8
8,5	8,8
8,5	8,7
8,4	8,7
8,5	8,7
8,5	8,8
8,3	8,8
8,4	8,7
8,4	8,7
8,4	8,6
8,4	8,5
8,4	8,4
8,5	8,3
8,5	8,3
8,5	8,4
8,5	8,4
8,5	8,3
8,5	8,2
8,3	8,1
8,3	8
8,4	7,9
8,2	7,9
8,2	7,8
8,1	7,8
8,1	7,7
8	7,7
7,8	7,6
7,9	7,5
7,8	7,4
7,7	7,2
7,9	7,1
7,8	7
7,7	7
7,7	6,9
7,6	6,9
7,5	6,9


Summary of compuational transaction
Raw Inputview raw input (R code)
Raw Outputview raw output of R engine
Computing time1 seconds
R Server'Gwilym Jenkins' @ 72.249.127.135

\begin{tabular}{lllllllll}
\hline
Summary of compuational transaction \tabularnewline
Raw Input & view raw input (R code)  \tabularnewline
Raw Output & view raw output of R engine  \tabularnewline
Computing time & 1 seconds \tabularnewline
R Server & 'Gwilym Jenkins' @ 72.249.127.135 \tabularnewline
\hline
\end{tabular}
%Source: https://freestatistics.org/blog/index.php?pk=401&T=0

[TABLE]
[ROW][C]Summary of compuational transaction[/C][/ROW]
[ROW][C]Raw Input[/C][C]view raw input (R code) [/C][/ROW]
[ROW][C]Raw Output[/C][C]view raw output of R engine [/C][/ROW]
[ROW][C]Computing time[/C][C]1 seconds[/C][/ROW]
[ROW][C]R Server[/C][C]'Gwilym Jenkins' @ 72.249.127.135[/C][/ROW]
[/TABLE]
Source: https://freestatistics.org/blog/index.php?pk=401&T=0

Globally Unique Identifier (entire table): ba.freestatistics.org/blog/index.php?pk=401&T=0

As an alternative you can also use a QR Code:  

The GUIDs for individual cells are displayed in the table below:

Summary of compuational transaction
Raw Inputview raw input (R code)
Raw Outputview raw output of R engine
Computing time1 seconds
R Server'Gwilym Jenkins' @ 72.249.127.135


Summary of Dendrogram
LabelHeight
10
20
30
40
50
60
70
80
90.0999999999999996
100.0999999999999996
110.0999999999999996
120.0999999999999996
130.0999999999999996
140.0999999999999996
150.127614237491539
160.127614237491540
170.133333333333333
180.141421356237310
190.150000000000002
200.180473785412436
210.210018769324858
220.212132034355965
230.223606797749979
240.240000000000003
250.294113913183062
260.298689189856496
270.323381292038151
280.42437238127685
290.47566057345258
300.568192853324732
310.780064371755636
321.58484521757456
332.33123921767423
345.24947708302319
3514.6213693852549

\begin{tabular}{lllllllll}
\hline
Summary of Dendrogram \tabularnewline
Label & Height \tabularnewline
1 & 0 \tabularnewline
2 & 0 \tabularnewline
3 & 0 \tabularnewline
4 & 0 \tabularnewline
5 & 0 \tabularnewline
6 & 0 \tabularnewline
7 & 0 \tabularnewline
8 & 0 \tabularnewline
9 & 0.0999999999999996 \tabularnewline
10 & 0.0999999999999996 \tabularnewline
11 & 0.0999999999999996 \tabularnewline
12 & 0.0999999999999996 \tabularnewline
13 & 0.0999999999999996 \tabularnewline
14 & 0.0999999999999996 \tabularnewline
15 & 0.127614237491539 \tabularnewline
16 & 0.127614237491540 \tabularnewline
17 & 0.133333333333333 \tabularnewline
18 & 0.141421356237310 \tabularnewline
19 & 0.150000000000002 \tabularnewline
20 & 0.180473785412436 \tabularnewline
21 & 0.210018769324858 \tabularnewline
22 & 0.212132034355965 \tabularnewline
23 & 0.223606797749979 \tabularnewline
24 & 0.240000000000003 \tabularnewline
25 & 0.294113913183062 \tabularnewline
26 & 0.298689189856496 \tabularnewline
27 & 0.323381292038151 \tabularnewline
28 & 0.42437238127685 \tabularnewline
29 & 0.47566057345258 \tabularnewline
30 & 0.568192853324732 \tabularnewline
31 & 0.780064371755636 \tabularnewline
32 & 1.58484521757456 \tabularnewline
33 & 2.33123921767423 \tabularnewline
34 & 5.24947708302319 \tabularnewline
35 & 14.6213693852549 \tabularnewline
\hline
\end{tabular}
%Source: https://freestatistics.org/blog/index.php?pk=401&T=1

[TABLE]
[ROW][C]Summary of Dendrogram[/C][/ROW]
[ROW][C]Label[/C][C]Height[/C][/ROW]
[ROW][C]1[/C][C]0[/C][/ROW]
[ROW][C]2[/C][C]0[/C][/ROW]
[ROW][C]3[/C][C]0[/C][/ROW]
[ROW][C]4[/C][C]0[/C][/ROW]
[ROW][C]5[/C][C]0[/C][/ROW]
[ROW][C]6[/C][C]0[/C][/ROW]
[ROW][C]7[/C][C]0[/C][/ROW]
[ROW][C]8[/C][C]0[/C][/ROW]
[ROW][C]9[/C][C]0.0999999999999996[/C][/ROW]
[ROW][C]10[/C][C]0.0999999999999996[/C][/ROW]
[ROW][C]11[/C][C]0.0999999999999996[/C][/ROW]
[ROW][C]12[/C][C]0.0999999999999996[/C][/ROW]
[ROW][C]13[/C][C]0.0999999999999996[/C][/ROW]
[ROW][C]14[/C][C]0.0999999999999996[/C][/ROW]
[ROW][C]15[/C][C]0.127614237491539[/C][/ROW]
[ROW][C]16[/C][C]0.127614237491540[/C][/ROW]
[ROW][C]17[/C][C]0.133333333333333[/C][/ROW]
[ROW][C]18[/C][C]0.141421356237310[/C][/ROW]
[ROW][C]19[/C][C]0.150000000000002[/C][/ROW]
[ROW][C]20[/C][C]0.180473785412436[/C][/ROW]
[ROW][C]21[/C][C]0.210018769324858[/C][/ROW]
[ROW][C]22[/C][C]0.212132034355965[/C][/ROW]
[ROW][C]23[/C][C]0.223606797749979[/C][/ROW]
[ROW][C]24[/C][C]0.240000000000003[/C][/ROW]
[ROW][C]25[/C][C]0.294113913183062[/C][/ROW]
[ROW][C]26[/C][C]0.298689189856496[/C][/ROW]
[ROW][C]27[/C][C]0.323381292038151[/C][/ROW]
[ROW][C]28[/C][C]0.42437238127685[/C][/ROW]
[ROW][C]29[/C][C]0.47566057345258[/C][/ROW]
[ROW][C]30[/C][C]0.568192853324732[/C][/ROW]
[ROW][C]31[/C][C]0.780064371755636[/C][/ROW]
[ROW][C]32[/C][C]1.58484521757456[/C][/ROW]
[ROW][C]33[/C][C]2.33123921767423[/C][/ROW]
[ROW][C]34[/C][C]5.24947708302319[/C][/ROW]
[ROW][C]35[/C][C]14.6213693852549[/C][/ROW]
[/TABLE]
Source: https://freestatistics.org/blog/index.php?pk=401&T=1

Globally Unique Identifier (entire table): ba.freestatistics.org/blog/index.php?pk=401&T=1

As an alternative you can also use a QR Code:  

The GUIDs for individual cells are displayed in the table below:

Summary of Dendrogram
LabelHeight
10
20
30
40
50
60
70
80
90.0999999999999996
100.0999999999999996
110.0999999999999996
120.0999999999999996
130.0999999999999996
140.0999999999999996
150.127614237491539
160.127614237491540
170.133333333333333
180.141421356237310
190.150000000000002
200.180473785412436
210.210018769324858
220.212132034355965
230.223606797749979
240.240000000000003
250.294113913183062
260.298689189856496
270.323381292038151
280.42437238127685
290.47566057345258
300.568192853324732
310.780064371755636
321.58484521757456
332.33123921767423
345.24947708302319
3514.6213693852549


Parameters (Session):
par1 = ward ; par2 = ALL ; par3 = FALSE ; par4 = FALSE ;
Parameters (R input):
par1 = ward ; par2 = ALL ; par3 = FALSE ; par4 = FALSE ;
R code (references can be found in the software module):
par3 <- as.logical(par3)
par4 <- as.logical(par4)
if (par3 == 'TRUE'){
dum = xlab
xlab = ylab
ylab = dum
}
x <- t(y)
hc <- hclust(dist(x),method=par1)
d <- as.dendrogram(hc)
str(d)
mysub <- paste('Method: ',par1)
bitmap(file='test1.png')
if (par4 == 'TRUE'){
plot(d,main=main,ylab=ylab,xlab=xlab,horiz=par3, nodePar=list(pch = c(1,NA), cex=0.8, lab.cex = 0.8),type='t',center=T, sub=mysub)
} else {
plot(d,main=main,ylab=ylab,xlab=xlab,horiz=par3, nodePar=list(pch = c(1,NA), cex=0.8, lab.cex = 0.8), sub=mysub)
}
dev.off()
if (par2 != 'ALL'){
if (par3 == 'TRUE'){
ylab = 'cluster'
} else {
xlab = 'cluster'
}
par2 <- as.numeric(par2)
memb <- cutree(hc, k = par2)
cent <- NULL
for(k in 1:par2){
cent <- rbind(cent, colMeans(x[memb == k, , drop = FALSE]))
}
hc1 <- hclust(dist(cent),method=par1, members = table(memb))
de <- as.dendrogram(hc1)
bitmap(file='test2.png')
if (par4 == 'TRUE'){
plot(de,main=main,ylab=ylab,xlab=xlab,horiz=par3, nodePar=list(pch = c(1,NA), cex=0.8, lab.cex = 0.8),type='t',center=T, sub=mysub)
} else {
plot(de,main=main,ylab=ylab,xlab=xlab,horiz=par3, nodePar=list(pch = c(1,NA), cex=0.8, lab.cex = 0.8), sub=mysub)
}
dev.off()
str(de)
}
load(file='createtable')
a<-table.start()
a<-table.row.start(a)
a<-table.element(a,'Summary of Dendrogram',2,TRUE)
a<-table.row.end(a)
a<-table.row.start(a)
a<-table.element(a,'Label',header=TRUE)
a<-table.element(a,'Height',header=TRUE)
a<-table.row.end(a)
num <- length(x[,1])-1
for (i in 1:num)
{
a<-table.row.start(a)
a<-table.element(a,hc$labels[i])
a<-table.element(a,hc$height[i])
a<-table.row.end(a)
}
a<-table.end(a)
table.save(a,file='mytable1.tab')
if (par2 != 'ALL'){
a<-table.start()
a<-table.row.start(a)
a<-table.element(a,'Summary of Cut Dendrogram',2,TRUE)
a<-table.row.end(a)
a<-table.row.start(a)
a<-table.element(a,'Label',header=TRUE)
a<-table.element(a,'Height',header=TRUE)
a<-table.row.end(a)
num <- par2-1
for (i in 1:num)
{
a<-table.row.start(a)
a<-table.element(a,i)
a<-table.element(a,hc1$height[i])
a<-table.row.end(a)
}
a<-table.end(a)
table.save(a,file='mytable2.tab')
}