Free Statistics

of Irreproducible Research!

Author's title

Author*Unverified author*
R Software Modulerwasp_hierarchicalclustering.wasp
Title produced by softwareHierarchical Clustering
Date of computationSun, 04 Nov 2007 03:18:23 -0700
Cite this page as followsStatistical Computations at FreeStatistics.org, Office for Research Development and Education, URL https://freestatistics.org/blog/index.php?v=date/2007/Nov/04/syxo8fw6ezlu2mp1194171386.htm/, Retrieved Sun, 05 May 2024 14:51:09 +0000
Statistical Computations at FreeStatistics.org, Office for Research Development and Education, URL https://freestatistics.org/blog/index.php?pk=356, Retrieved Sun, 05 May 2024 14:51:09 +0000
QR Codes:

Original text written by user:
IsPrivate?No (this computation is public)
User-defined keywordsws4, q2
Estimated Impact214
Family? (F = Feedback message, R = changed R code, M = changed R Module, P = changed Parameters, D = changed Data)
-     [Hierarchical Clustering] [ws 4 q2] [2007-11-03 10:51:30] [655b624ee9c65b36f9e3a3ae18e147e0]
-    D    [Hierarchical Clustering] [ws4] [2007-11-04 10:18:23] [e2f7a6e26aa7cf06a3d27eb5298a4843] [Current]
Feedback Forum

Post a new message
Dataseries X:
8.1	7.7	8.5
8.2	7.8	8.6
8	7.7	8.5
8.1	7.7	8.5
8.3	7.7	9
8.2	7.7	9
8.1	7.6	8.8
7.7	7.5	8
7.6	7.4	7.9
7.7	7.4	8.1
8.2	7.5	9.3
8.4	7.6	9.4
8.4	7.6	9.4
8.6	8.1	9.3
8.4	7.8	9
8.5	8	9.1
8.7	7.9	9.7
8.7	7.9	9.7
8.6	7.8	9.6
7.4	6.7	8.3
7.3	6.6	8.2
7.4	6.6	8.4
9	7.7	10.6
9.2	7.9	10.9
9.2	8	10.9
8.5	7.7	9.6
8.3	7.5	9.3
8.3	7.6	9.3
8.6	7.8	9.6
8.6	7.8	9.5
8.5	7.7	9.5
8.1	7.4	9
8.1	7.5	8.9
8	7.2	9
8.6	7.5	10.1
8.7	7.6	10.2
8.7	7.6	10.2
8.6	7.8	9.5
8.4	7.7	9.3
8.4	7.7	9.3
8.7	8.2	9.4
8.7	8.2	9.3
8.5	8.1	9.1
8.3	7.8	9
8.3	7.8	8.9
8.3	7.7	9
8.1	6.7	9.8
8.2	6.7	10
8.1	6.7	9.8
8.1	7.2	9.4
7.9	6.9	9
7.7	6.8	8.9
8.1	7.2	9.3
8	7.1	9.1
7.7	6.9	8.8
7.8	6.9	8.9
7.6	6.7	8.7
7.4	6.5	8.6
7.7	6.6	9.1
7.9	6.6	9.3
7.6	6.5	8.9


Summary of compuational transaction
Raw Inputview raw input (R code)
Raw Outputview raw output of R engine
Computing time2 seconds
R Server'Herman Ole Andreas Wold' @ 193.190.124.10:1001

\begin{tabular}{lllllllll}
\hline
Summary of compuational transaction \tabularnewline
Raw Input & view raw input (R code)  \tabularnewline
Raw Output & view raw output of R engine  \tabularnewline
Computing time & 2 seconds \tabularnewline
R Server & 'Herman Ole Andreas Wold' @ 193.190.124.10:1001 \tabularnewline
\hline
\end{tabular}
%Source: https://freestatistics.org/blog/index.php?pk=356&T=0

[TABLE]
[ROW][C]Summary of compuational transaction[/C][/ROW]
[ROW][C]Raw Input[/C][C]view raw input (R code) [/C][/ROW]
[ROW][C]Raw Output[/C][C]view raw output of R engine [/C][/ROW]
[ROW][C]Computing time[/C][C]2 seconds[/C][/ROW]
[ROW][C]R Server[/C][C]'Herman Ole Andreas Wold' @ 193.190.124.10:1001[/C][/ROW]
[/TABLE]
Source: https://freestatistics.org/blog/index.php?pk=356&T=0

Globally Unique Identifier (entire table): ba.freestatistics.org/blog/index.php?pk=356&T=0

As an alternative you can also use a QR Code:  

The GUIDs for individual cells are displayed in the table below:

Summary of compuational transaction
Raw Inputview raw input (R code)
Raw Outputview raw output of R engine
Computing time2 seconds
R Server'Herman Ole Andreas Wold' @ 193.190.124.10:1001


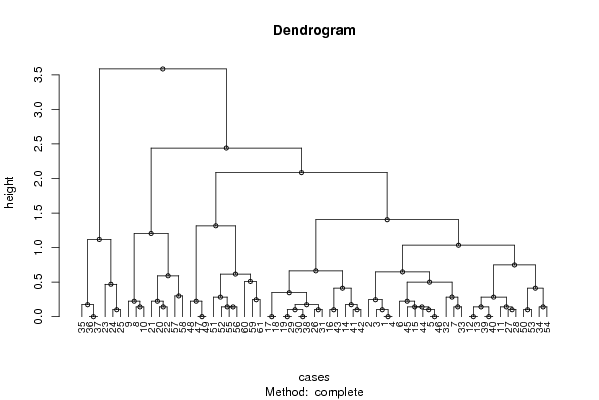
Summary of Dendrogram
LabelHeight
10
20
30
40
50
60
70
80
90
100.0999999999999996
110.0999999999999996
120.0999999999999996
130.0999999999999996
140.0999999999999996
150.0999999999999996
160.0999999999999996
170.0999999999999996
180.0999999999999996
190.141421356237309
200.141421356237309
210.141421356237309
220.141421356237309
230.141421356237309
240.141421356237310
250.141421356237310
260.141421356237310
270.141421356237310
280.141421356237310
290.173205080756887
300.173205080756887
310.173205080756887
320.223606797749978
330.223606797749979
340.223606797749980
350.22360679774998
360.244948974278317
370.244948974278317
380.282842712474618
390.282842712474619
400.28284271247462
410.300000000000000
420.346410161513775
430.412310562561766
440.412310562561766
450.469041575982343
460.5
470.509901951359279
480.591607978309962
490.616441400296898
500.648074069840786
510.663324958071079
520.748331477354789
531.03440804327886
541.11803398874990
551.20415945787923
561.31529464379659
571.40356688476182
582.08566536146142
592.44131112314674
603.58608421540822

\begin{tabular}{lllllllll}
\hline
Summary of Dendrogram \tabularnewline
Label & Height \tabularnewline
1 & 0 \tabularnewline
2 & 0 \tabularnewline
3 & 0 \tabularnewline
4 & 0 \tabularnewline
5 & 0 \tabularnewline
6 & 0 \tabularnewline
7 & 0 \tabularnewline
8 & 0 \tabularnewline
9 & 0 \tabularnewline
10 & 0.0999999999999996 \tabularnewline
11 & 0.0999999999999996 \tabularnewline
12 & 0.0999999999999996 \tabularnewline
13 & 0.0999999999999996 \tabularnewline
14 & 0.0999999999999996 \tabularnewline
15 & 0.0999999999999996 \tabularnewline
16 & 0.0999999999999996 \tabularnewline
17 & 0.0999999999999996 \tabularnewline
18 & 0.0999999999999996 \tabularnewline
19 & 0.141421356237309 \tabularnewline
20 & 0.141421356237309 \tabularnewline
21 & 0.141421356237309 \tabularnewline
22 & 0.141421356237309 \tabularnewline
23 & 0.141421356237309 \tabularnewline
24 & 0.141421356237310 \tabularnewline
25 & 0.141421356237310 \tabularnewline
26 & 0.141421356237310 \tabularnewline
27 & 0.141421356237310 \tabularnewline
28 & 0.141421356237310 \tabularnewline
29 & 0.173205080756887 \tabularnewline
30 & 0.173205080756887 \tabularnewline
31 & 0.173205080756887 \tabularnewline
32 & 0.223606797749978 \tabularnewline
33 & 0.223606797749979 \tabularnewline
34 & 0.223606797749980 \tabularnewline
35 & 0.22360679774998 \tabularnewline
36 & 0.244948974278317 \tabularnewline
37 & 0.244948974278317 \tabularnewline
38 & 0.282842712474618 \tabularnewline
39 & 0.282842712474619 \tabularnewline
40 & 0.28284271247462 \tabularnewline
41 & 0.300000000000000 \tabularnewline
42 & 0.346410161513775 \tabularnewline
43 & 0.412310562561766 \tabularnewline
44 & 0.412310562561766 \tabularnewline
45 & 0.469041575982343 \tabularnewline
46 & 0.5 \tabularnewline
47 & 0.509901951359279 \tabularnewline
48 & 0.591607978309962 \tabularnewline
49 & 0.616441400296898 \tabularnewline
50 & 0.648074069840786 \tabularnewline
51 & 0.663324958071079 \tabularnewline
52 & 0.748331477354789 \tabularnewline
53 & 1.03440804327886 \tabularnewline
54 & 1.11803398874990 \tabularnewline
55 & 1.20415945787923 \tabularnewline
56 & 1.31529464379659 \tabularnewline
57 & 1.40356688476182 \tabularnewline
58 & 2.08566536146142 \tabularnewline
59 & 2.44131112314674 \tabularnewline
60 & 3.58608421540822 \tabularnewline
\hline
\end{tabular}
%Source: https://freestatistics.org/blog/index.php?pk=356&T=1

[TABLE]
[ROW][C]Summary of Dendrogram[/C][/ROW]
[ROW][C]Label[/C][C]Height[/C][/ROW]
[ROW][C]1[/C][C]0[/C][/ROW]
[ROW][C]2[/C][C]0[/C][/ROW]
[ROW][C]3[/C][C]0[/C][/ROW]
[ROW][C]4[/C][C]0[/C][/ROW]
[ROW][C]5[/C][C]0[/C][/ROW]
[ROW][C]6[/C][C]0[/C][/ROW]
[ROW][C]7[/C][C]0[/C][/ROW]
[ROW][C]8[/C][C]0[/C][/ROW]
[ROW][C]9[/C][C]0[/C][/ROW]
[ROW][C]10[/C][C]0.0999999999999996[/C][/ROW]
[ROW][C]11[/C][C]0.0999999999999996[/C][/ROW]
[ROW][C]12[/C][C]0.0999999999999996[/C][/ROW]
[ROW][C]13[/C][C]0.0999999999999996[/C][/ROW]
[ROW][C]14[/C][C]0.0999999999999996[/C][/ROW]
[ROW][C]15[/C][C]0.0999999999999996[/C][/ROW]
[ROW][C]16[/C][C]0.0999999999999996[/C][/ROW]
[ROW][C]17[/C][C]0.0999999999999996[/C][/ROW]
[ROW][C]18[/C][C]0.0999999999999996[/C][/ROW]
[ROW][C]19[/C][C]0.141421356237309[/C][/ROW]
[ROW][C]20[/C][C]0.141421356237309[/C][/ROW]
[ROW][C]21[/C][C]0.141421356237309[/C][/ROW]
[ROW][C]22[/C][C]0.141421356237309[/C][/ROW]
[ROW][C]23[/C][C]0.141421356237309[/C][/ROW]
[ROW][C]24[/C][C]0.141421356237310[/C][/ROW]
[ROW][C]25[/C][C]0.141421356237310[/C][/ROW]
[ROW][C]26[/C][C]0.141421356237310[/C][/ROW]
[ROW][C]27[/C][C]0.141421356237310[/C][/ROW]
[ROW][C]28[/C][C]0.141421356237310[/C][/ROW]
[ROW][C]29[/C][C]0.173205080756887[/C][/ROW]
[ROW][C]30[/C][C]0.173205080756887[/C][/ROW]
[ROW][C]31[/C][C]0.173205080756887[/C][/ROW]
[ROW][C]32[/C][C]0.223606797749978[/C][/ROW]
[ROW][C]33[/C][C]0.223606797749979[/C][/ROW]
[ROW][C]34[/C][C]0.223606797749980[/C][/ROW]
[ROW][C]35[/C][C]0.22360679774998[/C][/ROW]
[ROW][C]36[/C][C]0.244948974278317[/C][/ROW]
[ROW][C]37[/C][C]0.244948974278317[/C][/ROW]
[ROW][C]38[/C][C]0.282842712474618[/C][/ROW]
[ROW][C]39[/C][C]0.282842712474619[/C][/ROW]
[ROW][C]40[/C][C]0.28284271247462[/C][/ROW]
[ROW][C]41[/C][C]0.300000000000000[/C][/ROW]
[ROW][C]42[/C][C]0.346410161513775[/C][/ROW]
[ROW][C]43[/C][C]0.412310562561766[/C][/ROW]
[ROW][C]44[/C][C]0.412310562561766[/C][/ROW]
[ROW][C]45[/C][C]0.469041575982343[/C][/ROW]
[ROW][C]46[/C][C]0.5[/C][/ROW]
[ROW][C]47[/C][C]0.509901951359279[/C][/ROW]
[ROW][C]48[/C][C]0.591607978309962[/C][/ROW]
[ROW][C]49[/C][C]0.616441400296898[/C][/ROW]
[ROW][C]50[/C][C]0.648074069840786[/C][/ROW]
[ROW][C]51[/C][C]0.663324958071079[/C][/ROW]
[ROW][C]52[/C][C]0.748331477354789[/C][/ROW]
[ROW][C]53[/C][C]1.03440804327886[/C][/ROW]
[ROW][C]54[/C][C]1.11803398874990[/C][/ROW]
[ROW][C]55[/C][C]1.20415945787923[/C][/ROW]
[ROW][C]56[/C][C]1.31529464379659[/C][/ROW]
[ROW][C]57[/C][C]1.40356688476182[/C][/ROW]
[ROW][C]58[/C][C]2.08566536146142[/C][/ROW]
[ROW][C]59[/C][C]2.44131112314674[/C][/ROW]
[ROW][C]60[/C][C]3.58608421540822[/C][/ROW]
[/TABLE]
Source: https://freestatistics.org/blog/index.php?pk=356&T=1

Globally Unique Identifier (entire table): ba.freestatistics.org/blog/index.php?pk=356&T=1

As an alternative you can also use a QR Code:  

The GUIDs for individual cells are displayed in the table below:

Summary of Dendrogram
LabelHeight
10
20
30
40
50
60
70
80
90
100.0999999999999996
110.0999999999999996
120.0999999999999996
130.0999999999999996
140.0999999999999996
150.0999999999999996
160.0999999999999996
170.0999999999999996
180.0999999999999996
190.141421356237309
200.141421356237309
210.141421356237309
220.141421356237309
230.141421356237309
240.141421356237310
250.141421356237310
260.141421356237310
270.141421356237310
280.141421356237310
290.173205080756887
300.173205080756887
310.173205080756887
320.223606797749978
330.223606797749979
340.223606797749980
350.22360679774998
360.244948974278317
370.244948974278317
380.282842712474618
390.282842712474619
400.28284271247462
410.300000000000000
420.346410161513775
430.412310562561766
440.412310562561766
450.469041575982343
460.5
470.509901951359279
480.591607978309962
490.616441400296898
500.648074069840786
510.663324958071079
520.748331477354789
531.03440804327886
541.11803398874990
551.20415945787923
561.31529464379659
571.40356688476182
582.08566536146142
592.44131112314674
603.58608421540822


Parameters (Session):
par1 = complete ; par2 = ALL ; par3 = FALSE ; par4 = FALSE ;
Parameters (R input):
par1 = complete ; par2 = ALL ; par3 = FALSE ; par4 = FALSE ;
R code (references can be found in the software module):
par3 <- as.logical(par3)
par4 <- as.logical(par4)
if (par3 == 'TRUE'){
dum = xlab
xlab = ylab
ylab = dum
}
x <- t(y)
hc <- hclust(dist(x),method=par1)
d <- as.dendrogram(hc)
str(d)
mysub <- paste('Method: ',par1)
bitmap(file='test1.png')
if (par4 == 'TRUE'){
plot(d,main=main,ylab=ylab,xlab=xlab,horiz=par3, nodePar=list(pch = c(1,NA), cex=0.8, lab.cex = 0.8),type='t',center=T, sub=mysub)
} else {
plot(d,main=main,ylab=ylab,xlab=xlab,horiz=par3, nodePar=list(pch = c(1,NA), cex=0.8, lab.cex = 0.8), sub=mysub)
}
dev.off()
if (par2 != 'ALL'){
if (par3 == 'TRUE'){
ylab = 'cluster'
} else {
xlab = 'cluster'
}
par2 <- as.numeric(par2)
memb <- cutree(hc, k = par2)
cent <- NULL
for(k in 1:par2){
cent <- rbind(cent, colMeans(x[memb == k, , drop = FALSE]))
}
hc1 <- hclust(dist(cent),method=par1, members = table(memb))
de <- as.dendrogram(hc1)
bitmap(file='test2.png')
if (par4 == 'TRUE'){
plot(de,main=main,ylab=ylab,xlab=xlab,horiz=par3, nodePar=list(pch = c(1,NA), cex=0.8, lab.cex = 0.8),type='t',center=T, sub=mysub)
} else {
plot(de,main=main,ylab=ylab,xlab=xlab,horiz=par3, nodePar=list(pch = c(1,NA), cex=0.8, lab.cex = 0.8), sub=mysub)
}
dev.off()
str(de)
}
load(file='createtable')
a<-table.start()
a<-table.row.start(a)
a<-table.element(a,'Summary of Dendrogram',2,TRUE)
a<-table.row.end(a)
a<-table.row.start(a)
a<-table.element(a,'Label',header=TRUE)
a<-table.element(a,'Height',header=TRUE)
a<-table.row.end(a)
num <- length(x[,1])-1
for (i in 1:num)
{
a<-table.row.start(a)
a<-table.element(a,hc$labels[i])
a<-table.element(a,hc$height[i])
a<-table.row.end(a)
}
a<-table.end(a)
table.save(a,file='mytable1.tab')
if (par2 != 'ALL'){
a<-table.start()
a<-table.row.start(a)
a<-table.element(a,'Summary of Cut Dendrogram',2,TRUE)
a<-table.row.end(a)
a<-table.row.start(a)
a<-table.element(a,'Label',header=TRUE)
a<-table.element(a,'Height',header=TRUE)
a<-table.row.end(a)
num <- par2-1
for (i in 1:num)
{
a<-table.row.start(a)
a<-table.element(a,i)
a<-table.element(a,hc1$height[i])
a<-table.row.end(a)
}
a<-table.end(a)
table.save(a,file='mytable2.tab')
}