Free Statistics

of Irreproducible Research!

Author's title

Author*Unverified author*
R Software Modulerwasp_hierarchicalclustering.wasp
Title produced by softwareHierarchical Clustering
Date of computationFri, 02 Nov 2007 09:32:48 -0700
Cite this page as followsStatistical Computations at FreeStatistics.org, Office for Research Development and Education, URL https://freestatistics.org/blog/index.php?v=date/2007/Nov/02/ux05xqhwb14uqdr1194021262.htm/, Retrieved Sat, 04 May 2024 03:22:04 +0000
Statistical Computations at FreeStatistics.org, Office for Research Development and Education, URL https://freestatistics.org/blog/index.php?pk=161, Retrieved Sat, 04 May 2024 03:22:04 +0000
QR Codes:

Original text written by user:
IsPrivate?No (this computation is public)
User-defined keywordsBasiscijfers, kleding, industrie
Estimated Impact222
Family? (F = Feedback message, R = changed R code, M = changed R Module, P = changed Parameters, D = changed Data)
-       [Hierarchical Clustering] [Hierarchical Clus...] [2007-11-02 16:32:48] [5ac545ffb613273067e3916533dda4e8] [Current]
Feedback Forum

Post a new message
Dataseries X:
110.40	109.20	99.90	72.50
96.40	88.60	99.80	59.40
101.90	94.30	99.80	85.70
106.20	98.30	100.30	88.20
81.00	86.40	99.90	62.80
94.70	80.60	99.90	87.00
101.00	104.10	100.00	79.20
109.40	108.20	100.10	112.00
102.30	93.40	100.10	79.20
90.70	71.90	100.20	132.10
96.20	94.10	100.30	40.10
96.10	94.90	100.60	69.00
106.00	96.40	100.00	59.40
103.10	91.10	100.10	73.80
102.00	84.40	100.20	57.40
104.70	86.40	100.00	81.10
86.00	88.00	100.10	46.60
92.10	75.10	100.10	41.40
106.90	109.70	100.10	71.20
112.60	103.00	100.50	67.90
101.70	82.10	100.50	72.00
92.00	68.00	100.50	145.50
97.40	96.40	96.30	39.70
97.00	94.30	96.30	51.90
105.40	90.00	96.80	73.70
102.70	88.00	96.80	70.90
98.10	76.10	96.90	60.80
104.50	82.50	96.80	61.00
87.40	81.40	96.80	54.50
89.90	66.50	96.80	39.10
109.80	97.20	96.80	66.60
111.70	94.10	97.00	58.50
98.60	80.70	97.00	59.80
96.90	70.50	97.00	80.90
95.10	87.80	96.80	37.30
97.00	89.50	96.90	44.60
112.70	99.60	97.20	48.70
102.90	84.20	97.30	54.00
97.40	75.10	97.30	49.50
111.40	92.00	97.20	61.60
87.40	80.80	97.30	35.00
96.80	73.10	97.30	35.70
114.10	99.80	97.30	51.30
110.30	90.00	97.30	49.00
103.90	83.10	97.30	41.50
101.60	72.40	97.30	72.50
94.60	78.80	98.10	42.10
95.90	87.30	96.80	44.10
104.70	91.00	96.80	45.10
102.80	80.10	96.80	50.30
98.10	73.60	96.80	40.90
113.90	86.40	96.80	47.20
80.90	74.50	96.80	36.90
95.70	71.20	96.80	40.90
113.20	92.40	96.80	38.30
105.90	81.50	96.80	46.30
108.80	85.30	96.80	28.40
102.30	69.90	96.80	78.40
99.00	84.20	96.90	36.80
100.70	90.70	97.10	50.70
115.50	100.30	97.10	42.80


Summary of compuational transaction
Raw Inputview raw input (R code)
Raw Outputview raw output of R engine
Computing time2 seconds
R Server'Gwilym Jenkins' @ 72.249.127.135

\begin{tabular}{lllllllll}
\hline
Summary of compuational transaction \tabularnewline
Raw Input & view raw input (R code)  \tabularnewline
Raw Output & view raw output of R engine  \tabularnewline
Computing time & 2 seconds \tabularnewline
R Server & 'Gwilym Jenkins' @ 72.249.127.135 \tabularnewline
\hline
\end{tabular}
%Source: https://freestatistics.org/blog/index.php?pk=161&T=0

[TABLE]
[ROW][C]Summary of compuational transaction[/C][/ROW]
[ROW][C]Raw Input[/C][C]view raw input (R code) [/C][/ROW]
[ROW][C]Raw Output[/C][C]view raw output of R engine [/C][/ROW]
[ROW][C]Computing time[/C][C]2 seconds[/C][/ROW]
[ROW][C]R Server[/C][C]'Gwilym Jenkins' @ 72.249.127.135[/C][/ROW]
[/TABLE]
Source: https://freestatistics.org/blog/index.php?pk=161&T=0

Globally Unique Identifier (entire table): ba.freestatistics.org/blog/index.php?pk=161&T=0

As an alternative you can also use a QR Code:  

The GUIDs for individual cells are displayed in the table below:

Summary of compuational transaction
Raw Inputview raw input (R code)
Raw Outputview raw output of R engine
Computing time2 seconds
R Server'Gwilym Jenkins' @ 72.249.127.135


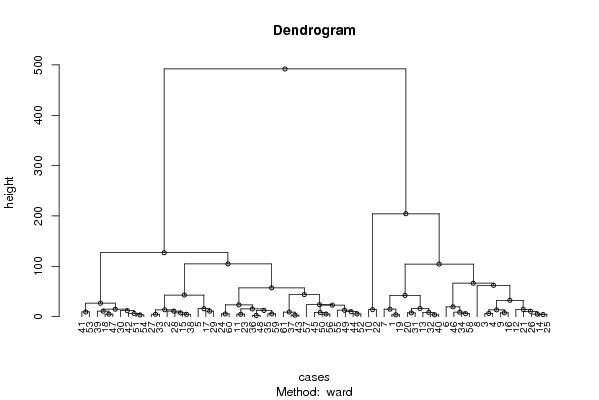
Summary of Dendrogram
LabelHeight
12.51197133741609
22.96141857899216
33.39411254969542
43.76164857476080
53.772267222772
64.17133072292284
74.56289381861994
84.73497624070069
94.78434948556228
104.94267134250296
115.11985360729854
125.25071423713004
135.33197899470731
145.36003731330296
155.4230987451825
165.98414572015086
176.25065996541364
186.40234332100365
197.31862934082526
207.54055700860354
217.64068059795723
228.14243881330763
238.56051278084377
248.85934844935958
259.14632994752397
269.26282894152753
279.80116422703554
2810.6977783089397
2910.9004587059444
3010.9175633333175
3110.9475302735850
3211.9998557297210
3312.4550566032831
3412.7365437294496
3513.5042881778377
3613.7105442514842
3714.0196290963777
3814.4740197839994
3914.7528628152703
4014.7624888662622
4115.2801814647016
4215.7329885315009
4316.2638446536299
4419.5687631206085
4522.8315762376692
4623.4330811510197
4723.9161328160879
4826.6779054441941
4932.4786719273815
5042.2863700223221
5142.9484552536474
5243.9733326835754
5357.1486548087513
5462.1916088871956
5566.4865062075421
56104.465512061466
57104.840902584218
58127.098967718465
59204.433638158449
60492.13317238656

\begin{tabular}{lllllllll}
\hline
Summary of Dendrogram \tabularnewline
Label & Height \tabularnewline
1 & 2.51197133741609 \tabularnewline
2 & 2.96141857899216 \tabularnewline
3 & 3.39411254969542 \tabularnewline
4 & 3.76164857476080 \tabularnewline
5 & 3.772267222772 \tabularnewline
6 & 4.17133072292284 \tabularnewline
7 & 4.56289381861994 \tabularnewline
8 & 4.73497624070069 \tabularnewline
9 & 4.78434948556228 \tabularnewline
10 & 4.94267134250296 \tabularnewline
11 & 5.11985360729854 \tabularnewline
12 & 5.25071423713004 \tabularnewline
13 & 5.33197899470731 \tabularnewline
14 & 5.36003731330296 \tabularnewline
15 & 5.4230987451825 \tabularnewline
16 & 5.98414572015086 \tabularnewline
17 & 6.25065996541364 \tabularnewline
18 & 6.40234332100365 \tabularnewline
19 & 7.31862934082526 \tabularnewline
20 & 7.54055700860354 \tabularnewline
21 & 7.64068059795723 \tabularnewline
22 & 8.14243881330763 \tabularnewline
23 & 8.56051278084377 \tabularnewline
24 & 8.85934844935958 \tabularnewline
25 & 9.14632994752397 \tabularnewline
26 & 9.26282894152753 \tabularnewline
27 & 9.80116422703554 \tabularnewline
28 & 10.6977783089397 \tabularnewline
29 & 10.9004587059444 \tabularnewline
30 & 10.9175633333175 \tabularnewline
31 & 10.9475302735850 \tabularnewline
32 & 11.9998557297210 \tabularnewline
33 & 12.4550566032831 \tabularnewline
34 & 12.7365437294496 \tabularnewline
35 & 13.5042881778377 \tabularnewline
36 & 13.7105442514842 \tabularnewline
37 & 14.0196290963777 \tabularnewline
38 & 14.4740197839994 \tabularnewline
39 & 14.7528628152703 \tabularnewline
40 & 14.7624888662622 \tabularnewline
41 & 15.2801814647016 \tabularnewline
42 & 15.7329885315009 \tabularnewline
43 & 16.2638446536299 \tabularnewline
44 & 19.5687631206085 \tabularnewline
45 & 22.8315762376692 \tabularnewline
46 & 23.4330811510197 \tabularnewline
47 & 23.9161328160879 \tabularnewline
48 & 26.6779054441941 \tabularnewline
49 & 32.4786719273815 \tabularnewline
50 & 42.2863700223221 \tabularnewline
51 & 42.9484552536474 \tabularnewline
52 & 43.9733326835754 \tabularnewline
53 & 57.1486548087513 \tabularnewline
54 & 62.1916088871956 \tabularnewline
55 & 66.4865062075421 \tabularnewline
56 & 104.465512061466 \tabularnewline
57 & 104.840902584218 \tabularnewline
58 & 127.098967718465 \tabularnewline
59 & 204.433638158449 \tabularnewline
60 & 492.13317238656 \tabularnewline
\hline
\end{tabular}
%Source: https://freestatistics.org/blog/index.php?pk=161&T=1

[TABLE]
[ROW][C]Summary of Dendrogram[/C][/ROW]
[ROW][C]Label[/C][C]Height[/C][/ROW]
[ROW][C]1[/C][C]2.51197133741609[/C][/ROW]
[ROW][C]2[/C][C]2.96141857899216[/C][/ROW]
[ROW][C]3[/C][C]3.39411254969542[/C][/ROW]
[ROW][C]4[/C][C]3.76164857476080[/C][/ROW]
[ROW][C]5[/C][C]3.772267222772[/C][/ROW]
[ROW][C]6[/C][C]4.17133072292284[/C][/ROW]
[ROW][C]7[/C][C]4.56289381861994[/C][/ROW]
[ROW][C]8[/C][C]4.73497624070069[/C][/ROW]
[ROW][C]9[/C][C]4.78434948556228[/C][/ROW]
[ROW][C]10[/C][C]4.94267134250296[/C][/ROW]
[ROW][C]11[/C][C]5.11985360729854[/C][/ROW]
[ROW][C]12[/C][C]5.25071423713004[/C][/ROW]
[ROW][C]13[/C][C]5.33197899470731[/C][/ROW]
[ROW][C]14[/C][C]5.36003731330296[/C][/ROW]
[ROW][C]15[/C][C]5.4230987451825[/C][/ROW]
[ROW][C]16[/C][C]5.98414572015086[/C][/ROW]
[ROW][C]17[/C][C]6.25065996541364[/C][/ROW]
[ROW][C]18[/C][C]6.40234332100365[/C][/ROW]
[ROW][C]19[/C][C]7.31862934082526[/C][/ROW]
[ROW][C]20[/C][C]7.54055700860354[/C][/ROW]
[ROW][C]21[/C][C]7.64068059795723[/C][/ROW]
[ROW][C]22[/C][C]8.14243881330763[/C][/ROW]
[ROW][C]23[/C][C]8.56051278084377[/C][/ROW]
[ROW][C]24[/C][C]8.85934844935958[/C][/ROW]
[ROW][C]25[/C][C]9.14632994752397[/C][/ROW]
[ROW][C]26[/C][C]9.26282894152753[/C][/ROW]
[ROW][C]27[/C][C]9.80116422703554[/C][/ROW]
[ROW][C]28[/C][C]10.6977783089397[/C][/ROW]
[ROW][C]29[/C][C]10.9004587059444[/C][/ROW]
[ROW][C]30[/C][C]10.9175633333175[/C][/ROW]
[ROW][C]31[/C][C]10.9475302735850[/C][/ROW]
[ROW][C]32[/C][C]11.9998557297210[/C][/ROW]
[ROW][C]33[/C][C]12.4550566032831[/C][/ROW]
[ROW][C]34[/C][C]12.7365437294496[/C][/ROW]
[ROW][C]35[/C][C]13.5042881778377[/C][/ROW]
[ROW][C]36[/C][C]13.7105442514842[/C][/ROW]
[ROW][C]37[/C][C]14.0196290963777[/C][/ROW]
[ROW][C]38[/C][C]14.4740197839994[/C][/ROW]
[ROW][C]39[/C][C]14.7528628152703[/C][/ROW]
[ROW][C]40[/C][C]14.7624888662622[/C][/ROW]
[ROW][C]41[/C][C]15.2801814647016[/C][/ROW]
[ROW][C]42[/C][C]15.7329885315009[/C][/ROW]
[ROW][C]43[/C][C]16.2638446536299[/C][/ROW]
[ROW][C]44[/C][C]19.5687631206085[/C][/ROW]
[ROW][C]45[/C][C]22.8315762376692[/C][/ROW]
[ROW][C]46[/C][C]23.4330811510197[/C][/ROW]
[ROW][C]47[/C][C]23.9161328160879[/C][/ROW]
[ROW][C]48[/C][C]26.6779054441941[/C][/ROW]
[ROW][C]49[/C][C]32.4786719273815[/C][/ROW]
[ROW][C]50[/C][C]42.2863700223221[/C][/ROW]
[ROW][C]51[/C][C]42.9484552536474[/C][/ROW]
[ROW][C]52[/C][C]43.9733326835754[/C][/ROW]
[ROW][C]53[/C][C]57.1486548087513[/C][/ROW]
[ROW][C]54[/C][C]62.1916088871956[/C][/ROW]
[ROW][C]55[/C][C]66.4865062075421[/C][/ROW]
[ROW][C]56[/C][C]104.465512061466[/C][/ROW]
[ROW][C]57[/C][C]104.840902584218[/C][/ROW]
[ROW][C]58[/C][C]127.098967718465[/C][/ROW]
[ROW][C]59[/C][C]204.433638158449[/C][/ROW]
[ROW][C]60[/C][C]492.13317238656[/C][/ROW]
[/TABLE]
Source: https://freestatistics.org/blog/index.php?pk=161&T=1

Globally Unique Identifier (entire table): ba.freestatistics.org/blog/index.php?pk=161&T=1

As an alternative you can also use a QR Code:  

The GUIDs for individual cells are displayed in the table below:

Summary of Dendrogram
LabelHeight
12.51197133741609
22.96141857899216
33.39411254969542
43.76164857476080
53.772267222772
64.17133072292284
74.56289381861994
84.73497624070069
94.78434948556228
104.94267134250296
115.11985360729854
125.25071423713004
135.33197899470731
145.36003731330296
155.4230987451825
165.98414572015086
176.25065996541364
186.40234332100365
197.31862934082526
207.54055700860354
217.64068059795723
228.14243881330763
238.56051278084377
248.85934844935958
259.14632994752397
269.26282894152753
279.80116422703554
2810.6977783089397
2910.9004587059444
3010.9175633333175
3110.9475302735850
3211.9998557297210
3312.4550566032831
3412.7365437294496
3513.5042881778377
3613.7105442514842
3714.0196290963777
3814.4740197839994
3914.7528628152703
4014.7624888662622
4115.2801814647016
4215.7329885315009
4316.2638446536299
4419.5687631206085
4522.8315762376692
4623.4330811510197
4723.9161328160879
4826.6779054441941
4932.4786719273815
5042.2863700223221
5142.9484552536474
5243.9733326835754
5357.1486548087513
5462.1916088871956
5566.4865062075421
56104.465512061466
57104.840902584218
58127.098967718465
59204.433638158449
60492.13317238656


Parameters (Session):
par1 = ward ; par2 = ALL ; par3 = FALSE ; par4 = FALSE ;
Parameters (R input):
par1 = ward ; par2 = ALL ; par3 = FALSE ; par4 = FALSE ;
R code (references can be found in the software module):
par3 <- as.logical(par3)
par4 <- as.logical(par4)
if (par3 == 'TRUE'){
dum = xlab
xlab = ylab
ylab = dum
}
x <- t(y)
hc <- hclust(dist(x),method=par1)
d <- as.dendrogram(hc)
str(d)
mysub <- paste('Method: ',par1)
bitmap(file='test1.png')
if (par4 == 'TRUE'){
plot(d,main=main,ylab=ylab,xlab=xlab,horiz=par3, nodePar=list(pch = c(1,NA), cex=0.8, lab.cex = 0.8),type='t',center=T, sub=mysub)
} else {
plot(d,main=main,ylab=ylab,xlab=xlab,horiz=par3, nodePar=list(pch = c(1,NA), cex=0.8, lab.cex = 0.8), sub=mysub)
}
dev.off()
if (par2 != 'ALL'){
if (par3 == 'TRUE'){
ylab = 'cluster'
} else {
xlab = 'cluster'
}
par2 <- as.numeric(par2)
memb <- cutree(hc, k = par2)
cent <- NULL
for(k in 1:par2){
cent <- rbind(cent, colMeans(x[memb == k, , drop = FALSE]))
}
hc1 <- hclust(dist(cent),method=par1, members = table(memb))
de <- as.dendrogram(hc1)
bitmap(file='test2.png')
if (par4 == 'TRUE'){
plot(de,main=main,ylab=ylab,xlab=xlab,horiz=par3, nodePar=list(pch = c(1,NA), cex=0.8, lab.cex = 0.8),type='t',center=T, sub=mysub)
} else {
plot(de,main=main,ylab=ylab,xlab=xlab,horiz=par3, nodePar=list(pch = c(1,NA), cex=0.8, lab.cex = 0.8), sub=mysub)
}
dev.off()
str(de)
}
load(file='createtable')
a<-table.start()
a<-table.row.start(a)
a<-table.element(a,'Summary of Dendrogram',2,TRUE)
a<-table.row.end(a)
a<-table.row.start(a)
a<-table.element(a,'Label',header=TRUE)
a<-table.element(a,'Height',header=TRUE)
a<-table.row.end(a)
num <- length(x[,1])-1
for (i in 1:num)
{
a<-table.row.start(a)
a<-table.element(a,hc$labels[i])
a<-table.element(a,hc$height[i])
a<-table.row.end(a)
}
a<-table.end(a)
table.save(a,file='mytable1.tab')
if (par2 != 'ALL'){
a<-table.start()
a<-table.row.start(a)
a<-table.element(a,'Summary of Cut Dendrogram',2,TRUE)
a<-table.row.end(a)
a<-table.row.start(a)
a<-table.element(a,'Label',header=TRUE)
a<-table.element(a,'Height',header=TRUE)
a<-table.row.end(a)
num <- par2-1
for (i in 1:num)
{
a<-table.row.start(a)
a<-table.element(a,i)
a<-table.element(a,hc1$height[i])
a<-table.row.end(a)
}
a<-table.end(a)
table.save(a,file='mytable2.tab')
}