Free Statistics

of Irreproducible Research!

Author's title

Author*Unverified author*
R Software Modulerwasp_hierarchicalclustering.wasp
Title produced by softwareHierarchical Clustering
Date of computationFri, 02 Nov 2007 07:28:14 -0700
Cite this page as followsStatistical Computations at FreeStatistics.org, Office for Research Development and Education, URL https://freestatistics.org/blog/index.php?v=date/2007/Nov/02/ipe6ik61nqun7271194014434.htm/, Retrieved Sat, 04 May 2024 03:37:16 +0000
Statistical Computations at FreeStatistics.org, Office for Research Development and Education, URL https://freestatistics.org/blog/index.php?pk=148, Retrieved Sat, 04 May 2024 03:37:16 +0000
QR Codes:

Original text written by user:
IsPrivate?No (this computation is public)
User-defined keywords
Estimated Impact246
Family? (F = Feedback message, R = changed R code, M = changed R Module, P = changed Parameters, D = changed Data)
-       [Hierarchical Clustering] [] [2007-11-02 14:28:14] [948aab6162fad072630c47f720026bf3] [Current]
Feedback Forum

Post a new message
Dataseries X:
97.2	99.5	77.2
102.5	107.9	79.4
113.4	124.6	90.4
109.8	115	81.4
104.9	110.3	85.8
126.1	132.7	103.6
80	99.7	73.6
96.8	96.5	75.7
117.2	118.7	99.2
112.3	112.9	88.7
117.3	130.5	94.6
111.1	137.9	98.7
102.2	115	84.2
104.3	116.8	87.7
122.9	140.9	103.3
107.6	120.7	88.2
121.3	134.2	93.4
131.5	147.3	106.3
89	112.4	73.1
104.4	107.1	78.6
128.9	128.4	101.6
135.9	137.7	101.4
133.3	135	98.5
121.3	151	99
120.5	137.4	89.5
120.4	132.4	83.5
137.9	161.3	97.4
126.1	139.8	87.8
133.2	146	90.4
146.6	154.6	97.1
103.4	142.1	79.4
117.2	120.5	85


Summary of compuational transaction
Raw Inputview raw input (R code)
Raw Outputview raw output of R engine
Computing time2 seconds
R Server'Herman Ole Andreas Wold' @ 193.190.124.10:1001

\begin{tabular}{lllllllll}
\hline
Summary of compuational transaction \tabularnewline
Raw Input & view raw input (R code)  \tabularnewline
Raw Output & view raw output of R engine  \tabularnewline
Computing time & 2 seconds \tabularnewline
R Server & 'Herman Ole Andreas Wold' @ 193.190.124.10:1001 \tabularnewline
\hline
\end{tabular}
%Source: https://freestatistics.org/blog/index.php?pk=148&T=0

[TABLE]
[ROW][C]Summary of compuational transaction[/C][/ROW]
[ROW][C]Raw Input[/C][C]view raw input (R code) [/C][/ROW]
[ROW][C]Raw Output[/C][C]view raw output of R engine [/C][/ROW]
[ROW][C]Computing time[/C][C]2 seconds[/C][/ROW]
[ROW][C]R Server[/C][C]'Herman Ole Andreas Wold' @ 193.190.124.10:1001[/C][/ROW]
[/TABLE]
Source: https://freestatistics.org/blog/index.php?pk=148&T=0

Globally Unique Identifier (entire table): ba.freestatistics.org/blog/index.php?pk=148&T=0

As an alternative you can also use a QR Code:  

The GUIDs for individual cells are displayed in the table below:

Summary of compuational transaction
Raw Inputview raw input (R code)
Raw Outputview raw output of R engine
Computing time2 seconds
R Server'Herman Ole Andreas Wold' @ 193.190.124.10:1001


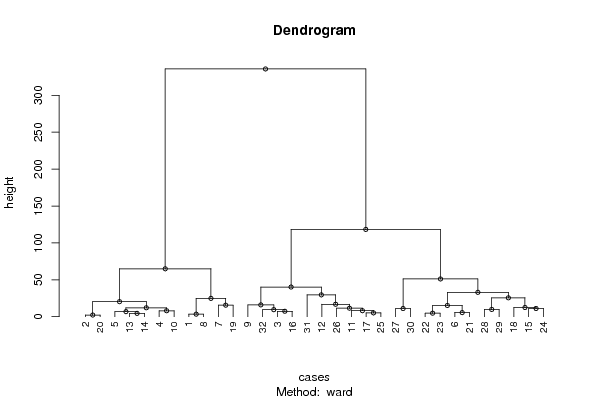
Summary of Dendrogram
LabelHeight
12.21133443874961
23.37786915081091
34.46094160463909
44.73919824442911
55.10783711564887
65.50726792520574
76.81307127384786
87.32734604068895
97.9968743894099
108.12201234317024
119.48665249565916
129.7780366127357
1310.9849897587572
1411.0932411855147
1511.4893826934431
1612.0194083564491
1712.4418513164528
1815.1247316299383
1915.5736957720382
2015.9493227279739
2116.8063405942193
2220.359084918004
2324.7893517956673
2425.4898075869372
2529.5135530284135
2632.9792526066896
2740.125169193723
2851.1128890074464
2964.8543117602986
30118.261133165849
31335.784448231553

\begin{tabular}{lllllllll}
\hline
Summary of Dendrogram \tabularnewline
Label & Height \tabularnewline
1 & 2.21133443874961 \tabularnewline
2 & 3.37786915081091 \tabularnewline
3 & 4.46094160463909 \tabularnewline
4 & 4.73919824442911 \tabularnewline
5 & 5.10783711564887 \tabularnewline
6 & 5.50726792520574 \tabularnewline
7 & 6.81307127384786 \tabularnewline
8 & 7.32734604068895 \tabularnewline
9 & 7.9968743894099 \tabularnewline
10 & 8.12201234317024 \tabularnewline
11 & 9.48665249565916 \tabularnewline
12 & 9.7780366127357 \tabularnewline
13 & 10.9849897587572 \tabularnewline
14 & 11.0932411855147 \tabularnewline
15 & 11.4893826934431 \tabularnewline
16 & 12.0194083564491 \tabularnewline
17 & 12.4418513164528 \tabularnewline
18 & 15.1247316299383 \tabularnewline
19 & 15.5736957720382 \tabularnewline
20 & 15.9493227279739 \tabularnewline
21 & 16.8063405942193 \tabularnewline
22 & 20.359084918004 \tabularnewline
23 & 24.7893517956673 \tabularnewline
24 & 25.4898075869372 \tabularnewline
25 & 29.5135530284135 \tabularnewline
26 & 32.9792526066896 \tabularnewline
27 & 40.125169193723 \tabularnewline
28 & 51.1128890074464 \tabularnewline
29 & 64.8543117602986 \tabularnewline
30 & 118.261133165849 \tabularnewline
31 & 335.784448231553 \tabularnewline
\hline
\end{tabular}
%Source: https://freestatistics.org/blog/index.php?pk=148&T=1

[TABLE]
[ROW][C]Summary of Dendrogram[/C][/ROW]
[ROW][C]Label[/C][C]Height[/C][/ROW]
[ROW][C]1[/C][C]2.21133443874961[/C][/ROW]
[ROW][C]2[/C][C]3.37786915081091[/C][/ROW]
[ROW][C]3[/C][C]4.46094160463909[/C][/ROW]
[ROW][C]4[/C][C]4.73919824442911[/C][/ROW]
[ROW][C]5[/C][C]5.10783711564887[/C][/ROW]
[ROW][C]6[/C][C]5.50726792520574[/C][/ROW]
[ROW][C]7[/C][C]6.81307127384786[/C][/ROW]
[ROW][C]8[/C][C]7.32734604068895[/C][/ROW]
[ROW][C]9[/C][C]7.9968743894099[/C][/ROW]
[ROW][C]10[/C][C]8.12201234317024[/C][/ROW]
[ROW][C]11[/C][C]9.48665249565916[/C][/ROW]
[ROW][C]12[/C][C]9.7780366127357[/C][/ROW]
[ROW][C]13[/C][C]10.9849897587572[/C][/ROW]
[ROW][C]14[/C][C]11.0932411855147[/C][/ROW]
[ROW][C]15[/C][C]11.4893826934431[/C][/ROW]
[ROW][C]16[/C][C]12.0194083564491[/C][/ROW]
[ROW][C]17[/C][C]12.4418513164528[/C][/ROW]
[ROW][C]18[/C][C]15.1247316299383[/C][/ROW]
[ROW][C]19[/C][C]15.5736957720382[/C][/ROW]
[ROW][C]20[/C][C]15.9493227279739[/C][/ROW]
[ROW][C]21[/C][C]16.8063405942193[/C][/ROW]
[ROW][C]22[/C][C]20.359084918004[/C][/ROW]
[ROW][C]23[/C][C]24.7893517956673[/C][/ROW]
[ROW][C]24[/C][C]25.4898075869372[/C][/ROW]
[ROW][C]25[/C][C]29.5135530284135[/C][/ROW]
[ROW][C]26[/C][C]32.9792526066896[/C][/ROW]
[ROW][C]27[/C][C]40.125169193723[/C][/ROW]
[ROW][C]28[/C][C]51.1128890074464[/C][/ROW]
[ROW][C]29[/C][C]64.8543117602986[/C][/ROW]
[ROW][C]30[/C][C]118.261133165849[/C][/ROW]
[ROW][C]31[/C][C]335.784448231553[/C][/ROW]
[/TABLE]
Source: https://freestatistics.org/blog/index.php?pk=148&T=1

Globally Unique Identifier (entire table): ba.freestatistics.org/blog/index.php?pk=148&T=1

As an alternative you can also use a QR Code:  

The GUIDs for individual cells are displayed in the table below:

Summary of Dendrogram
LabelHeight
12.21133443874961
23.37786915081091
34.46094160463909
44.73919824442911
55.10783711564887
65.50726792520574
76.81307127384786
87.32734604068895
97.9968743894099
108.12201234317024
119.48665249565916
129.7780366127357
1310.9849897587572
1411.0932411855147
1511.4893826934431
1612.0194083564491
1712.4418513164528
1815.1247316299383
1915.5736957720382
2015.9493227279739
2116.8063405942193
2220.359084918004
2324.7893517956673
2425.4898075869372
2529.5135530284135
2632.9792526066896
2740.125169193723
2851.1128890074464
2964.8543117602986
30118.261133165849
31335.784448231553


Parameters (Session):
par1 = ward ; par2 = ALL ; par3 = FALSE ; par4 = FALSE ;
Parameters (R input):
par1 = ward ; par2 = ALL ; par3 = FALSE ; par4 = FALSE ;
R code (references can be found in the software module):
par3 <- as.logical(par3)
par4 <- as.logical(par4)
if (par3 == 'TRUE'){
dum = xlab
xlab = ylab
ylab = dum
}
x <- t(y)
hc <- hclust(dist(x),method=par1)
d <- as.dendrogram(hc)
str(d)
mysub <- paste('Method: ',par1)
bitmap(file='test1.png')
if (par4 == 'TRUE'){
plot(d,main=main,ylab=ylab,xlab=xlab,horiz=par3, nodePar=list(pch = c(1,NA), cex=0.8, lab.cex = 0.8),type='t',center=T, sub=mysub)
} else {
plot(d,main=main,ylab=ylab,xlab=xlab,horiz=par3, nodePar=list(pch = c(1,NA), cex=0.8, lab.cex = 0.8), sub=mysub)
}
dev.off()
if (par2 != 'ALL'){
if (par3 == 'TRUE'){
ylab = 'cluster'
} else {
xlab = 'cluster'
}
par2 <- as.numeric(par2)
memb <- cutree(hc, k = par2)
cent <- NULL
for(k in 1:par2){
cent <- rbind(cent, colMeans(x[memb == k, , drop = FALSE]))
}
hc1 <- hclust(dist(cent),method=par1, members = table(memb))
de <- as.dendrogram(hc1)
bitmap(file='test2.png')
if (par4 == 'TRUE'){
plot(de,main=main,ylab=ylab,xlab=xlab,horiz=par3, nodePar=list(pch = c(1,NA), cex=0.8, lab.cex = 0.8),type='t',center=T, sub=mysub)
} else {
plot(de,main=main,ylab=ylab,xlab=xlab,horiz=par3, nodePar=list(pch = c(1,NA), cex=0.8, lab.cex = 0.8), sub=mysub)
}
dev.off()
str(de)
}
load(file='createtable')
a<-table.start()
a<-table.row.start(a)
a<-table.element(a,'Summary of Dendrogram',2,TRUE)
a<-table.row.end(a)
a<-table.row.start(a)
a<-table.element(a,'Label',header=TRUE)
a<-table.element(a,'Height',header=TRUE)
a<-table.row.end(a)
num <- length(x[,1])-1
for (i in 1:num)
{
a<-table.row.start(a)
a<-table.element(a,hc$labels[i])
a<-table.element(a,hc$height[i])
a<-table.row.end(a)
}
a<-table.end(a)
table.save(a,file='mytable1.tab')
if (par2 != 'ALL'){
a<-table.start()
a<-table.row.start(a)
a<-table.element(a,'Summary of Cut Dendrogram',2,TRUE)
a<-table.row.end(a)
a<-table.row.start(a)
a<-table.element(a,'Label',header=TRUE)
a<-table.element(a,'Height',header=TRUE)
a<-table.row.end(a)
num <- par2-1
for (i in 1:num)
{
a<-table.row.start(a)
a<-table.element(a,i)
a<-table.element(a,hc1$height[i])
a<-table.row.end(a)
}
a<-table.end(a)
table.save(a,file='mytable2.tab')
}