Free Statistics

of Irreproducible Research!

Author's title

Author*Unverified author*
R Software Modulerwasp_hierarchicalclustering.wasp
Title produced by softwareHierarchical Clustering
Date of computationFri, 02 Nov 2007 06:55:45 -0700
Cite this page as followsStatistical Computations at FreeStatistics.org, Office for Research Development and Education, URL https://freestatistics.org/blog/index.php?v=date/2007/Nov/02/h3gyjo2280o2yxv1194011666.htm/, Retrieved Sat, 04 May 2024 00:55:40 +0000
Statistical Computations at FreeStatistics.org, Office for Research Development and Education, URL https://freestatistics.org/blog/index.php?pk=146, Retrieved Sat, 04 May 2024 00:55:40 +0000
QR Codes:

Original text written by user:
IsPrivate?No (this computation is public)
User-defined keywords
Estimated Impact226
Family? (F = Feedback message, R = changed R code, M = changed R Module, P = changed Parameters, D = changed Data)
-       [Hierarchical Clustering] [test] [2007-11-02 13:55:45] [8326296a4a969e220946fc6855491489] [Current]
Feedback Forum

Post a new message
Dataseries X:
99.2	96.7	101.0
99.0	98.1	100.1
100.0	100.0	100.0
111.6	104.9	90.6
122.2	104.9	86.5
117.6	109.5	89.7
121.1	110.8	90.6
136.0	112.3	82.8
154.2	109.3	70.1
153.6	105.3	65.4
158.5	101.7	61.3
140.6	95.4	62.5
136.2	96.4	63.6
168.0	97.6	52.6
154.3	102.4	59.7
149.0	101.6	59.5
165.5	103.8	61.3


Summary of compuational transaction
Raw Inputview raw input (R code)
Raw Outputview raw output of R engine
Computing time2 seconds
R Server'Herman Ole Andreas Wold' @ 193.190.124.10:1001

\begin{tabular}{lllllllll}
\hline
Summary of compuational transaction \tabularnewline
Raw Input & view raw input (R code)  \tabularnewline
Raw Output & view raw output of R engine  \tabularnewline
Computing time & 2 seconds \tabularnewline
R Server & 'Herman Ole Andreas Wold' @ 193.190.124.10:1001 \tabularnewline
\hline
\end{tabular}
%Source: https://freestatistics.org/blog/index.php?pk=146&T=0

[TABLE]
[ROW][C]Summary of compuational transaction[/C][/ROW]
[ROW][C]Raw Input[/C][C]view raw input (R code) [/C][/ROW]
[ROW][C]Raw Output[/C][C]view raw output of R engine [/C][/ROW]
[ROW][C]Computing time[/C][C]2 seconds[/C][/ROW]
[ROW][C]R Server[/C][C]'Herman Ole Andreas Wold' @ 193.190.124.10:1001[/C][/ROW]
[/TABLE]
Source: https://freestatistics.org/blog/index.php?pk=146&T=0

Globally Unique Identifier (entire table): ba.freestatistics.org/blog/index.php?pk=146&T=0

As an alternative you can also use a QR Code:  

The GUIDs for individual cells are displayed in the table below:

Summary of compuational transaction
Raw Inputview raw input (R code)
Raw Outputview raw output of R engine
Computing time2 seconds
R Server'Herman Ole Andreas Wold' @ 193.190.124.10:1001


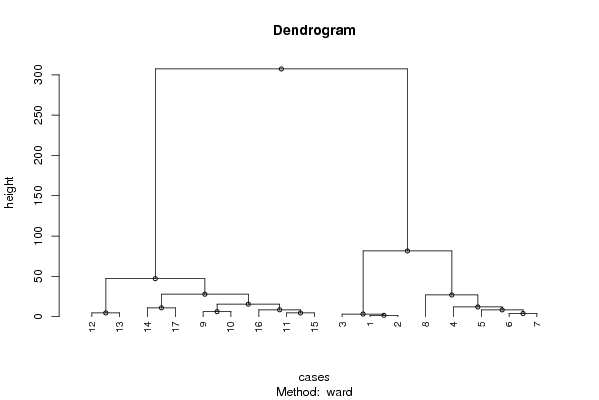
Summary of Dendrogram
LabelHeight
11.67630546142402
23.23402653292935
33.8405728739343
44.54862616621765
54.64435140789325
66.20080639917099
78.39864400729401
88.50599603503973
910.9717819883554
1012.0212578607405
1115.4926090852430
1226.9432977965583
1327.8557468012549
1447.1724144430048
1581.4903771049823
16307.260002490692

\begin{tabular}{lllllllll}
\hline
Summary of Dendrogram \tabularnewline
Label & Height \tabularnewline
1 & 1.67630546142402 \tabularnewline
2 & 3.23402653292935 \tabularnewline
3 & 3.8405728739343 \tabularnewline
4 & 4.54862616621765 \tabularnewline
5 & 4.64435140789325 \tabularnewline
6 & 6.20080639917099 \tabularnewline
7 & 8.39864400729401 \tabularnewline
8 & 8.50599603503973 \tabularnewline
9 & 10.9717819883554 \tabularnewline
10 & 12.0212578607405 \tabularnewline
11 & 15.4926090852430 \tabularnewline
12 & 26.9432977965583 \tabularnewline
13 & 27.8557468012549 \tabularnewline
14 & 47.1724144430048 \tabularnewline
15 & 81.4903771049823 \tabularnewline
16 & 307.260002490692 \tabularnewline
\hline
\end{tabular}
%Source: https://freestatistics.org/blog/index.php?pk=146&T=1

[TABLE]
[ROW][C]Summary of Dendrogram[/C][/ROW]
[ROW][C]Label[/C][C]Height[/C][/ROW]
[ROW][C]1[/C][C]1.67630546142402[/C][/ROW]
[ROW][C]2[/C][C]3.23402653292935[/C][/ROW]
[ROW][C]3[/C][C]3.8405728739343[/C][/ROW]
[ROW][C]4[/C][C]4.54862616621765[/C][/ROW]
[ROW][C]5[/C][C]4.64435140789325[/C][/ROW]
[ROW][C]6[/C][C]6.20080639917099[/C][/ROW]
[ROW][C]7[/C][C]8.39864400729401[/C][/ROW]
[ROW][C]8[/C][C]8.50599603503973[/C][/ROW]
[ROW][C]9[/C][C]10.9717819883554[/C][/ROW]
[ROW][C]10[/C][C]12.0212578607405[/C][/ROW]
[ROW][C]11[/C][C]15.4926090852430[/C][/ROW]
[ROW][C]12[/C][C]26.9432977965583[/C][/ROW]
[ROW][C]13[/C][C]27.8557468012549[/C][/ROW]
[ROW][C]14[/C][C]47.1724144430048[/C][/ROW]
[ROW][C]15[/C][C]81.4903771049823[/C][/ROW]
[ROW][C]16[/C][C]307.260002490692[/C][/ROW]
[/TABLE]
Source: https://freestatistics.org/blog/index.php?pk=146&T=1

Globally Unique Identifier (entire table): ba.freestatistics.org/blog/index.php?pk=146&T=1

As an alternative you can also use a QR Code:  

The GUIDs for individual cells are displayed in the table below:

Summary of Dendrogram
LabelHeight
11.67630546142402
23.23402653292935
33.8405728739343
44.54862616621765
54.64435140789325
66.20080639917099
78.39864400729401
88.50599603503973
910.9717819883554
1012.0212578607405
1115.4926090852430
1226.9432977965583
1327.8557468012549
1447.1724144430048
1581.4903771049823
16307.260002490692


Parameters (Session):
par1 = ward ; par2 = ALL ; par3 = FALSE ; par4 = FALSE ;
Parameters (R input):
par1 = ward ; par2 = ALL ; par3 = FALSE ; par4 = FALSE ;
R code (references can be found in the software module):
par3 <- as.logical(par3)
par4 <- as.logical(par4)
if (par3 == 'TRUE'){
dum = xlab
xlab = ylab
ylab = dum
}
x <- t(y)
hc <- hclust(dist(x),method=par1)
d <- as.dendrogram(hc)
str(d)
mysub <- paste('Method: ',par1)
bitmap(file='test1.png')
if (par4 == 'TRUE'){
plot(d,main=main,ylab=ylab,xlab=xlab,horiz=par3, nodePar=list(pch = c(1,NA), cex=0.8, lab.cex = 0.8),type='t',center=T, sub=mysub)
} else {
plot(d,main=main,ylab=ylab,xlab=xlab,horiz=par3, nodePar=list(pch = c(1,NA), cex=0.8, lab.cex = 0.8), sub=mysub)
}
dev.off()
if (par2 != 'ALL'){
if (par3 == 'TRUE'){
ylab = 'cluster'
} else {
xlab = 'cluster'
}
par2 <- as.numeric(par2)
memb <- cutree(hc, k = par2)
cent <- NULL
for(k in 1:par2){
cent <- rbind(cent, colMeans(x[memb == k, , drop = FALSE]))
}
hc1 <- hclust(dist(cent),method=par1, members = table(memb))
de <- as.dendrogram(hc1)
bitmap(file='test2.png')
if (par4 == 'TRUE'){
plot(de,main=main,ylab=ylab,xlab=xlab,horiz=par3, nodePar=list(pch = c(1,NA), cex=0.8, lab.cex = 0.8),type='t',center=T, sub=mysub)
} else {
plot(de,main=main,ylab=ylab,xlab=xlab,horiz=par3, nodePar=list(pch = c(1,NA), cex=0.8, lab.cex = 0.8), sub=mysub)
}
dev.off()
str(de)
}
load(file='createtable')
a<-table.start()
a<-table.row.start(a)
a<-table.element(a,'Summary of Dendrogram',2,TRUE)
a<-table.row.end(a)
a<-table.row.start(a)
a<-table.element(a,'Label',header=TRUE)
a<-table.element(a,'Height',header=TRUE)
a<-table.row.end(a)
num <- length(x[,1])-1
for (i in 1:num)
{
a<-table.row.start(a)
a<-table.element(a,hc$labels[i])
a<-table.element(a,hc$height[i])
a<-table.row.end(a)
}
a<-table.end(a)
table.save(a,file='mytable1.tab')
if (par2 != 'ALL'){
a<-table.start()
a<-table.row.start(a)
a<-table.element(a,'Summary of Cut Dendrogram',2,TRUE)
a<-table.row.end(a)
a<-table.row.start(a)
a<-table.element(a,'Label',header=TRUE)
a<-table.element(a,'Height',header=TRUE)
a<-table.row.end(a)
num <- par2-1
for (i in 1:num)
{
a<-table.row.start(a)
a<-table.element(a,i)
a<-table.element(a,hc1$height[i])
a<-table.row.end(a)
}
a<-table.end(a)
table.save(a,file='mytable2.tab')
}