Free Statistics

of Irreproducible Research!

Author's title

Author*Unverified author*
R Software Modulerwasp_hierarchicalclustering.wasp
Title produced by softwareHierarchical Clustering
Date of computationThu, 01 Nov 2007 03:03:21 -0700
Cite this page as followsStatistical Computations at FreeStatistics.org, Office for Research Development and Education, URL https://freestatistics.org/blog/index.php?v=date/2007/Nov/01/f26h6ltbeisozva1193911474.htm/, Retrieved Tue, 07 May 2024 18:24:28 +0000
Statistical Computations at FreeStatistics.org, Office for Research Development and Education, URL https://freestatistics.org/blog/index.php?pk=52, Retrieved Tue, 07 May 2024 18:24:28 +0000
QR Codes:

Original text written by user:
IsPrivate?No (this computation is public)
User-defined keywords
Estimated Impact215
Family? (F = Feedback message, R = changed R code, M = changed R Module, P = changed Parameters, D = changed Data)
-       [Hierarchical Clustering] [Cluster gewone ge...] [2007-11-01 10:03:21] [2cdb7403ed3391afb545b8c0d20da37e] [Current]
Feedback Forum

Post a new message
Dataseries X:
7,8
7,9
7,9
7,9
7,9
8
8
8,1
8,1
8,1
8,2
8,3
8,3
8,3
8,4
8,4
8,5
8,6
8,6
8,6
8,7
8,7
8,7
8,7
8,7
8,7
8,7
8,8
8,8
8,8
8,8
8,8
8,9
8,9
8,8
8,8
8,8
8,8
8,7
8,7
8,7
8,8
8,8
8,7
8,7
8,6
8,5
8,4
8,3
8,3
8,4
8,4
8,3
8,2
8,1
8
7,9
7,9
7,8
7,8
7,7
7,7
7,6
7,5
7,4
7,2
7,1
7
7
6,9
6,9
6,9


Summary of compuational transaction
Raw Inputview raw input (R code)
Raw Outputview raw output of R engine
Computing time2 seconds
R Server'Gwilym Jenkins' @ 72.249.127.135

\begin{tabular}{lllllllll}
\hline
Summary of compuational transaction \tabularnewline
Raw Input & view raw input (R code)  \tabularnewline
Raw Output & view raw output of R engine  \tabularnewline
Computing time & 2 seconds \tabularnewline
R Server & 'Gwilym Jenkins' @ 72.249.127.135 \tabularnewline
\hline
\end{tabular}
%Source: https://freestatistics.org/blog/index.php?pk=52&T=0

[TABLE]
[ROW][C]Summary of compuational transaction[/C][/ROW]
[ROW][C]Raw Input[/C][C]view raw input (R code) [/C][/ROW]
[ROW][C]Raw Output[/C][C]view raw output of R engine [/C][/ROW]
[ROW][C]Computing time[/C][C]2 seconds[/C][/ROW]
[ROW][C]R Server[/C][C]'Gwilym Jenkins' @ 72.249.127.135[/C][/ROW]
[/TABLE]
Source: https://freestatistics.org/blog/index.php?pk=52&T=0

Globally Unique Identifier (entire table): ba.freestatistics.org/blog/index.php?pk=52&T=0

As an alternative you can also use a QR Code:  

The GUIDs for individual cells are displayed in the table below:

Summary of compuational transaction
Raw Inputview raw input (R code)
Raw Outputview raw output of R engine
Computing time2 seconds
R Server'Gwilym Jenkins' @ 72.249.127.135


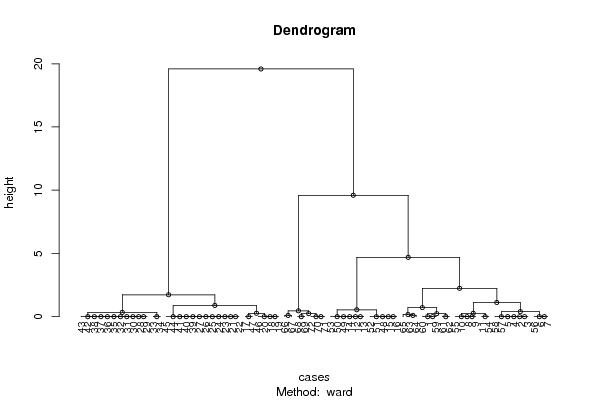
Summary of Dendrogram
LabelHeight
10
20
30
40
50
60
70
80
90
100
110
120
130
140
150
160
170
180
190
200
210
220
230
240
250
260
270
280
290
300
310
320
330
340
350
360
370
380
390
400
410
420
430
440
450
460
470
480
490
500
510
520
530.0999999999999996
540.100000000000001
550.166666666666666
560.239999999999999
570.239999999999999
580.266666666666666
590.266666666666666
600.338461538461537
610.399999999999999
620.459999999999999
630.545454545454544
640.718333333333334
650.888888888888886
661.12000000000000
671.73178935759583
682.24050724637681
694.69060683561963
709.59956958393114
7119.5891664481161

\begin{tabular}{lllllllll}
\hline
Summary of Dendrogram \tabularnewline
Label & Height \tabularnewline
1 & 0 \tabularnewline
2 & 0 \tabularnewline
3 & 0 \tabularnewline
4 & 0 \tabularnewline
5 & 0 \tabularnewline
6 & 0 \tabularnewline
7 & 0 \tabularnewline
8 & 0 \tabularnewline
9 & 0 \tabularnewline
10 & 0 \tabularnewline
11 & 0 \tabularnewline
12 & 0 \tabularnewline
13 & 0 \tabularnewline
14 & 0 \tabularnewline
15 & 0 \tabularnewline
16 & 0 \tabularnewline
17 & 0 \tabularnewline
18 & 0 \tabularnewline
19 & 0 \tabularnewline
20 & 0 \tabularnewline
21 & 0 \tabularnewline
22 & 0 \tabularnewline
23 & 0 \tabularnewline
24 & 0 \tabularnewline
25 & 0 \tabularnewline
26 & 0 \tabularnewline
27 & 0 \tabularnewline
28 & 0 \tabularnewline
29 & 0 \tabularnewline
30 & 0 \tabularnewline
31 & 0 \tabularnewline
32 & 0 \tabularnewline
33 & 0 \tabularnewline
34 & 0 \tabularnewline
35 & 0 \tabularnewline
36 & 0 \tabularnewline
37 & 0 \tabularnewline
38 & 0 \tabularnewline
39 & 0 \tabularnewline
40 & 0 \tabularnewline
41 & 0 \tabularnewline
42 & 0 \tabularnewline
43 & 0 \tabularnewline
44 & 0 \tabularnewline
45 & 0 \tabularnewline
46 & 0 \tabularnewline
47 & 0 \tabularnewline
48 & 0 \tabularnewline
49 & 0 \tabularnewline
50 & 0 \tabularnewline
51 & 0 \tabularnewline
52 & 0 \tabularnewline
53 & 0.0999999999999996 \tabularnewline
54 & 0.100000000000001 \tabularnewline
55 & 0.166666666666666 \tabularnewline
56 & 0.239999999999999 \tabularnewline
57 & 0.239999999999999 \tabularnewline
58 & 0.266666666666666 \tabularnewline
59 & 0.266666666666666 \tabularnewline
60 & 0.338461538461537 \tabularnewline
61 & 0.399999999999999 \tabularnewline
62 & 0.459999999999999 \tabularnewline
63 & 0.545454545454544 \tabularnewline
64 & 0.718333333333334 \tabularnewline
65 & 0.888888888888886 \tabularnewline
66 & 1.12000000000000 \tabularnewline
67 & 1.73178935759583 \tabularnewline
68 & 2.24050724637681 \tabularnewline
69 & 4.69060683561963 \tabularnewline
70 & 9.59956958393114 \tabularnewline
71 & 19.5891664481161 \tabularnewline
\hline
\end{tabular}
%Source: https://freestatistics.org/blog/index.php?pk=52&T=1

[TABLE]
[ROW][C]Summary of Dendrogram[/C][/ROW]
[ROW][C]Label[/C][C]Height[/C][/ROW]
[ROW][C]1[/C][C]0[/C][/ROW]
[ROW][C]2[/C][C]0[/C][/ROW]
[ROW][C]3[/C][C]0[/C][/ROW]
[ROW][C]4[/C][C]0[/C][/ROW]
[ROW][C]5[/C][C]0[/C][/ROW]
[ROW][C]6[/C][C]0[/C][/ROW]
[ROW][C]7[/C][C]0[/C][/ROW]
[ROW][C]8[/C][C]0[/C][/ROW]
[ROW][C]9[/C][C]0[/C][/ROW]
[ROW][C]10[/C][C]0[/C][/ROW]
[ROW][C]11[/C][C]0[/C][/ROW]
[ROW][C]12[/C][C]0[/C][/ROW]
[ROW][C]13[/C][C]0[/C][/ROW]
[ROW][C]14[/C][C]0[/C][/ROW]
[ROW][C]15[/C][C]0[/C][/ROW]
[ROW][C]16[/C][C]0[/C][/ROW]
[ROW][C]17[/C][C]0[/C][/ROW]
[ROW][C]18[/C][C]0[/C][/ROW]
[ROW][C]19[/C][C]0[/C][/ROW]
[ROW][C]20[/C][C]0[/C][/ROW]
[ROW][C]21[/C][C]0[/C][/ROW]
[ROW][C]22[/C][C]0[/C][/ROW]
[ROW][C]23[/C][C]0[/C][/ROW]
[ROW][C]24[/C][C]0[/C][/ROW]
[ROW][C]25[/C][C]0[/C][/ROW]
[ROW][C]26[/C][C]0[/C][/ROW]
[ROW][C]27[/C][C]0[/C][/ROW]
[ROW][C]28[/C][C]0[/C][/ROW]
[ROW][C]29[/C][C]0[/C][/ROW]
[ROW][C]30[/C][C]0[/C][/ROW]
[ROW][C]31[/C][C]0[/C][/ROW]
[ROW][C]32[/C][C]0[/C][/ROW]
[ROW][C]33[/C][C]0[/C][/ROW]
[ROW][C]34[/C][C]0[/C][/ROW]
[ROW][C]35[/C][C]0[/C][/ROW]
[ROW][C]36[/C][C]0[/C][/ROW]
[ROW][C]37[/C][C]0[/C][/ROW]
[ROW][C]38[/C][C]0[/C][/ROW]
[ROW][C]39[/C][C]0[/C][/ROW]
[ROW][C]40[/C][C]0[/C][/ROW]
[ROW][C]41[/C][C]0[/C][/ROW]
[ROW][C]42[/C][C]0[/C][/ROW]
[ROW][C]43[/C][C]0[/C][/ROW]
[ROW][C]44[/C][C]0[/C][/ROW]
[ROW][C]45[/C][C]0[/C][/ROW]
[ROW][C]46[/C][C]0[/C][/ROW]
[ROW][C]47[/C][C]0[/C][/ROW]
[ROW][C]48[/C][C]0[/C][/ROW]
[ROW][C]49[/C][C]0[/C][/ROW]
[ROW][C]50[/C][C]0[/C][/ROW]
[ROW][C]51[/C][C]0[/C][/ROW]
[ROW][C]52[/C][C]0[/C][/ROW]
[ROW][C]53[/C][C]0.0999999999999996[/C][/ROW]
[ROW][C]54[/C][C]0.100000000000001[/C][/ROW]
[ROW][C]55[/C][C]0.166666666666666[/C][/ROW]
[ROW][C]56[/C][C]0.239999999999999[/C][/ROW]
[ROW][C]57[/C][C]0.239999999999999[/C][/ROW]
[ROW][C]58[/C][C]0.266666666666666[/C][/ROW]
[ROW][C]59[/C][C]0.266666666666666[/C][/ROW]
[ROW][C]60[/C][C]0.338461538461537[/C][/ROW]
[ROW][C]61[/C][C]0.399999999999999[/C][/ROW]
[ROW][C]62[/C][C]0.459999999999999[/C][/ROW]
[ROW][C]63[/C][C]0.545454545454544[/C][/ROW]
[ROW][C]64[/C][C]0.718333333333334[/C][/ROW]
[ROW][C]65[/C][C]0.888888888888886[/C][/ROW]
[ROW][C]66[/C][C]1.12000000000000[/C][/ROW]
[ROW][C]67[/C][C]1.73178935759583[/C][/ROW]
[ROW][C]68[/C][C]2.24050724637681[/C][/ROW]
[ROW][C]69[/C][C]4.69060683561963[/C][/ROW]
[ROW][C]70[/C][C]9.59956958393114[/C][/ROW]
[ROW][C]71[/C][C]19.5891664481161[/C][/ROW]
[/TABLE]
Source: https://freestatistics.org/blog/index.php?pk=52&T=1

Globally Unique Identifier (entire table): ba.freestatistics.org/blog/index.php?pk=52&T=1

As an alternative you can also use a QR Code:  

The GUIDs for individual cells are displayed in the table below:

Summary of Dendrogram
LabelHeight
10
20
30
40
50
60
70
80
90
100
110
120
130
140
150
160
170
180
190
200
210
220
230
240
250
260
270
280
290
300
310
320
330
340
350
360
370
380
390
400
410
420
430
440
450
460
470
480
490
500
510
520
530.0999999999999996
540.100000000000001
550.166666666666666
560.239999999999999
570.239999999999999
580.266666666666666
590.266666666666666
600.338461538461537
610.399999999999999
620.459999999999999
630.545454545454544
640.718333333333334
650.888888888888886
661.12000000000000
671.73178935759583
682.24050724637681
694.69060683561963
709.59956958393114
7119.5891664481161


Parameters (Session):
par1 = ward ; par2 = ALL ; par3 = FALSE ; par4 = FALSE ;
Parameters (R input):
par1 = ward ; par2 = ALL ; par3 = FALSE ; par4 = FALSE ;
R code (references can be found in the software module):
par3 <- as.logical(par3)
par4 <- as.logical(par4)
if (par3 == 'TRUE'){
dum = xlab
xlab = ylab
ylab = dum
}
x <- t(y)
hc <- hclust(dist(x),method=par1)
d <- as.dendrogram(hc)
str(d)
mysub <- paste('Method: ',par1)
bitmap(file='test1.png')
if (par4 == 'TRUE'){
plot(d,main=main,ylab=ylab,xlab=xlab,horiz=par3, nodePar=list(pch = c(1,NA), cex=0.8, lab.cex = 0.8),type='t',center=T, sub=mysub)
} else {
plot(d,main=main,ylab=ylab,xlab=xlab,horiz=par3, nodePar=list(pch = c(1,NA), cex=0.8, lab.cex = 0.8), sub=mysub)
}
dev.off()
if (par2 != 'ALL'){
if (par3 == 'TRUE'){
ylab = 'cluster'
} else {
xlab = 'cluster'
}
par2 <- as.numeric(par2)
memb <- cutree(hc, k = par2)
cent <- NULL
for(k in 1:par2){
cent <- rbind(cent, colMeans(x[memb == k, , drop = FALSE]))
}
hc1 <- hclust(dist(cent),method=par1, members = table(memb))
de <- as.dendrogram(hc1)
bitmap(file='test2.png')
if (par4 == 'TRUE'){
plot(de,main=main,ylab=ylab,xlab=xlab,horiz=par3, nodePar=list(pch = c(1,NA), cex=0.8, lab.cex = 0.8),type='t',center=T, sub=mysub)
} else {
plot(de,main=main,ylab=ylab,xlab=xlab,horiz=par3, nodePar=list(pch = c(1,NA), cex=0.8, lab.cex = 0.8), sub=mysub)
}
dev.off()
str(de)
}
load(file='createtable')
a<-table.start()
a<-table.row.start(a)
a<-table.element(a,'Summary of Dendrogram',2,TRUE)
a<-table.row.end(a)
a<-table.row.start(a)
a<-table.element(a,'Label',header=TRUE)
a<-table.element(a,'Height',header=TRUE)
a<-table.row.end(a)
num <- length(x[,1])-1
for (i in 1:num)
{
a<-table.row.start(a)
a<-table.element(a,hc$labels[i])
a<-table.element(a,hc$height[i])
a<-table.row.end(a)
}
a<-table.end(a)
table.save(a,file='mytable1.tab')
if (par2 != 'ALL'){
a<-table.start()
a<-table.row.start(a)
a<-table.element(a,'Summary of Cut Dendrogram',2,TRUE)
a<-table.row.end(a)
a<-table.row.start(a)
a<-table.element(a,'Label',header=TRUE)
a<-table.element(a,'Height',header=TRUE)
a<-table.row.end(a)
num <- par2-1
for (i in 1:num)
{
a<-table.row.start(a)
a<-table.element(a,i)
a<-table.element(a,hc1$height[i])
a<-table.row.end(a)
}
a<-table.end(a)
table.save(a,file='mytable2.tab')
}