Free Statistics

of Irreproducible Research!

Author's title

Author*Unverified author*
R Software Modulerwasp_hierarchicalclustering.wasp
Title produced by softwareHierarchical Clustering
Date of computationThu, 01 Nov 2007 02:50:11 -0700
Cite this page as followsStatistical Computations at FreeStatistics.org, Office for Research Development and Education, URL https://freestatistics.org/blog/index.php?v=date/2007/Nov/01/29pc6xuoviz01x61193910584.htm/, Retrieved Wed, 08 May 2024 02:27:49 +0000
Statistical Computations at FreeStatistics.org, Office for Research Development and Education, URL https://freestatistics.org/blog/index.php?pk=7, Retrieved Wed, 08 May 2024 02:27:49 +0000
QR Codes:

Original text written by user:
IsPrivate?No (this computation is public)
User-defined keywords
Estimated Impact261
Family? (F = Feedback message, R = changed R code, M = changed R Module, P = changed Parameters, D = changed Data)
-       [Hierarchical Clustering] [Cluster Werkloosh...] [2007-11-01 09:50:11] [2cdb7403ed3391afb545b8c0d20da37e] [Current]
Feedback Forum

Post a new message
Dataseries X:
513
503
471
471
476
475
470
461
455
456
517
525
523
519
509
512
519
517
510
509
501
507
569
580
578
565
547
555
562
561
555
544
537
543
594
611
613
611
594
595
591
589
584
573
567
569
621
629
628
612
595
597
593
590
580
574
573
573
620
626
620
588
566
557
561
549
532
526
511
499
555
565


Summary of compuational transaction
Raw Inputview raw input (R code)
Raw Outputview raw output of R engine
Computing time2 seconds
R Server'Gwilym Jenkins' @ 72.249.127.135

\begin{tabular}{lllllllll}
\hline
Summary of compuational transaction \tabularnewline
Raw Input & view raw input (R code)  \tabularnewline
Raw Output & view raw output of R engine  \tabularnewline
Computing time & 2 seconds \tabularnewline
R Server & 'Gwilym Jenkins' @ 72.249.127.135 \tabularnewline
\hline
\end{tabular}
%Source: https://freestatistics.org/blog/index.php?pk=7&T=0

[TABLE]
[ROW][C]Summary of compuational transaction[/C][/ROW]
[ROW][C]Raw Input[/C][C]view raw input (R code) [/C][/ROW]
[ROW][C]Raw Output[/C][C]view raw output of R engine [/C][/ROW]
[ROW][C]Computing time[/C][C]2 seconds[/C][/ROW]
[ROW][C]R Server[/C][C]'Gwilym Jenkins' @ 72.249.127.135[/C][/ROW]
[/TABLE]
Source: https://freestatistics.org/blog/index.php?pk=7&T=0

Globally Unique Identifier (entire table): ba.freestatistics.org/blog/index.php?pk=7&T=0

As an alternative you can also use a QR Code:  

The GUIDs for individual cells are displayed in the table below:

Summary of compuational transaction
Raw Inputview raw input (R code)
Raw Outputview raw output of R engine
Computing time2 seconds
R Server'Gwilym Jenkins' @ 72.249.127.135


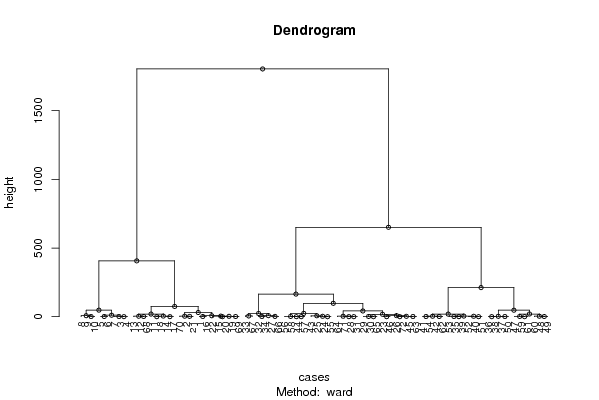
Summary of Dendrogram
LabelHeight
10
20
30
40
50
60
70
80
90
100
110
120
130
140
150
160
171
181
191
201
211
221
231
241
251
261
271
281.33333333333333
291.33333333333333
301.33333333333333
311.33333333333333
321.5
332
342
352.5
362.5
372.5
382.66666666666667
392.66666666666667
403
413
423
433
443.33333333333333
453.7
464
474
485
496.33333333333333
506.65714285714286
517
527.5
537.5
5410.4666666666667
5517.4444444444444
5618.6
5718.8571428571429
5819.3333333333333
5923.1666666666667
6023.75
6130.2095238095238
6241.3760683760684
6346.8333333333333
6447.45
6574.272268907563
6697.1199633699634
67164.253968253968
68211.7
69406.300588235294
70650.95768321513
711804.32898345154

\begin{tabular}{lllllllll}
\hline
Summary of Dendrogram \tabularnewline
Label & Height \tabularnewline
1 & 0 \tabularnewline
2 & 0 \tabularnewline
3 & 0 \tabularnewline
4 & 0 \tabularnewline
5 & 0 \tabularnewline
6 & 0 \tabularnewline
7 & 0 \tabularnewline
8 & 0 \tabularnewline
9 & 0 \tabularnewline
10 & 0 \tabularnewline
11 & 0 \tabularnewline
12 & 0 \tabularnewline
13 & 0 \tabularnewline
14 & 0 \tabularnewline
15 & 0 \tabularnewline
16 & 0 \tabularnewline
17 & 1 \tabularnewline
18 & 1 \tabularnewline
19 & 1 \tabularnewline
20 & 1 \tabularnewline
21 & 1 \tabularnewline
22 & 1 \tabularnewline
23 & 1 \tabularnewline
24 & 1 \tabularnewline
25 & 1 \tabularnewline
26 & 1 \tabularnewline
27 & 1 \tabularnewline
28 & 1.33333333333333 \tabularnewline
29 & 1.33333333333333 \tabularnewline
30 & 1.33333333333333 \tabularnewline
31 & 1.33333333333333 \tabularnewline
32 & 1.5 \tabularnewline
33 & 2 \tabularnewline
34 & 2 \tabularnewline
35 & 2.5 \tabularnewline
36 & 2.5 \tabularnewline
37 & 2.5 \tabularnewline
38 & 2.66666666666667 \tabularnewline
39 & 2.66666666666667 \tabularnewline
40 & 3 \tabularnewline
41 & 3 \tabularnewline
42 & 3 \tabularnewline
43 & 3 \tabularnewline
44 & 3.33333333333333 \tabularnewline
45 & 3.7 \tabularnewline
46 & 4 \tabularnewline
47 & 4 \tabularnewline
48 & 5 \tabularnewline
49 & 6.33333333333333 \tabularnewline
50 & 6.65714285714286 \tabularnewline
51 & 7 \tabularnewline
52 & 7.5 \tabularnewline
53 & 7.5 \tabularnewline
54 & 10.4666666666667 \tabularnewline
55 & 17.4444444444444 \tabularnewline
56 & 18.6 \tabularnewline
57 & 18.8571428571429 \tabularnewline
58 & 19.3333333333333 \tabularnewline
59 & 23.1666666666667 \tabularnewline
60 & 23.75 \tabularnewline
61 & 30.2095238095238 \tabularnewline
62 & 41.3760683760684 \tabularnewline
63 & 46.8333333333333 \tabularnewline
64 & 47.45 \tabularnewline
65 & 74.272268907563 \tabularnewline
66 & 97.1199633699634 \tabularnewline
67 & 164.253968253968 \tabularnewline
68 & 211.7 \tabularnewline
69 & 406.300588235294 \tabularnewline
70 & 650.95768321513 \tabularnewline
71 & 1804.32898345154 \tabularnewline
\hline
\end{tabular}
%Source: https://freestatistics.org/blog/index.php?pk=7&T=1

[TABLE]
[ROW][C]Summary of Dendrogram[/C][/ROW]
[ROW][C]Label[/C][C]Height[/C][/ROW]
[ROW][C]1[/C][C]0[/C][/ROW]
[ROW][C]2[/C][C]0[/C][/ROW]
[ROW][C]3[/C][C]0[/C][/ROW]
[ROW][C]4[/C][C]0[/C][/ROW]
[ROW][C]5[/C][C]0[/C][/ROW]
[ROW][C]6[/C][C]0[/C][/ROW]
[ROW][C]7[/C][C]0[/C][/ROW]
[ROW][C]8[/C][C]0[/C][/ROW]
[ROW][C]9[/C][C]0[/C][/ROW]
[ROW][C]10[/C][C]0[/C][/ROW]
[ROW][C]11[/C][C]0[/C][/ROW]
[ROW][C]12[/C][C]0[/C][/ROW]
[ROW][C]13[/C][C]0[/C][/ROW]
[ROW][C]14[/C][C]0[/C][/ROW]
[ROW][C]15[/C][C]0[/C][/ROW]
[ROW][C]16[/C][C]0[/C][/ROW]
[ROW][C]17[/C][C]1[/C][/ROW]
[ROW][C]18[/C][C]1[/C][/ROW]
[ROW][C]19[/C][C]1[/C][/ROW]
[ROW][C]20[/C][C]1[/C][/ROW]
[ROW][C]21[/C][C]1[/C][/ROW]
[ROW][C]22[/C][C]1[/C][/ROW]
[ROW][C]23[/C][C]1[/C][/ROW]
[ROW][C]24[/C][C]1[/C][/ROW]
[ROW][C]25[/C][C]1[/C][/ROW]
[ROW][C]26[/C][C]1[/C][/ROW]
[ROW][C]27[/C][C]1[/C][/ROW]
[ROW][C]28[/C][C]1.33333333333333[/C][/ROW]
[ROW][C]29[/C][C]1.33333333333333[/C][/ROW]
[ROW][C]30[/C][C]1.33333333333333[/C][/ROW]
[ROW][C]31[/C][C]1.33333333333333[/C][/ROW]
[ROW][C]32[/C][C]1.5[/C][/ROW]
[ROW][C]33[/C][C]2[/C][/ROW]
[ROW][C]34[/C][C]2[/C][/ROW]
[ROW][C]35[/C][C]2.5[/C][/ROW]
[ROW][C]36[/C][C]2.5[/C][/ROW]
[ROW][C]37[/C][C]2.5[/C][/ROW]
[ROW][C]38[/C][C]2.66666666666667[/C][/ROW]
[ROW][C]39[/C][C]2.66666666666667[/C][/ROW]
[ROW][C]40[/C][C]3[/C][/ROW]
[ROW][C]41[/C][C]3[/C][/ROW]
[ROW][C]42[/C][C]3[/C][/ROW]
[ROW][C]43[/C][C]3[/C][/ROW]
[ROW][C]44[/C][C]3.33333333333333[/C][/ROW]
[ROW][C]45[/C][C]3.7[/C][/ROW]
[ROW][C]46[/C][C]4[/C][/ROW]
[ROW][C]47[/C][C]4[/C][/ROW]
[ROW][C]48[/C][C]5[/C][/ROW]
[ROW][C]49[/C][C]6.33333333333333[/C][/ROW]
[ROW][C]50[/C][C]6.65714285714286[/C][/ROW]
[ROW][C]51[/C][C]7[/C][/ROW]
[ROW][C]52[/C][C]7.5[/C][/ROW]
[ROW][C]53[/C][C]7.5[/C][/ROW]
[ROW][C]54[/C][C]10.4666666666667[/C][/ROW]
[ROW][C]55[/C][C]17.4444444444444[/C][/ROW]
[ROW][C]56[/C][C]18.6[/C][/ROW]
[ROW][C]57[/C][C]18.8571428571429[/C][/ROW]
[ROW][C]58[/C][C]19.3333333333333[/C][/ROW]
[ROW][C]59[/C][C]23.1666666666667[/C][/ROW]
[ROW][C]60[/C][C]23.75[/C][/ROW]
[ROW][C]61[/C][C]30.2095238095238[/C][/ROW]
[ROW][C]62[/C][C]41.3760683760684[/C][/ROW]
[ROW][C]63[/C][C]46.8333333333333[/C][/ROW]
[ROW][C]64[/C][C]47.45[/C][/ROW]
[ROW][C]65[/C][C]74.272268907563[/C][/ROW]
[ROW][C]66[/C][C]97.1199633699634[/C][/ROW]
[ROW][C]67[/C][C]164.253968253968[/C][/ROW]
[ROW][C]68[/C][C]211.7[/C][/ROW]
[ROW][C]69[/C][C]406.300588235294[/C][/ROW]
[ROW][C]70[/C][C]650.95768321513[/C][/ROW]
[ROW][C]71[/C][C]1804.32898345154[/C][/ROW]
[/TABLE]
Source: https://freestatistics.org/blog/index.php?pk=7&T=1

Globally Unique Identifier (entire table): ba.freestatistics.org/blog/index.php?pk=7&T=1

As an alternative you can also use a QR Code:  

The GUIDs for individual cells are displayed in the table below:

Summary of Dendrogram
LabelHeight
10
20
30
40
50
60
70
80
90
100
110
120
130
140
150
160
171
181
191
201
211
221
231
241
251
261
271
281.33333333333333
291.33333333333333
301.33333333333333
311.33333333333333
321.5
332
342
352.5
362.5
372.5
382.66666666666667
392.66666666666667
403
413
423
433
443.33333333333333
453.7
464
474
485
496.33333333333333
506.65714285714286
517
527.5
537.5
5410.4666666666667
5517.4444444444444
5618.6
5718.8571428571429
5819.3333333333333
5923.1666666666667
6023.75
6130.2095238095238
6241.3760683760684
6346.8333333333333
6447.45
6574.272268907563
6697.1199633699634
67164.253968253968
68211.7
69406.300588235294
70650.95768321513
711804.32898345154


Parameters (Session):
par1 = ward ; par2 = ALL ; par3 = FALSE ; par4 = FALSE ;
Parameters (R input):
par1 = ward ; par2 = ALL ; par3 = FALSE ; par4 = FALSE ;
R code (references can be found in the software module):
par3 <- as.logical(par3)
par4 <- as.logical(par4)
if (par3 == 'TRUE'){
dum = xlab
xlab = ylab
ylab = dum
}
x <- t(y)
hc <- hclust(dist(x),method=par1)
d <- as.dendrogram(hc)
str(d)
mysub <- paste('Method: ',par1)
bitmap(file='test1.png')
if (par4 == 'TRUE'){
plot(d,main=main,ylab=ylab,xlab=xlab,horiz=par3, nodePar=list(pch = c(1,NA), cex=0.8, lab.cex = 0.8),type='t',center=T, sub=mysub)
} else {
plot(d,main=main,ylab=ylab,xlab=xlab,horiz=par3, nodePar=list(pch = c(1,NA), cex=0.8, lab.cex = 0.8), sub=mysub)
}
dev.off()
if (par2 != 'ALL'){
if (par3 == 'TRUE'){
ylab = 'cluster'
} else {
xlab = 'cluster'
}
par2 <- as.numeric(par2)
memb <- cutree(hc, k = par2)
cent <- NULL
for(k in 1:par2){
cent <- rbind(cent, colMeans(x[memb == k, , drop = FALSE]))
}
hc1 <- hclust(dist(cent),method=par1, members = table(memb))
de <- as.dendrogram(hc1)
bitmap(file='test2.png')
if (par4 == 'TRUE'){
plot(de,main=main,ylab=ylab,xlab=xlab,horiz=par3, nodePar=list(pch = c(1,NA), cex=0.8, lab.cex = 0.8),type='t',center=T, sub=mysub)
} else {
plot(de,main=main,ylab=ylab,xlab=xlab,horiz=par3, nodePar=list(pch = c(1,NA), cex=0.8, lab.cex = 0.8), sub=mysub)
}
dev.off()
str(de)
}
load(file='createtable')
a<-table.start()
a<-table.row.start(a)
a<-table.element(a,'Summary of Dendrogram',2,TRUE)
a<-table.row.end(a)
a<-table.row.start(a)
a<-table.element(a,'Label',header=TRUE)
a<-table.element(a,'Height',header=TRUE)
a<-table.row.end(a)
num <- length(x[,1])-1
for (i in 1:num)
{
a<-table.row.start(a)
a<-table.element(a,hc$labels[i])
a<-table.element(a,hc$height[i])
a<-table.row.end(a)
}
a<-table.end(a)
table.save(a,file='mytable1.tab')
if (par2 != 'ALL'){
a<-table.start()
a<-table.row.start(a)
a<-table.element(a,'Summary of Cut Dendrogram',2,TRUE)
a<-table.row.end(a)
a<-table.row.start(a)
a<-table.element(a,'Label',header=TRUE)
a<-table.element(a,'Height',header=TRUE)
a<-table.row.end(a)
num <- par2-1
for (i in 1:num)
{
a<-table.row.start(a)
a<-table.element(a,i)
a<-table.element(a,hc1$height[i])
a<-table.row.end(a)
}
a<-table.end(a)
table.save(a,file='mytable2.tab')
}