Free Statistics

of Irreproducible Research!

Author's title

Author*Unverified author*
R Software Modulerwasp_centraltendency.wasp
Title produced by softwareCentral Tendency
Date of computationMon, 31 Dec 2007 01:52:50 -0700
Cite this page as followsStatistical Computations at FreeStatistics.org, Office for Research Development and Education, URL https://freestatistics.org/blog/index.php?v=date/2007/Dec/31/t1199089887efh9vchhh40qwff.htm/, Retrieved Sun, 28 Apr 2024 01:17:20 +0000
Statistical Computations at FreeStatistics.org, Office for Research Development and Education, URL https://freestatistics.org/blog/index.php?pk=4938, Retrieved Sun, 28 Apr 2024 01:17:20 +0000
QR Codes:

Original text written by user:
IsPrivate?No (this computation is public)
User-defined keywordscentral tendency - vooruitzicht
Estimated Impact295
Family? (F = Feedback message, R = changed R code, M = changed R Module, P = changed Parameters, D = changed Data)
-       [Central Tendency] [investigating ass...] [2007-12-31 08:52:50] [ac6f409873aab27747ac7f3d36ded223] [Current]
Feedback Forum

Post a new message
Dataseries X:
87
75
74
91
101
103
106
102
105
105
100
95
96
98
99
92
84
81
72
89
96
91
88
90
98
87
100
100
104
107
105
102
98
106
97
101
100
93
94
96
96
98
102
95
85
84
82
87
77
90
90
94
97
96
93
93
93
97
100
95
97
103
102
93
99
100
97
104
102
103
100
90
90


Summary of compuational transaction
Raw Inputview raw input (R code)
Raw Outputview raw output of R engine
Computing time2 seconds
R Server'Gwilym Jenkins' @ 72.249.127.135

\begin{tabular}{lllllllll}
\hline
Summary of compuational transaction \tabularnewline
Raw Input & view raw input (R code)  \tabularnewline
Raw Output & view raw output of R engine  \tabularnewline
Computing time & 2 seconds \tabularnewline
R Server & 'Gwilym Jenkins' @ 72.249.127.135 \tabularnewline
\hline
\end{tabular}
%Source: https://freestatistics.org/blog/index.php?pk=4938&T=0

[TABLE]
[ROW][C]Summary of compuational transaction[/C][/ROW]
[ROW][C]Raw Input[/C][C]view raw input (R code) [/C][/ROW]
[ROW][C]Raw Output[/C][C]view raw output of R engine [/C][/ROW]
[ROW][C]Computing time[/C][C]2 seconds[/C][/ROW]
[ROW][C]R Server[/C][C]'Gwilym Jenkins' @ 72.249.127.135[/C][/ROW]
[/TABLE]
Source: https://freestatistics.org/blog/index.php?pk=4938&T=0

Globally Unique Identifier (entire table): ba.freestatistics.org/blog/index.php?pk=4938&T=0

As an alternative you can also use a QR Code:  

The GUIDs for individual cells are displayed in the table below:

Summary of compuational transaction
Raw Inputview raw input (R code)
Raw Outputview raw output of R engine
Computing time2 seconds
R Server'Gwilym Jenkins' @ 72.249.127.135


Central Tendency - Ungrouped Data
MeasureValueS.E.Value/S.E.
Arithmetic Mean94.9589041095890.924353070117727102.730122481764
Geometric Mean94.6145308224988
Harmonic Mean94.2477808321138
Quadratic Mean95.2822770968826
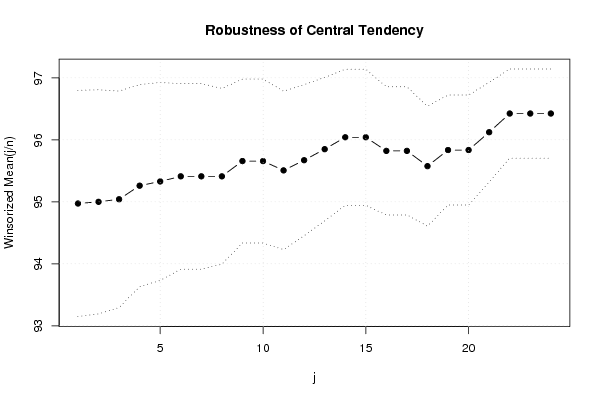
Winsorized Mean ( 1 / 24 )94.9726027397260.912865219074669104.037924498860
Winsorized Mean ( 2 / 24 )950.904285417153965105.055326778343
Winsorized Mean ( 3 / 24 )95.0410958904110.873122764744577108.851927504392
Winsorized Mean ( 4 / 24 )95.26027397260270.814870216216743116.90238773835
Winsorized Mean ( 5 / 24 )95.32876712328770.798603898470108119.369273435692
Winsorized Mean ( 6 / 24 )95.41095890410960.748625228189967127.448228180601
Winsorized Mean ( 7 / 24 )95.41095890410960.748625228189967127.448228180601
Winsorized Mean ( 8 / 24 )95.41095890410960.70894363083682134.581869071154
Winsorized Mean ( 9 / 24 )95.65753424657530.661285122295119144.653994202345
Winsorized Mean ( 10 / 24 )95.65753424657530.661285122295119144.653994202345
Winsorized Mean ( 11 / 24 )95.50684931506850.639016584056987149.459109040199
Winsorized Mean ( 12 / 24 )95.67123287671230.609430827894382156.984564117411
Winsorized Mean ( 13 / 24 )95.84931506849320.579216139891731165.481084636919
Winsorized Mean ( 14 / 24 )96.0410958904110.54877695624301175.009345414063
Winsorized Mean ( 15 / 24 )96.0410958904110.54877695624301175.009345414063
Winsorized Mean ( 16 / 24 )95.82191780821920.516965764712582185.354474800654
Winsorized Mean ( 17 / 24 )95.82191780821920.516965764712582185.354474800654
Winsorized Mean ( 18 / 24 )95.57534246575340.484115179407459197.42273436403
Winsorized Mean ( 19 / 24 )95.83561643835620.443545670744086216.067076649816
Winsorized Mean ( 20 / 24 )95.83561643835620.443545670744086216.067076649816
Winsorized Mean ( 21 / 24 )96.12328767123290.40117085367136239.606857755367
Winsorized Mean ( 22 / 24 )96.42465753424660.359645208340787268.110502511904
Winsorized Mean ( 23 / 24 )96.42465753424660.359645208340787268.110502511904
Winsorized Mean ( 24 / 24 )96.42465753424660.359645208340787268.110502511904
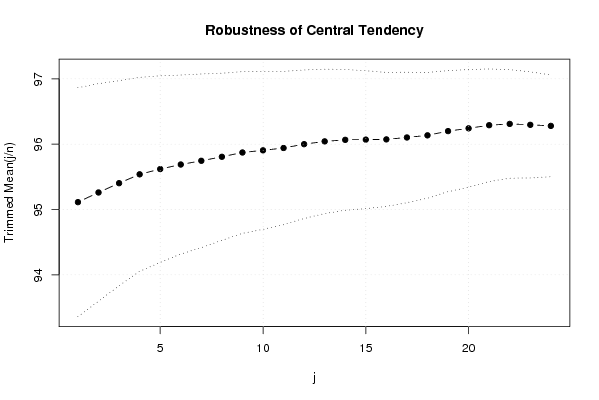
Trimmed Mean ( 1 / 24 )95.1126760563380.876372001848302108.530025897383
Trimmed Mean ( 2 / 24 )95.26086956521740.832434000802367114.436543285591
Trimmed Mean ( 3 / 24 )95.40298507462690.78488079148921121.550923540392
Trimmed Mean ( 4 / 24 )95.53846153846150.742292745963518128.707254729332
Trimmed Mean ( 5 / 24 )95.61904761904760.713927201374591133.933890507244
Trimmed Mean ( 6 / 24 )95.6885245901640.684943850599105139.702728196578
Trimmed Mean ( 7 / 24 )95.74576271186440.664536778035912144.078952251293
Trimmed Mean ( 8 / 24 )95.80701754385960.639371654900139149.845581688828
Trimmed Mean ( 9 / 24 )95.87272727272730.618488733476532155.011275199510
Trimmed Mean ( 10 / 24 )95.90566037735850.604328935450781158.697779886744
Trimmed Mean ( 11 / 24 )95.94117647058820.586389260197696163.613461198526
Trimmed Mean ( 12 / 24 )960.568444589824444168.881895823212
Trimmed Mean ( 13 / 24 )96.04255319148940.552479439266914173.839144709038
Trimmed Mean ( 14 / 24 )96.06666666666670.538797763825195178.298191114680
Trimmed Mean ( 15 / 24 )96.06976744186050.527636394523027182.075702963412
Trimmed Mean ( 16 / 24 )96.07317073170730.512514418479437187.454571554774
Trimmed Mean ( 17 / 24 )96.1025641025640.499385414180183192.441672050697
Trimmed Mean ( 18 / 24 )96.13513513513510.48111819541689199.816045310516
Trimmed Mean ( 19 / 24 )96.20.463454329968322207.571693216407
Trimmed Mean ( 20 / 24 )96.24242424242420.450232059336474213.761819592014
Trimmed Mean ( 21 / 24 )96.29032258064520.430537419569624223.651460253790
Trimmed Mean ( 22 / 24 )96.31034482758620.4155341042712231.774826272091
Trimmed Mean ( 23 / 24 )96.29629629629630.405850430727848237.270405561969
Trimmed Mean ( 24 / 24 )96.280.389529630879774247.169900226964
Median96
Midrange89.5
Midmean - Weighted Average at Xnp95.5365853658537
Midmean - Weighted Average at X(n+1)p95.5365853658537
Midmean - Empirical Distribution Function95.5365853658537
Midmean - Empirical Distribution Function - Averaging95.5365853658537
Midmean - Empirical Distribution Function - Interpolation95.5365853658537
Midmean - Closest Observation95.5365853658537
Midmean - True Basic - Statistics Graphics Toolkit95.5365853658537
Midmean - MS Excel (old versions)95.5365853658537
Number of observations73

\begin{tabular}{lllllllll}
\hline
Central Tendency - Ungrouped Data \tabularnewline
Measure & Value & S.E. & Value/S.E. \tabularnewline
Arithmetic Mean & 94.958904109589 & 0.924353070117727 & 102.730122481764 \tabularnewline
Geometric Mean & 94.6145308224988 &  &  \tabularnewline
Harmonic Mean & 94.2477808321138 &  &  \tabularnewline
Quadratic Mean & 95.2822770968826 &  &  \tabularnewline
Winsorized Mean ( 1 / 24 ) & 94.972602739726 & 0.912865219074669 & 104.037924498860 \tabularnewline
Winsorized Mean ( 2 / 24 ) & 95 & 0.904285417153965 & 105.055326778343 \tabularnewline
Winsorized Mean ( 3 / 24 ) & 95.041095890411 & 0.873122764744577 & 108.851927504392 \tabularnewline
Winsorized Mean ( 4 / 24 ) & 95.2602739726027 & 0.814870216216743 & 116.90238773835 \tabularnewline
Winsorized Mean ( 5 / 24 ) & 95.3287671232877 & 0.798603898470108 & 119.369273435692 \tabularnewline
Winsorized Mean ( 6 / 24 ) & 95.4109589041096 & 0.748625228189967 & 127.448228180601 \tabularnewline
Winsorized Mean ( 7 / 24 ) & 95.4109589041096 & 0.748625228189967 & 127.448228180601 \tabularnewline
Winsorized Mean ( 8 / 24 ) & 95.4109589041096 & 0.70894363083682 & 134.581869071154 \tabularnewline
Winsorized Mean ( 9 / 24 ) & 95.6575342465753 & 0.661285122295119 & 144.653994202345 \tabularnewline
Winsorized Mean ( 10 / 24 ) & 95.6575342465753 & 0.661285122295119 & 144.653994202345 \tabularnewline
Winsorized Mean ( 11 / 24 ) & 95.5068493150685 & 0.639016584056987 & 149.459109040199 \tabularnewline
Winsorized Mean ( 12 / 24 ) & 95.6712328767123 & 0.609430827894382 & 156.984564117411 \tabularnewline
Winsorized Mean ( 13 / 24 ) & 95.8493150684932 & 0.579216139891731 & 165.481084636919 \tabularnewline
Winsorized Mean ( 14 / 24 ) & 96.041095890411 & 0.54877695624301 & 175.009345414063 \tabularnewline
Winsorized Mean ( 15 / 24 ) & 96.041095890411 & 0.54877695624301 & 175.009345414063 \tabularnewline
Winsorized Mean ( 16 / 24 ) & 95.8219178082192 & 0.516965764712582 & 185.354474800654 \tabularnewline
Winsorized Mean ( 17 / 24 ) & 95.8219178082192 & 0.516965764712582 & 185.354474800654 \tabularnewline
Winsorized Mean ( 18 / 24 ) & 95.5753424657534 & 0.484115179407459 & 197.42273436403 \tabularnewline
Winsorized Mean ( 19 / 24 ) & 95.8356164383562 & 0.443545670744086 & 216.067076649816 \tabularnewline
Winsorized Mean ( 20 / 24 ) & 95.8356164383562 & 0.443545670744086 & 216.067076649816 \tabularnewline
Winsorized Mean ( 21 / 24 ) & 96.1232876712329 & 0.40117085367136 & 239.606857755367 \tabularnewline
Winsorized Mean ( 22 / 24 ) & 96.4246575342466 & 0.359645208340787 & 268.110502511904 \tabularnewline
Winsorized Mean ( 23 / 24 ) & 96.4246575342466 & 0.359645208340787 & 268.110502511904 \tabularnewline
Winsorized Mean ( 24 / 24 ) & 96.4246575342466 & 0.359645208340787 & 268.110502511904 \tabularnewline
Trimmed Mean ( 1 / 24 ) & 95.112676056338 & 0.876372001848302 & 108.530025897383 \tabularnewline
Trimmed Mean ( 2 / 24 ) & 95.2608695652174 & 0.832434000802367 & 114.436543285591 \tabularnewline
Trimmed Mean ( 3 / 24 ) & 95.4029850746269 & 0.78488079148921 & 121.550923540392 \tabularnewline
Trimmed Mean ( 4 / 24 ) & 95.5384615384615 & 0.742292745963518 & 128.707254729332 \tabularnewline
Trimmed Mean ( 5 / 24 ) & 95.6190476190476 & 0.713927201374591 & 133.933890507244 \tabularnewline
Trimmed Mean ( 6 / 24 ) & 95.688524590164 & 0.684943850599105 & 139.702728196578 \tabularnewline
Trimmed Mean ( 7 / 24 ) & 95.7457627118644 & 0.664536778035912 & 144.078952251293 \tabularnewline
Trimmed Mean ( 8 / 24 ) & 95.8070175438596 & 0.639371654900139 & 149.845581688828 \tabularnewline
Trimmed Mean ( 9 / 24 ) & 95.8727272727273 & 0.618488733476532 & 155.011275199510 \tabularnewline
Trimmed Mean ( 10 / 24 ) & 95.9056603773585 & 0.604328935450781 & 158.697779886744 \tabularnewline
Trimmed Mean ( 11 / 24 ) & 95.9411764705882 & 0.586389260197696 & 163.613461198526 \tabularnewline
Trimmed Mean ( 12 / 24 ) & 96 & 0.568444589824444 & 168.881895823212 \tabularnewline
Trimmed Mean ( 13 / 24 ) & 96.0425531914894 & 0.552479439266914 & 173.839144709038 \tabularnewline
Trimmed Mean ( 14 / 24 ) & 96.0666666666667 & 0.538797763825195 & 178.298191114680 \tabularnewline
Trimmed Mean ( 15 / 24 ) & 96.0697674418605 & 0.527636394523027 & 182.075702963412 \tabularnewline
Trimmed Mean ( 16 / 24 ) & 96.0731707317073 & 0.512514418479437 & 187.454571554774 \tabularnewline
Trimmed Mean ( 17 / 24 ) & 96.102564102564 & 0.499385414180183 & 192.441672050697 \tabularnewline
Trimmed Mean ( 18 / 24 ) & 96.1351351351351 & 0.48111819541689 & 199.816045310516 \tabularnewline
Trimmed Mean ( 19 / 24 ) & 96.2 & 0.463454329968322 & 207.571693216407 \tabularnewline
Trimmed Mean ( 20 / 24 ) & 96.2424242424242 & 0.450232059336474 & 213.761819592014 \tabularnewline
Trimmed Mean ( 21 / 24 ) & 96.2903225806452 & 0.430537419569624 & 223.651460253790 \tabularnewline
Trimmed Mean ( 22 / 24 ) & 96.3103448275862 & 0.4155341042712 & 231.774826272091 \tabularnewline
Trimmed Mean ( 23 / 24 ) & 96.2962962962963 & 0.405850430727848 & 237.270405561969 \tabularnewline
Trimmed Mean ( 24 / 24 ) & 96.28 & 0.389529630879774 & 247.169900226964 \tabularnewline
Median & 96 &  &  \tabularnewline
Midrange & 89.5 &  &  \tabularnewline
Midmean - Weighted Average at Xnp & 95.5365853658537 &  &  \tabularnewline
Midmean - Weighted Average at X(n+1)p & 95.5365853658537 &  &  \tabularnewline
Midmean - Empirical Distribution Function & 95.5365853658537 &  &  \tabularnewline
Midmean - Empirical Distribution Function - Averaging & 95.5365853658537 &  &  \tabularnewline
Midmean - Empirical Distribution Function - Interpolation & 95.5365853658537 &  &  \tabularnewline
Midmean - Closest Observation & 95.5365853658537 &  &  \tabularnewline
Midmean - True Basic - Statistics Graphics Toolkit & 95.5365853658537 &  &  \tabularnewline
Midmean - MS Excel (old versions) & 95.5365853658537 &  &  \tabularnewline
Number of observations & 73 &  &  \tabularnewline
\hline
\end{tabular}
%Source: https://freestatistics.org/blog/index.php?pk=4938&T=1

[TABLE]
[ROW][C]Central Tendency - Ungrouped Data[/C][/ROW]
[ROW][C]Measure[/C][C]Value[/C][C]S.E.[/C][C]Value/S.E.[/C][/ROW]
[ROW][C]Arithmetic Mean[/C][C]94.958904109589[/C][C]0.924353070117727[/C][C]102.730122481764[/C][/ROW]
[ROW][C]Geometric Mean[/C][C]94.6145308224988[/C][C][/C][C][/C][/ROW]
[ROW][C]Harmonic Mean[/C][C]94.2477808321138[/C][C][/C][C][/C][/ROW]
[ROW][C]Quadratic Mean[/C][C]95.2822770968826[/C][C][/C][C][/C][/ROW]
[ROW][C]Winsorized Mean ( 1 / 24 )[/C][C]94.972602739726[/C][C]0.912865219074669[/C][C]104.037924498860[/C][/ROW]
[ROW][C]Winsorized Mean ( 2 / 24 )[/C][C]95[/C][C]0.904285417153965[/C][C]105.055326778343[/C][/ROW]
[ROW][C]Winsorized Mean ( 3 / 24 )[/C][C]95.041095890411[/C][C]0.873122764744577[/C][C]108.851927504392[/C][/ROW]
[ROW][C]Winsorized Mean ( 4 / 24 )[/C][C]95.2602739726027[/C][C]0.814870216216743[/C][C]116.90238773835[/C][/ROW]
[ROW][C]Winsorized Mean ( 5 / 24 )[/C][C]95.3287671232877[/C][C]0.798603898470108[/C][C]119.369273435692[/C][/ROW]
[ROW][C]Winsorized Mean ( 6 / 24 )[/C][C]95.4109589041096[/C][C]0.748625228189967[/C][C]127.448228180601[/C][/ROW]
[ROW][C]Winsorized Mean ( 7 / 24 )[/C][C]95.4109589041096[/C][C]0.748625228189967[/C][C]127.448228180601[/C][/ROW]
[ROW][C]Winsorized Mean ( 8 / 24 )[/C][C]95.4109589041096[/C][C]0.70894363083682[/C][C]134.581869071154[/C][/ROW]
[ROW][C]Winsorized Mean ( 9 / 24 )[/C][C]95.6575342465753[/C][C]0.661285122295119[/C][C]144.653994202345[/C][/ROW]
[ROW][C]Winsorized Mean ( 10 / 24 )[/C][C]95.6575342465753[/C][C]0.661285122295119[/C][C]144.653994202345[/C][/ROW]
[ROW][C]Winsorized Mean ( 11 / 24 )[/C][C]95.5068493150685[/C][C]0.639016584056987[/C][C]149.459109040199[/C][/ROW]
[ROW][C]Winsorized Mean ( 12 / 24 )[/C][C]95.6712328767123[/C][C]0.609430827894382[/C][C]156.984564117411[/C][/ROW]
[ROW][C]Winsorized Mean ( 13 / 24 )[/C][C]95.8493150684932[/C][C]0.579216139891731[/C][C]165.481084636919[/C][/ROW]
[ROW][C]Winsorized Mean ( 14 / 24 )[/C][C]96.041095890411[/C][C]0.54877695624301[/C][C]175.009345414063[/C][/ROW]
[ROW][C]Winsorized Mean ( 15 / 24 )[/C][C]96.041095890411[/C][C]0.54877695624301[/C][C]175.009345414063[/C][/ROW]
[ROW][C]Winsorized Mean ( 16 / 24 )[/C][C]95.8219178082192[/C][C]0.516965764712582[/C][C]185.354474800654[/C][/ROW]
[ROW][C]Winsorized Mean ( 17 / 24 )[/C][C]95.8219178082192[/C][C]0.516965764712582[/C][C]185.354474800654[/C][/ROW]
[ROW][C]Winsorized Mean ( 18 / 24 )[/C][C]95.5753424657534[/C][C]0.484115179407459[/C][C]197.42273436403[/C][/ROW]
[ROW][C]Winsorized Mean ( 19 / 24 )[/C][C]95.8356164383562[/C][C]0.443545670744086[/C][C]216.067076649816[/C][/ROW]
[ROW][C]Winsorized Mean ( 20 / 24 )[/C][C]95.8356164383562[/C][C]0.443545670744086[/C][C]216.067076649816[/C][/ROW]
[ROW][C]Winsorized Mean ( 21 / 24 )[/C][C]96.1232876712329[/C][C]0.40117085367136[/C][C]239.606857755367[/C][/ROW]
[ROW][C]Winsorized Mean ( 22 / 24 )[/C][C]96.4246575342466[/C][C]0.359645208340787[/C][C]268.110502511904[/C][/ROW]
[ROW][C]Winsorized Mean ( 23 / 24 )[/C][C]96.4246575342466[/C][C]0.359645208340787[/C][C]268.110502511904[/C][/ROW]
[ROW][C]Winsorized Mean ( 24 / 24 )[/C][C]96.4246575342466[/C][C]0.359645208340787[/C][C]268.110502511904[/C][/ROW]
[ROW][C]Trimmed Mean ( 1 / 24 )[/C][C]95.112676056338[/C][C]0.876372001848302[/C][C]108.530025897383[/C][/ROW]
[ROW][C]Trimmed Mean ( 2 / 24 )[/C][C]95.2608695652174[/C][C]0.832434000802367[/C][C]114.436543285591[/C][/ROW]
[ROW][C]Trimmed Mean ( 3 / 24 )[/C][C]95.4029850746269[/C][C]0.78488079148921[/C][C]121.550923540392[/C][/ROW]
[ROW][C]Trimmed Mean ( 4 / 24 )[/C][C]95.5384615384615[/C][C]0.742292745963518[/C][C]128.707254729332[/C][/ROW]
[ROW][C]Trimmed Mean ( 5 / 24 )[/C][C]95.6190476190476[/C][C]0.713927201374591[/C][C]133.933890507244[/C][/ROW]
[ROW][C]Trimmed Mean ( 6 / 24 )[/C][C]95.688524590164[/C][C]0.684943850599105[/C][C]139.702728196578[/C][/ROW]
[ROW][C]Trimmed Mean ( 7 / 24 )[/C][C]95.7457627118644[/C][C]0.664536778035912[/C][C]144.078952251293[/C][/ROW]
[ROW][C]Trimmed Mean ( 8 / 24 )[/C][C]95.8070175438596[/C][C]0.639371654900139[/C][C]149.845581688828[/C][/ROW]
[ROW][C]Trimmed Mean ( 9 / 24 )[/C][C]95.8727272727273[/C][C]0.618488733476532[/C][C]155.011275199510[/C][/ROW]
[ROW][C]Trimmed Mean ( 10 / 24 )[/C][C]95.9056603773585[/C][C]0.604328935450781[/C][C]158.697779886744[/C][/ROW]
[ROW][C]Trimmed Mean ( 11 / 24 )[/C][C]95.9411764705882[/C][C]0.586389260197696[/C][C]163.613461198526[/C][/ROW]
[ROW][C]Trimmed Mean ( 12 / 24 )[/C][C]96[/C][C]0.568444589824444[/C][C]168.881895823212[/C][/ROW]
[ROW][C]Trimmed Mean ( 13 / 24 )[/C][C]96.0425531914894[/C][C]0.552479439266914[/C][C]173.839144709038[/C][/ROW]
[ROW][C]Trimmed Mean ( 14 / 24 )[/C][C]96.0666666666667[/C][C]0.538797763825195[/C][C]178.298191114680[/C][/ROW]
[ROW][C]Trimmed Mean ( 15 / 24 )[/C][C]96.0697674418605[/C][C]0.527636394523027[/C][C]182.075702963412[/C][/ROW]
[ROW][C]Trimmed Mean ( 16 / 24 )[/C][C]96.0731707317073[/C][C]0.512514418479437[/C][C]187.454571554774[/C][/ROW]
[ROW][C]Trimmed Mean ( 17 / 24 )[/C][C]96.102564102564[/C][C]0.499385414180183[/C][C]192.441672050697[/C][/ROW]
[ROW][C]Trimmed Mean ( 18 / 24 )[/C][C]96.1351351351351[/C][C]0.48111819541689[/C][C]199.816045310516[/C][/ROW]
[ROW][C]Trimmed Mean ( 19 / 24 )[/C][C]96.2[/C][C]0.463454329968322[/C][C]207.571693216407[/C][/ROW]
[ROW][C]Trimmed Mean ( 20 / 24 )[/C][C]96.2424242424242[/C][C]0.450232059336474[/C][C]213.761819592014[/C][/ROW]
[ROW][C]Trimmed Mean ( 21 / 24 )[/C][C]96.2903225806452[/C][C]0.430537419569624[/C][C]223.651460253790[/C][/ROW]
[ROW][C]Trimmed Mean ( 22 / 24 )[/C][C]96.3103448275862[/C][C]0.4155341042712[/C][C]231.774826272091[/C][/ROW]
[ROW][C]Trimmed Mean ( 23 / 24 )[/C][C]96.2962962962963[/C][C]0.405850430727848[/C][C]237.270405561969[/C][/ROW]
[ROW][C]Trimmed Mean ( 24 / 24 )[/C][C]96.28[/C][C]0.389529630879774[/C][C]247.169900226964[/C][/ROW]
[ROW][C]Median[/C][C]96[/C][C][/C][C][/C][/ROW]
[ROW][C]Midrange[/C][C]89.5[/C][C][/C][C][/C][/ROW]
[ROW][C]Midmean - Weighted Average at Xnp[/C][C]95.5365853658537[/C][C][/C][C][/C][/ROW]
[ROW][C]Midmean - Weighted Average at X(n+1)p[/C][C]95.5365853658537[/C][C][/C][C][/C][/ROW]
[ROW][C]Midmean - Empirical Distribution Function[/C][C]95.5365853658537[/C][C][/C][C][/C][/ROW]
[ROW][C]Midmean - Empirical Distribution Function - Averaging[/C][C]95.5365853658537[/C][C][/C][C][/C][/ROW]
[ROW][C]Midmean - Empirical Distribution Function - Interpolation[/C][C]95.5365853658537[/C][C][/C][C][/C][/ROW]
[ROW][C]Midmean - Closest Observation[/C][C]95.5365853658537[/C][C][/C][C][/C][/ROW]
[ROW][C]Midmean - True Basic - Statistics Graphics Toolkit[/C][C]95.5365853658537[/C][C][/C][C][/C][/ROW]
[ROW][C]Midmean - MS Excel (old versions)[/C][C]95.5365853658537[/C][C][/C][C][/C][/ROW]
[ROW][C]Number of observations[/C][C]73[/C][C][/C][C][/C][/ROW]
[/TABLE]
Source: https://freestatistics.org/blog/index.php?pk=4938&T=1

Globally Unique Identifier (entire table): ba.freestatistics.org/blog/index.php?pk=4938&T=1

As an alternative you can also use a QR Code:  

The GUIDs for individual cells are displayed in the table below:

Central Tendency - Ungrouped Data
MeasureValueS.E.Value/S.E.
Arithmetic Mean94.9589041095890.924353070117727102.730122481764
Geometric Mean94.6145308224988
Harmonic Mean94.2477808321138
Quadratic Mean95.2822770968826
Winsorized Mean ( 1 / 24 )94.9726027397260.912865219074669104.037924498860
Winsorized Mean ( 2 / 24 )950.904285417153965105.055326778343
Winsorized Mean ( 3 / 24 )95.0410958904110.873122764744577108.851927504392
Winsorized Mean ( 4 / 24 )95.26027397260270.814870216216743116.90238773835
Winsorized Mean ( 5 / 24 )95.32876712328770.798603898470108119.369273435692
Winsorized Mean ( 6 / 24 )95.41095890410960.748625228189967127.448228180601
Winsorized Mean ( 7 / 24 )95.41095890410960.748625228189967127.448228180601
Winsorized Mean ( 8 / 24 )95.41095890410960.70894363083682134.581869071154
Winsorized Mean ( 9 / 24 )95.65753424657530.661285122295119144.653994202345
Winsorized Mean ( 10 / 24 )95.65753424657530.661285122295119144.653994202345
Winsorized Mean ( 11 / 24 )95.50684931506850.639016584056987149.459109040199
Winsorized Mean ( 12 / 24 )95.67123287671230.609430827894382156.984564117411
Winsorized Mean ( 13 / 24 )95.84931506849320.579216139891731165.481084636919
Winsorized Mean ( 14 / 24 )96.0410958904110.54877695624301175.009345414063
Winsorized Mean ( 15 / 24 )96.0410958904110.54877695624301175.009345414063
Winsorized Mean ( 16 / 24 )95.82191780821920.516965764712582185.354474800654
Winsorized Mean ( 17 / 24 )95.82191780821920.516965764712582185.354474800654
Winsorized Mean ( 18 / 24 )95.57534246575340.484115179407459197.42273436403
Winsorized Mean ( 19 / 24 )95.83561643835620.443545670744086216.067076649816
Winsorized Mean ( 20 / 24 )95.83561643835620.443545670744086216.067076649816
Winsorized Mean ( 21 / 24 )96.12328767123290.40117085367136239.606857755367
Winsorized Mean ( 22 / 24 )96.42465753424660.359645208340787268.110502511904
Winsorized Mean ( 23 / 24 )96.42465753424660.359645208340787268.110502511904
Winsorized Mean ( 24 / 24 )96.42465753424660.359645208340787268.110502511904
Trimmed Mean ( 1 / 24 )95.1126760563380.876372001848302108.530025897383
Trimmed Mean ( 2 / 24 )95.26086956521740.832434000802367114.436543285591
Trimmed Mean ( 3 / 24 )95.40298507462690.78488079148921121.550923540392
Trimmed Mean ( 4 / 24 )95.53846153846150.742292745963518128.707254729332
Trimmed Mean ( 5 / 24 )95.61904761904760.713927201374591133.933890507244
Trimmed Mean ( 6 / 24 )95.6885245901640.684943850599105139.702728196578
Trimmed Mean ( 7 / 24 )95.74576271186440.664536778035912144.078952251293
Trimmed Mean ( 8 / 24 )95.80701754385960.639371654900139149.845581688828
Trimmed Mean ( 9 / 24 )95.87272727272730.618488733476532155.011275199510
Trimmed Mean ( 10 / 24 )95.90566037735850.604328935450781158.697779886744
Trimmed Mean ( 11 / 24 )95.94117647058820.586389260197696163.613461198526
Trimmed Mean ( 12 / 24 )960.568444589824444168.881895823212
Trimmed Mean ( 13 / 24 )96.04255319148940.552479439266914173.839144709038
Trimmed Mean ( 14 / 24 )96.06666666666670.538797763825195178.298191114680
Trimmed Mean ( 15 / 24 )96.06976744186050.527636394523027182.075702963412
Trimmed Mean ( 16 / 24 )96.07317073170730.512514418479437187.454571554774
Trimmed Mean ( 17 / 24 )96.1025641025640.499385414180183192.441672050697
Trimmed Mean ( 18 / 24 )96.13513513513510.48111819541689199.816045310516
Trimmed Mean ( 19 / 24 )96.20.463454329968322207.571693216407
Trimmed Mean ( 20 / 24 )96.24242424242420.450232059336474213.761819592014
Trimmed Mean ( 21 / 24 )96.29032258064520.430537419569624223.651460253790
Trimmed Mean ( 22 / 24 )96.31034482758620.4155341042712231.774826272091
Trimmed Mean ( 23 / 24 )96.29629629629630.405850430727848237.270405561969
Trimmed Mean ( 24 / 24 )96.280.389529630879774247.169900226964
Median96
Midrange89.5
Midmean - Weighted Average at Xnp95.5365853658537
Midmean - Weighted Average at X(n+1)p95.5365853658537
Midmean - Empirical Distribution Function95.5365853658537
Midmean - Empirical Distribution Function - Averaging95.5365853658537
Midmean - Empirical Distribution Function - Interpolation95.5365853658537
Midmean - Closest Observation95.5365853658537
Midmean - True Basic - Statistics Graphics Toolkit95.5365853658537
Midmean - MS Excel (old versions)95.5365853658537
Number of observations73


Parameters (Session):
Parameters (R input):
R code (references can be found in the software module):
geomean <- function(x) {
return(exp(mean(log(x))))
}
harmean <- function(x) {
return(1/mean(1/x))
}
quamean <- function(x) {
return(sqrt(mean(x*x)))
}
winmean <- function(x) {
x <-sort(x[!is.na(x)])
n<-length(x)
denom <- 3
nodenom <- n/denom
if (nodenom>40) denom <- n/40
sqrtn = sqrt(n)
roundnodenom = floor(nodenom)
win <- array(NA,dim=c(roundnodenom,2))
for (j in 1:roundnodenom) {
win[j,1] <- (j*x[j+1]+sum(x[(j+1):(n-j)])+j*x[n-j])/n
win[j,2] <- sd(c(rep(x[j+1],j),x[(j+1):(n-j)],rep(x[n-j],j)))/sqrtn
}
return(win)
}
trimean <- function(x) {
x <-sort(x[!is.na(x)])
n<-length(x)
denom <- 3
nodenom <- n/denom
if (nodenom>40) denom <- n/40
sqrtn = sqrt(n)
roundnodenom = floor(nodenom)
tri <- array(NA,dim=c(roundnodenom,2))
for (j in 1:roundnodenom) {
tri[j,1] <- mean(x,trim=j/n)
tri[j,2] <- sd(x[(j+1):(n-j)]) / sqrt(n-j*2)
}
return(tri)
}
midrange <- function(x) {
return((max(x)+min(x))/2)
}
q1 <- function(data,n,p,i,f) {
np <- n*p;
i <<- floor(np)
f <<- np - i
qvalue <- (1-f)*data[i] + f*data[i+1]
}
q2 <- function(data,n,p,i,f) {
np <- (n+1)*p
i <<- floor(np)
f <<- np - i
qvalue <- (1-f)*data[i] + f*data[i+1]
}
q3 <- function(data,n,p,i,f) {
np <- n*p
i <<- floor(np)
f <<- np - i
if (f==0) {
qvalue <- data[i]
} else {
qvalue <- data[i+1]
}
}
q4 <- function(data,n,p,i,f) {
np <- n*p
i <<- floor(np)
f <<- np - i
if (f==0) {
qvalue <- (data[i]+data[i+1])/2
} else {
qvalue <- data[i+1]
}
}
q5 <- function(data,n,p,i,f) {
np <- (n-1)*p
i <<- floor(np)
f <<- np - i
if (f==0) {
qvalue <- data[i+1]
} else {
qvalue <- data[i+1] + f*(data[i+2]-data[i+1])
}
}
q6 <- function(data,n,p,i,f) {
np <- n*p+0.5
i <<- floor(np)
f <<- np - i
qvalue <- data[i]
}
q7 <- function(data,n,p,i,f) {
np <- (n+1)*p
i <<- floor(np)
f <<- np - i
if (f==0) {
qvalue <- data[i]
} else {
qvalue <- f*data[i] + (1-f)*data[i+1]
}
}
q8 <- function(data,n,p,i,f) {
np <- (n+1)*p
i <<- floor(np)
f <<- np - i
if (f==0) {
qvalue <- data[i]
} else {
if (f == 0.5) {
qvalue <- (data[i]+data[i+1])/2
} else {
if (f < 0.5) {
qvalue <- data[i]
} else {
qvalue <- data[i+1]
}
}
}
}
midmean <- function(x,def) {
x <-sort(x[!is.na(x)])
n<-length(x)
if (def==1) {
qvalue1 <- q1(x,n,0.25,i,f)
qvalue3 <- q1(x,n,0.75,i,f)
}
if (def==2) {
qvalue1 <- q2(x,n,0.25,i,f)
qvalue3 <- q2(x,n,0.75,i,f)
}
if (def==3) {
qvalue1 <- q3(x,n,0.25,i,f)
qvalue3 <- q3(x,n,0.75,i,f)
}
if (def==4) {
qvalue1 <- q4(x,n,0.25,i,f)
qvalue3 <- q4(x,n,0.75,i,f)
}
if (def==5) {
qvalue1 <- q5(x,n,0.25,i,f)
qvalue3 <- q5(x,n,0.75,i,f)
}
if (def==6) {
qvalue1 <- q6(x,n,0.25,i,f)
qvalue3 <- q6(x,n,0.75,i,f)
}
if (def==7) {
qvalue1 <- q7(x,n,0.25,i,f)
qvalue3 <- q7(x,n,0.75,i,f)
}
if (def==8) {
qvalue1 <- q8(x,n,0.25,i,f)
qvalue3 <- q8(x,n,0.75,i,f)
}
midm <- 0
myn <- 0
roundno4 <- round(n/4)
round3no4 <- round(3*n/4)
for (i in 1:n) {
if ((x[i]>=qvalue1) & (x[i]<=qvalue3)){
midm = midm + x[i]
myn = myn + 1
}
}
midm = midm / myn
return(midm)
}
(arm <- mean(x))
sqrtn <- sqrt(length(x))
(armse <- sd(x) / sqrtn)
(armose <- arm / armse)
(geo <- geomean(x))
(har <- harmean(x))
(qua <- quamean(x))
(win <- winmean(x))
(tri <- trimean(x))
(midr <- midrange(x))
midm <- array(NA,dim=8)
for (j in 1:8) midm[j] <- midmean(x,j)
midm
bitmap(file='test1.png')
lb <- win[,1] - 2*win[,2]
ub <- win[,1] + 2*win[,2]
if ((ylimmin == '') | (ylimmax == '')) plot(win[,1],type='b',main=main, xlab='j', pch=19, ylab='Winsorized Mean(j/n)', ylim=c(min(lb),max(ub))) else plot(win[,1],type='l',main=main, xlab='j', pch=19, ylab='Winsorized Mean(j/n)', ylim=c(ylimmin,ylimmax))
lines(ub,lty=3)
lines(lb,lty=3)
grid()
dev.off()
bitmap(file='test2.png')
lb <- tri[,1] - 2*tri[,2]
ub <- tri[,1] + 2*tri[,2]
if ((ylimmin == '') | (ylimmax == '')) plot(tri[,1],type='b',main=main, xlab='j', pch=19, ylab='Trimmed Mean(j/n)', ylim=c(min(lb),max(ub))) else plot(tri[,1],type='l',main=main, xlab='j', pch=19, ylab='Trimmed Mean(j/n)', ylim=c(ylimmin,ylimmax))
lines(ub,lty=3)
lines(lb,lty=3)
grid()
dev.off()
load(file='createtable')
a<-table.start()
a<-table.row.start(a)
a<-table.element(a,'Central Tendency - Ungrouped Data',4,TRUE)
a<-table.row.end(a)
a<-table.row.start(a)
a<-table.element(a,'Measure',header=TRUE)
a<-table.element(a,'Value',header=TRUE)
a<-table.element(a,'S.E.',header=TRUE)
a<-table.element(a,'Value/S.E.',header=TRUE)
a<-table.row.end(a)
a<-table.row.start(a)
a<-table.element(a,hyperlink('arithmetic_mean.htm', 'Arithmetic Mean', 'click to view the definition of the Arithmetic Mean'),header=TRUE)
a<-table.element(a,arm)
a<-table.element(a,hyperlink('arithmetic_mean_standard_error.htm', armse, 'click to view the definition of the Standard Error of the Arithmetic Mean'))
a<-table.element(a,armose)
a<-table.row.end(a)
a<-table.row.start(a)
a<-table.element(a,hyperlink('geometric_mean.htm', 'Geometric Mean', 'click to view the definition of the Geometric Mean'),header=TRUE)
a<-table.element(a,geo)
a<-table.element(a,'')
a<-table.row.end(a)
a<-table.row.start(a)
a<-table.element(a,hyperlink('harmonic_mean.htm', 'Harmonic Mean', 'click to view the definition of the Harmonic Mean'),header=TRUE)
a<-table.element(a,har)
a<-table.element(a,'')
a<-table.row.end(a)
a<-table.row.start(a)
a<-table.element(a,hyperlink('quadratic_mean.htm', 'Quadratic Mean', 'click to view the definition of the Quadratic Mean'),header=TRUE)
a<-table.element(a,qua)
a<-table.element(a,'')
a<-table.row.end(a)
for (j in 1:length(win[,1])) {
a<-table.row.start(a)
mylabel <- paste('Winsorized Mean (',j)
mylabel <- paste(mylabel,'/')
mylabel <- paste(mylabel,length(win[,1]))
mylabel <- paste(mylabel,')')
a<-table.element(a,hyperlink('winsorized_mean.htm', mylabel, 'click to view the definition of the Winsorized Mean'),header=TRUE)
a<-table.element(a,win[j,1])
a<-table.element(a,win[j,2])
a<-table.element(a,win[j,1]/win[j,2])
a<-table.row.end(a)
}
for (j in 1:length(tri[,1])) {
a<-table.row.start(a)
mylabel <- paste('Trimmed Mean (',j)
mylabel <- paste(mylabel,'/')
mylabel <- paste(mylabel,length(tri[,1]))
mylabel <- paste(mylabel,')')
a<-table.element(a,hyperlink('arithmetic_mean.htm', mylabel, 'click to view the definition of the Trimmed Mean'),header=TRUE)
a<-table.element(a,tri[j,1])
a<-table.element(a,tri[j,2])
a<-table.element(a,tri[j,1]/tri[j,2])
a<-table.row.end(a)
}
a<-table.row.start(a)
a<-table.element(a,hyperlink('median_1.htm', 'Median', 'click to view the definition of the Median'),header=TRUE)
a<-table.element(a,median(x))
a<-table.element(a,'')
a<-table.row.end(a)
a<-table.row.start(a)
a<-table.element(a,hyperlink('midrange.htm', 'Midrange', 'click to view the definition of the Midrange'),header=TRUE)
a<-table.element(a,midr)
a<-table.element(a,'')
a<-table.row.end(a)
a<-table.row.start(a)
mymid <- hyperlink('midmean.htm', 'Midmean', 'click to view the definition of the Midmean')
mylabel <- paste(mymid,hyperlink('method_1.htm','Weighted Average at Xnp',''),sep=' - ')
a<-table.element(a,mylabel,header=TRUE)
a<-table.element(a,midm[1])
a<-table.element(a,'')
a<-table.row.end(a)
a<-table.row.start(a)
mymid <- hyperlink('midmean.htm', 'Midmean', 'click to view the definition of the Midmean')
mylabel <- paste(mymid,hyperlink('method_2.htm','Weighted Average at X(n+1)p',''),sep=' - ')
a<-table.element(a,mylabel,header=TRUE)
a<-table.element(a,midm[2])
a<-table.element(a,'')
a<-table.row.end(a)
a<-table.row.start(a)
mymid <- hyperlink('midmean.htm', 'Midmean', 'click to view the definition of the Midmean')
mylabel <- paste(mymid,hyperlink('method_3.htm','Empirical Distribution Function',''),sep=' - ')
a<-table.element(a,mylabel,header=TRUE)
a<-table.element(a,midm[3])
a<-table.element(a,'')
a<-table.row.end(a)
a<-table.row.start(a)
mymid <- hyperlink('midmean.htm', 'Midmean', 'click to view the definition of the Midmean')
mylabel <- paste(mymid,hyperlink('method_4.htm','Empirical Distribution Function - Averaging',''),sep=' - ')
a<-table.element(a,mylabel,header=TRUE)
a<-table.element(a,midm[4])
a<-table.element(a,'')
a<-table.row.end(a)
a<-table.row.start(a)
mymid <- hyperlink('midmean.htm', 'Midmean', 'click to view the definition of the Midmean')
mylabel <- paste(mymid,hyperlink('method_5.htm','Empirical Distribution Function - Interpolation',''),sep=' - ')
a<-table.element(a,mylabel,header=TRUE)
a<-table.element(a,midm[5])
a<-table.element(a,'')
a<-table.row.end(a)
a<-table.row.start(a)
mymid <- hyperlink('midmean.htm', 'Midmean', 'click to view the definition of the Midmean')
mylabel <- paste(mymid,hyperlink('method_6.htm','Closest Observation',''),sep=' - ')
a<-table.element(a,mylabel,header=TRUE)
a<-table.element(a,midm[6])
a<-table.element(a,'')
a<-table.row.end(a)
a<-table.row.start(a)
mymid <- hyperlink('midmean.htm', 'Midmean', 'click to view the definition of the Midmean')
mylabel <- paste(mymid,hyperlink('method_7.htm','True Basic - Statistics Graphics Toolkit',''),sep=' - ')
a<-table.element(a,mylabel,header=TRUE)
a<-table.element(a,midm[7])
a<-table.element(a,'')
a<-table.row.end(a)
a<-table.row.start(a)
mymid <- hyperlink('midmean.htm', 'Midmean', 'click to view the definition of the Midmean')
mylabel <- paste(mymid,hyperlink('method_8.htm','MS Excel (old versions)',''),sep=' - ')
a<-table.element(a,mylabel,header=TRUE)
a<-table.element(a,midm[8])
a<-table.element(a,'')
a<-table.row.end(a)
a<-table.row.start(a)
a<-table.element(a,'Number of observations',header=TRUE)
a<-table.element(a,length(x))
a<-table.element(a,'')
a<-table.row.end(a)
a<-table.end(a)
table.save(a,file='mytable.tab')