Free Statistics

of Irreproducible Research!

Author's title

Author*Unverified author*
R Software Modulerwasp_autocorrelation.wasp
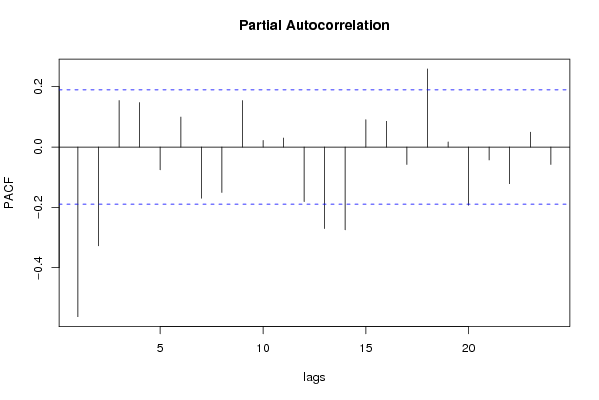
Title produced by software(Partial) Autocorrelation Function
Date of computationSun, 30 Dec 2007 07:21:21 -0700
Cite this page as followsStatistical Computations at FreeStatistics.org, Office for Research Development and Education, URL https://freestatistics.org/blog/index.php?v=date/2007/Dec/30/t119902321542bxw0yycsbrkkr.htm/, Retrieved Sat, 04 May 2024 06:55:57 +0000
Statistical Computations at FreeStatistics.org, Office for Research Development and Education, URL https://freestatistics.org/blog/index.php?pk=4930, Retrieved Sat, 04 May 2024 06:55:57 +0000
QR Codes:

Original text written by user:
IsPrivate?No (this computation is public)
User-defined keywords
Estimated Impact294
Family? (F = Feedback message, R = changed R code, M = changed R Module, P = changed Parameters, D = changed Data)
-       [(Partial) Autocorrelation Function] [PAPER-ACF] [2007-12-30 14:21:21] [6bdd947de0ee04552c8f0fc807f31807] [Current]
Feedback Forum

Post a new message
Dataseries X:
7272.2
6680.1
8427.6
8752.8
7952.7
8694.3
7787
8474.2
9154.7
8557.2
7951.1
9156.7
7865.7
7337.4
9131.7
8814.6
8598.8
8439.6
7451.8
8016.2
9544.1
8270.7
8102.2
9369
7657.7
7816.6
9391.3
9445.4
9533.1
10068.7
8955.5
10423.9
11617.2
9391.1
10872
10230.4
9221
9428.6
10934.5
10986
11724.6
11180.9
11163.2
11240.9
12107.1
10762.3
11340.4
11266.8
9542.7
9227.7
10571.9
10774.4
10392.8
9920.2
9884.9
10174.5
11395.4
10760.2
10570.1
10536
9902.6
8889
10837.3
11624.1
10509
10984.9
10649.1
10855.7
11677.4
10760.2
10046.2
10772.8
9987.7
8638.7
11063.7
11855.7
10684.5
11337.4
10478
11123.9
12909.3
11339.9
10462.2
12733.5
10519.2
10414.9
12476.8
12384.6
12266.7
12919.9
11497.3
12142
13919.4
12656.8
12034.1
13199.7
10881.3
11301.2
13643.9
12517
13981.1
14275.7
13435
13565.7
16216.3
12970
14079.9
14235
12213.4
12581
14130.4
14210.8
14378.5
13142.8
13714.7
13621.9
15379.8
13306.3
14391.2
14909.9


Summary of compuational transaction
Raw Inputview raw input (R code)
Raw Outputview raw output of R engine
Computing time3 seconds
R Server'Herman Ole Andreas Wold' @ 193.190.124.10:1001

\begin{tabular}{lllllllll}
\hline
Summary of compuational transaction \tabularnewline
Raw Input & view raw input (R code)  \tabularnewline
Raw Output & view raw output of R engine  \tabularnewline
Computing time & 3 seconds \tabularnewline
R Server & 'Herman Ole Andreas Wold' @ 193.190.124.10:1001 \tabularnewline
\hline
\end{tabular}
%Source: https://freestatistics.org/blog/index.php?pk=4930&T=0

[TABLE]
[ROW][C]Summary of compuational transaction[/C][/ROW]
[ROW][C]Raw Input[/C][C]view raw input (R code) [/C][/ROW]
[ROW][C]Raw Output[/C][C]view raw output of R engine [/C][/ROW]
[ROW][C]Computing time[/C][C]3 seconds[/C][/ROW]
[ROW][C]R Server[/C][C]'Herman Ole Andreas Wold' @ 193.190.124.10:1001[/C][/ROW]
[/TABLE]
Source: https://freestatistics.org/blog/index.php?pk=4930&T=0

Globally Unique Identifier (entire table): ba.freestatistics.org/blog/index.php?pk=4930&T=0

As an alternative you can also use a QR Code:  

The GUIDs for individual cells are displayed in the table below:

Summary of compuational transaction
Raw Inputview raw input (R code)
Raw Outputview raw output of R engine
Computing time3 seconds
R Server'Herman Ole Andreas Wold' @ 193.190.124.10:1001


Autocorrelation Function
Time lag kACF(k)T-STATP-value
0110.34410
1-0.562216-5.81561
20.092140.95310.171342
30.2095432.16750.016206
4-0.164183-1.69830.953824
5-0.023096-0.23890.594183
60.2023822.09350.019336
7-0.304366-3.14840.998936
80.1461171.51140.066811
90.1265561.30910.096652
10-0.261269-2.70260.995998
110.1967612.03530.022146
12-0.11267-1.16550.87679
13-0.109062-1.12810.869109
140.0791790.8190.207294
150.0532810.55110.291341
16-0.222071-2.29710.988221
170.1772771.83380.034734
180.1108571.14670.127029
19-0.236472-2.44610.991964
200.1699731.75820.040785
210.0040620.0420.483283
22-0.195657-2.02390.977263
230.2448572.53280.006383

\begin{tabular}{lllllllll}
\hline
Autocorrelation Function \tabularnewline
Time lag k & ACF(k) & T-STAT & P-value \tabularnewline
0 & 1 & 10.3441 & 0 \tabularnewline
1 & -0.562216 & -5.8156 & 1 \tabularnewline
2 & 0.09214 & 0.9531 & 0.171342 \tabularnewline
3 & 0.209543 & 2.1675 & 0.016206 \tabularnewline
4 & -0.164183 & -1.6983 & 0.953824 \tabularnewline
5 & -0.023096 & -0.2389 & 0.594183 \tabularnewline
6 & 0.202382 & 2.0935 & 0.019336 \tabularnewline
7 & -0.304366 & -3.1484 & 0.998936 \tabularnewline
8 & 0.146117 & 1.5114 & 0.066811 \tabularnewline
9 & 0.126556 & 1.3091 & 0.096652 \tabularnewline
10 & -0.261269 & -2.7026 & 0.995998 \tabularnewline
11 & 0.196761 & 2.0353 & 0.022146 \tabularnewline
12 & -0.11267 & -1.1655 & 0.87679 \tabularnewline
13 & -0.109062 & -1.1281 & 0.869109 \tabularnewline
14 & 0.079179 & 0.819 & 0.207294 \tabularnewline
15 & 0.053281 & 0.5511 & 0.291341 \tabularnewline
16 & -0.222071 & -2.2971 & 0.988221 \tabularnewline
17 & 0.177277 & 1.8338 & 0.034734 \tabularnewline
18 & 0.110857 & 1.1467 & 0.127029 \tabularnewline
19 & -0.236472 & -2.4461 & 0.991964 \tabularnewline
20 & 0.169973 & 1.7582 & 0.040785 \tabularnewline
21 & 0.004062 & 0.042 & 0.483283 \tabularnewline
22 & -0.195657 & -2.0239 & 0.977263 \tabularnewline
23 & 0.244857 & 2.5328 & 0.006383 \tabularnewline
\hline
\end{tabular}
%Source: https://freestatistics.org/blog/index.php?pk=4930&T=1

[TABLE]
[ROW][C]Autocorrelation Function[/C][/ROW]
[ROW][C]Time lag k[/C][C]ACF(k)[/C][C]T-STAT[/C][C]P-value[/C][/ROW]
[ROW][C]0[/C][C]1[/C][C]10.3441[/C][C]0[/C][/ROW]
[ROW][C]1[/C][C]-0.562216[/C][C]-5.8156[/C][C]1[/C][/ROW]
[ROW][C]2[/C][C]0.09214[/C][C]0.9531[/C][C]0.171342[/C][/ROW]
[ROW][C]3[/C][C]0.209543[/C][C]2.1675[/C][C]0.016206[/C][/ROW]
[ROW][C]4[/C][C]-0.164183[/C][C]-1.6983[/C][C]0.953824[/C][/ROW]
[ROW][C]5[/C][C]-0.023096[/C][C]-0.2389[/C][C]0.594183[/C][/ROW]
[ROW][C]6[/C][C]0.202382[/C][C]2.0935[/C][C]0.019336[/C][/ROW]
[ROW][C]7[/C][C]-0.304366[/C][C]-3.1484[/C][C]0.998936[/C][/ROW]
[ROW][C]8[/C][C]0.146117[/C][C]1.5114[/C][C]0.066811[/C][/ROW]
[ROW][C]9[/C][C]0.126556[/C][C]1.3091[/C][C]0.096652[/C][/ROW]
[ROW][C]10[/C][C]-0.261269[/C][C]-2.7026[/C][C]0.995998[/C][/ROW]
[ROW][C]11[/C][C]0.196761[/C][C]2.0353[/C][C]0.022146[/C][/ROW]
[ROW][C]12[/C][C]-0.11267[/C][C]-1.1655[/C][C]0.87679[/C][/ROW]
[ROW][C]13[/C][C]-0.109062[/C][C]-1.1281[/C][C]0.869109[/C][/ROW]
[ROW][C]14[/C][C]0.079179[/C][C]0.819[/C][C]0.207294[/C][/ROW]
[ROW][C]15[/C][C]0.053281[/C][C]0.5511[/C][C]0.291341[/C][/ROW]
[ROW][C]16[/C][C]-0.222071[/C][C]-2.2971[/C][C]0.988221[/C][/ROW]
[ROW][C]17[/C][C]0.177277[/C][C]1.8338[/C][C]0.034734[/C][/ROW]
[ROW][C]18[/C][C]0.110857[/C][C]1.1467[/C][C]0.127029[/C][/ROW]
[ROW][C]19[/C][C]-0.236472[/C][C]-2.4461[/C][C]0.991964[/C][/ROW]
[ROW][C]20[/C][C]0.169973[/C][C]1.7582[/C][C]0.040785[/C][/ROW]
[ROW][C]21[/C][C]0.004062[/C][C]0.042[/C][C]0.483283[/C][/ROW]
[ROW][C]22[/C][C]-0.195657[/C][C]-2.0239[/C][C]0.977263[/C][/ROW]
[ROW][C]23[/C][C]0.244857[/C][C]2.5328[/C][C]0.006383[/C][/ROW]
[/TABLE]
Source: https://freestatistics.org/blog/index.php?pk=4930&T=1

Globally Unique Identifier (entire table): ba.freestatistics.org/blog/index.php?pk=4930&T=1

As an alternative you can also use a QR Code:  

The GUIDs for individual cells are displayed in the table below:

Autocorrelation Function
Time lag kACF(k)T-STATP-value
0110.34410
1-0.562216-5.81561
20.092140.95310.171342
30.2095432.16750.016206
4-0.164183-1.69830.953824
5-0.023096-0.23890.594183
60.2023822.09350.019336
7-0.304366-3.14840.998936
80.1461171.51140.066811
90.1265561.30910.096652
10-0.261269-2.70260.995998
110.1967612.03530.022146
12-0.11267-1.16550.87679
13-0.109062-1.12810.869109
140.0791790.8190.207294
150.0532810.55110.291341
16-0.222071-2.29710.988221
170.1772771.83380.034734
180.1108571.14670.127029
19-0.236472-2.44610.991964
200.1699731.75820.040785
210.0040620.0420.483283
22-0.195657-2.02390.977263
230.2448572.53280.006383


Partial Autocorrelation Function
Time lag kPACF(k)T-STATP-value
0-0.562216-5.81561
1-0.327449-3.38720.999506
20.1542981.59610.056711
30.1475131.52590.064995
4-0.075269-0.77860.781029
50.0993391.02760.153236
6-0.169506-1.75340.9588
7-0.150444-1.55620.938694
80.1541841.59490.056843
90.0220360.22790.410064
100.0300380.31070.378309
11-0.180815-1.87040.967917
12-0.270054-2.79350.99691
13-0.2745-2.83950.997295
140.0905690.93680.175473
150.0853910.88330.189529
16-0.057516-0.5950.723435
170.2589492.67860.00428
180.017060.17650.430128
19-0.192493-1.99120.975494
20-0.042629-0.4410.669932
21-0.121532-1.25710.894279
220.0491470.50840.306117
23-0.057747-0.59730.72423

\begin{tabular}{lllllllll}
\hline
Partial Autocorrelation Function \tabularnewline
Time lag k & PACF(k) & T-STAT & P-value \tabularnewline
0 & -0.562216 & -5.8156 & 1 \tabularnewline
1 & -0.327449 & -3.3872 & 0.999506 \tabularnewline
2 & 0.154298 & 1.5961 & 0.056711 \tabularnewline
3 & 0.147513 & 1.5259 & 0.064995 \tabularnewline
4 & -0.075269 & -0.7786 & 0.781029 \tabularnewline
5 & 0.099339 & 1.0276 & 0.153236 \tabularnewline
6 & -0.169506 & -1.7534 & 0.9588 \tabularnewline
7 & -0.150444 & -1.5562 & 0.938694 \tabularnewline
8 & 0.154184 & 1.5949 & 0.056843 \tabularnewline
9 & 0.022036 & 0.2279 & 0.410064 \tabularnewline
10 & 0.030038 & 0.3107 & 0.378309 \tabularnewline
11 & -0.180815 & -1.8704 & 0.967917 \tabularnewline
12 & -0.270054 & -2.7935 & 0.99691 \tabularnewline
13 & -0.2745 & -2.8395 & 0.997295 \tabularnewline
14 & 0.090569 & 0.9368 & 0.175473 \tabularnewline
15 & 0.085391 & 0.8833 & 0.189529 \tabularnewline
16 & -0.057516 & -0.595 & 0.723435 \tabularnewline
17 & 0.258949 & 2.6786 & 0.00428 \tabularnewline
18 & 0.01706 & 0.1765 & 0.430128 \tabularnewline
19 & -0.192493 & -1.9912 & 0.975494 \tabularnewline
20 & -0.042629 & -0.441 & 0.669932 \tabularnewline
21 & -0.121532 & -1.2571 & 0.894279 \tabularnewline
22 & 0.049147 & 0.5084 & 0.306117 \tabularnewline
23 & -0.057747 & -0.5973 & 0.72423 \tabularnewline
\hline
\end{tabular}
%Source: https://freestatistics.org/blog/index.php?pk=4930&T=2

[TABLE]
[ROW][C]Partial Autocorrelation Function[/C][/ROW]
[ROW][C]Time lag k[/C][C]PACF(k)[/C][C]T-STAT[/C][C]P-value[/C][/ROW]
[ROW][C]0[/C][C]-0.562216[/C][C]-5.8156[/C][C]1[/C][/ROW]
[ROW][C]1[/C][C]-0.327449[/C][C]-3.3872[/C][C]0.999506[/C][/ROW]
[ROW][C]2[/C][C]0.154298[/C][C]1.5961[/C][C]0.056711[/C][/ROW]
[ROW][C]3[/C][C]0.147513[/C][C]1.5259[/C][C]0.064995[/C][/ROW]
[ROW][C]4[/C][C]-0.075269[/C][C]-0.7786[/C][C]0.781029[/C][/ROW]
[ROW][C]5[/C][C]0.099339[/C][C]1.0276[/C][C]0.153236[/C][/ROW]
[ROW][C]6[/C][C]-0.169506[/C][C]-1.7534[/C][C]0.9588[/C][/ROW]
[ROW][C]7[/C][C]-0.150444[/C][C]-1.5562[/C][C]0.938694[/C][/ROW]
[ROW][C]8[/C][C]0.154184[/C][C]1.5949[/C][C]0.056843[/C][/ROW]
[ROW][C]9[/C][C]0.022036[/C][C]0.2279[/C][C]0.410064[/C][/ROW]
[ROW][C]10[/C][C]0.030038[/C][C]0.3107[/C][C]0.378309[/C][/ROW]
[ROW][C]11[/C][C]-0.180815[/C][C]-1.8704[/C][C]0.967917[/C][/ROW]
[ROW][C]12[/C][C]-0.270054[/C][C]-2.7935[/C][C]0.99691[/C][/ROW]
[ROW][C]13[/C][C]-0.2745[/C][C]-2.8395[/C][C]0.997295[/C][/ROW]
[ROW][C]14[/C][C]0.090569[/C][C]0.9368[/C][C]0.175473[/C][/ROW]
[ROW][C]15[/C][C]0.085391[/C][C]0.8833[/C][C]0.189529[/C][/ROW]
[ROW][C]16[/C][C]-0.057516[/C][C]-0.595[/C][C]0.723435[/C][/ROW]
[ROW][C]17[/C][C]0.258949[/C][C]2.6786[/C][C]0.00428[/C][/ROW]
[ROW][C]18[/C][C]0.01706[/C][C]0.1765[/C][C]0.430128[/C][/ROW]
[ROW][C]19[/C][C]-0.192493[/C][C]-1.9912[/C][C]0.975494[/C][/ROW]
[ROW][C]20[/C][C]-0.042629[/C][C]-0.441[/C][C]0.669932[/C][/ROW]
[ROW][C]21[/C][C]-0.121532[/C][C]-1.2571[/C][C]0.894279[/C][/ROW]
[ROW][C]22[/C][C]0.049147[/C][C]0.5084[/C][C]0.306117[/C][/ROW]
[ROW][C]23[/C][C]-0.057747[/C][C]-0.5973[/C][C]0.72423[/C][/ROW]
[/TABLE]
Source: https://freestatistics.org/blog/index.php?pk=4930&T=2

Globally Unique Identifier (entire table): ba.freestatistics.org/blog/index.php?pk=4930&T=2

As an alternative you can also use a QR Code:  

The GUIDs for individual cells are displayed in the table below:

Partial Autocorrelation Function
Time lag kPACF(k)T-STATP-value
0-0.562216-5.81561
1-0.327449-3.38720.999506
20.1542981.59610.056711
30.1475131.52590.064995
4-0.075269-0.77860.781029
50.0993391.02760.153236
6-0.169506-1.75340.9588
7-0.150444-1.55620.938694
80.1541841.59490.056843
90.0220360.22790.410064
100.0300380.31070.378309
11-0.180815-1.87040.967917
12-0.270054-2.79350.99691
13-0.2745-2.83950.997295
140.0905690.93680.175473
150.0853910.88330.189529
16-0.057516-0.5950.723435
170.2589492.67860.00428
180.017060.17650.430128
19-0.192493-1.99120.975494
20-0.042629-0.4410.669932
21-0.121532-1.25710.894279
220.0491470.50840.306117
23-0.057747-0.59730.72423


Parameters (Session):
par1 = 24 ; par2 = 1 ; par3 = 1 ; par4 = 1 ; par5 = 12 ;
Parameters (R input):
par1 = 24 ; par2 = 1 ; par3 = 1 ; par4 = 1 ; par5 = 12 ;
R code (references can be found in the software module):
if (par1 == 'Default') {
par1 = 10*log10(length(x))
} else {
par1 <- as.numeric(par1)
}
par2 <- as.numeric(par2)
par3 <- as.numeric(par3)
par4 <- as.numeric(par4)
par5 <- as.numeric(par5)
if (par2 == 0) {
x <- log(x)
} else {
x <- (x ^ par2 - 1) / par2
}
if (par3 > 0) x <- diff(x,lag=1,difference=par3)
if (par4 > 0) x <- diff(x,lag=par5,difference=par4)
bitmap(file='pic1.png')
racf <- acf(x,par1,main='Autocorrelation',xlab='lags',ylab='ACF')
dev.off()
bitmap(file='pic2.png')
rpacf <- pacf(x,par1,main='Partial Autocorrelation',xlab='lags',ylab='PACF')
dev.off()
(myacf <- c(racf$acf))
(mypacf <- c(rpacf$acf))
lengthx <- length(x)
sqrtn <- sqrt(lengthx)
load(file='createtable')
a<-table.start()
a<-table.row.start(a)
a<-table.element(a,'Autocorrelation Function',4,TRUE)
a<-table.row.end(a)
a<-table.row.start(a)
a<-table.element(a,'Time lag k',header=TRUE)
a<-table.element(a,hyperlink('basics.htm','ACF(k)','click here for more information about the Autocorrelation Function'),header=TRUE)
a<-table.element(a,'T-STAT',header=TRUE)
a<-table.element(a,'P-value',header=TRUE)
a<-table.row.end(a)
for (i in 1:par1) {
a<-table.row.start(a)
a<-table.element(a,i-1,header=TRUE)
a<-table.element(a,round(myacf[i],6))
mytstat <- myacf[i]*sqrtn
a<-table.element(a,round(mytstat,4))
a<-table.element(a,round(1-pt(mytstat,lengthx),6))
a<-table.row.end(a)
}
a<-table.end(a)
table.save(a,file='mytable.tab')
a<-table.start()
a<-table.row.start(a)
a<-table.element(a,'Partial Autocorrelation Function',4,TRUE)
a<-table.row.end(a)
a<-table.row.start(a)
a<-table.element(a,'Time lag k',header=TRUE)
a<-table.element(a,hyperlink('basics.htm','PACF(k)','click here for more information about the Partial Autocorrelation Function'),header=TRUE)
a<-table.element(a,'T-STAT',header=TRUE)
a<-table.element(a,'P-value',header=TRUE)
a<-table.row.end(a)
for (i in 1:par1) {
a<-table.row.start(a)
a<-table.element(a,i-1,header=TRUE)
a<-table.element(a,round(mypacf[i],6))
mytstat <- mypacf[i]*sqrtn
a<-table.element(a,round(mytstat,4))
a<-table.element(a,round(1-pt(mytstat,lengthx),6))
a<-table.row.end(a)
}
a<-table.end(a)
table.save(a,file='mytable1.tab')