Free Statistics

of Irreproducible Research!

Author's title

Author*Unverified author*
R Software Modulerwasp_smp.wasp
Title produced by softwareStandard Deviation-Mean Plot
Date of computationSat, 29 Dec 2007 11:04:26 -0700
Cite this page as followsStatistical Computations at FreeStatistics.org, Office for Research Development and Education, URL https://freestatistics.org/blog/index.php?v=date/2007/Dec/29/t1198950235fjjabn7dky65ti5.htm/, Retrieved Sat, 27 Apr 2024 12:30:11 +0000
Statistical Computations at FreeStatistics.org, Office for Research Development and Education, URL https://freestatistics.org/blog/index.php?pk=4919, Retrieved Sat, 27 Apr 2024 12:30:11 +0000
QR Codes:

Original text written by user:
IsPrivate?No (this computation is public)
User-defined keywords
Estimated Impact288
Family? (F = Feedback message, R = changed R code, M = changed R Module, P = changed Parameters, D = changed Data)
-       [Standard Deviation-Mean Plot] [] [2007-12-29 18:04:26] [5ab9c9a9553a1280610271cc4d1472e3] [Current]
Feedback Forum

Post a new message
Dataseries X:
163414
163652
164603
165257
168731
171848
175032
179187
187369
194147
200145
203750
206464
205034
211782
244562
247059
255703
260218
268852
279436
281514
285458
288338
296369
302221
311016


Summary of compuational transaction
Raw Inputview raw input (R code)
Raw Outputview raw output of R engine
Computing time3 seconds
R Server'Herman Ole Andreas Wold' @ 193.190.124.10:1001

\begin{tabular}{lllllllll}
\hline
Summary of compuational transaction \tabularnewline
Raw Input & view raw input (R code)  \tabularnewline
Raw Output & view raw output of R engine  \tabularnewline
Computing time & 3 seconds \tabularnewline
R Server & 'Herman Ole Andreas Wold' @ 193.190.124.10:1001 \tabularnewline
\hline
\end{tabular}
%Source: https://freestatistics.org/blog/index.php?pk=4919&T=0

[TABLE]
[ROW][C]Summary of compuational transaction[/C][/ROW]
[ROW][C]Raw Input[/C][C]view raw input (R code) [/C][/ROW]
[ROW][C]Raw Output[/C][C]view raw output of R engine [/C][/ROW]
[ROW][C]Computing time[/C][C]3 seconds[/C][/ROW]
[ROW][C]R Server[/C][C]'Herman Ole Andreas Wold' @ 193.190.124.10:1001[/C][/ROW]
[/TABLE]
Source: https://freestatistics.org/blog/index.php?pk=4919&T=0

Globally Unique Identifier (entire table): ba.freestatistics.org/blog/index.php?pk=4919&T=0

As an alternative you can also use a QR Code:  

The GUIDs for individual cells are displayed in the table below:

Summary of compuational transaction
Raw Inputview raw input (R code)
Raw Outputview raw output of R engine
Computing time3 seconds
R Server'Herman Ole Andreas Wold' @ 193.190.124.10:1001


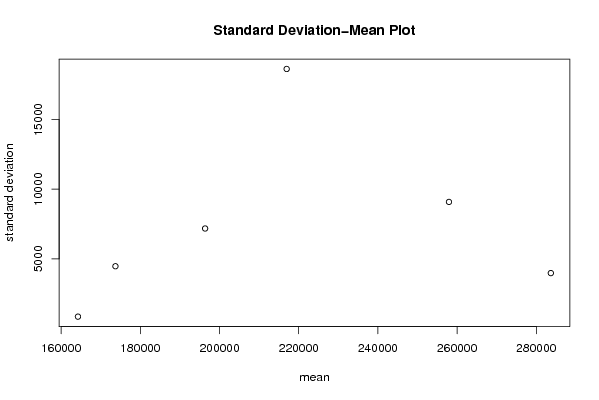
Standard Deviation-Mean Plot
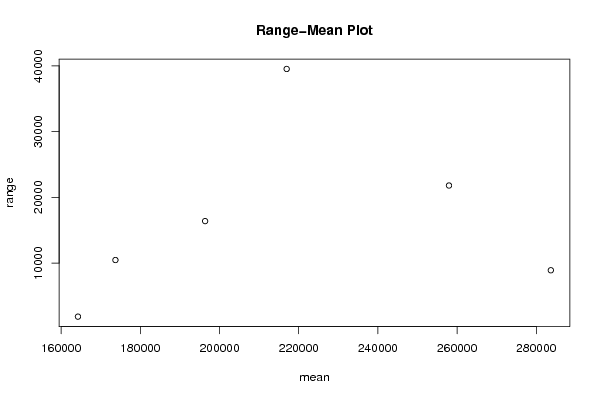
SectionMeanStandard DeviationRange
1164231.5855.1391699600721843
2173699.54472.2200676323310456
3196352.757180.3798588004116381
4216960.518628.630107087039528
52579589085.8876286249521793
6283686.53981.673475646478902

\begin{tabular}{lllllllll}
\hline
Standard Deviation-Mean Plot \tabularnewline
Section & Mean & Standard Deviation & Range \tabularnewline
1 & 164231.5 & 855.139169960072 & 1843 \tabularnewline
2 & 173699.5 & 4472.22006763233 & 10456 \tabularnewline
3 & 196352.75 & 7180.37985880041 & 16381 \tabularnewline
4 & 216960.5 & 18628.6301070870 & 39528 \tabularnewline
5 & 257958 & 9085.88762862495 & 21793 \tabularnewline
6 & 283686.5 & 3981.67347564647 & 8902 \tabularnewline
\hline
\end{tabular}
%Source: https://freestatistics.org/blog/index.php?pk=4919&T=1

[TABLE]
[ROW][C]Standard Deviation-Mean Plot[/C][/ROW]
[ROW][C]Section[/C][C]Mean[/C][C]Standard Deviation[/C][C]Range[/C][/ROW]
[ROW][C]1[/C][C]164231.5[/C][C]855.139169960072[/C][C]1843[/C][/ROW]
[ROW][C]2[/C][C]173699.5[/C][C]4472.22006763233[/C][C]10456[/C][/ROW]
[ROW][C]3[/C][C]196352.75[/C][C]7180.37985880041[/C][C]16381[/C][/ROW]
[ROW][C]4[/C][C]216960.5[/C][C]18628.6301070870[/C][C]39528[/C][/ROW]
[ROW][C]5[/C][C]257958[/C][C]9085.88762862495[/C][C]21793[/C][/ROW]
[ROW][C]6[/C][C]283686.5[/C][C]3981.67347564647[/C][C]8902[/C][/ROW]
[/TABLE]
Source: https://freestatistics.org/blog/index.php?pk=4919&T=1

Globally Unique Identifier (entire table): ba.freestatistics.org/blog/index.php?pk=4919&T=1

As an alternative you can also use a QR Code:  

The GUIDs for individual cells are displayed in the table below:

Standard Deviation-Mean Plot
SectionMeanStandard DeviationRange
1164231.5855.1391699600721843
2173699.54472.2200676323310456
3196352.757180.3798588004116381
4216960.518628.630107087039528
52579589085.8876286249521793
6283686.53981.673475646478902


Regression: S.E.(k) = alpha + beta * Mean(k)
alpha1266.08759315802
beta0.02831442747785
S.D.0.0639366940674367
T-STAT0.442850977687172
p-value0.680768429105086

\begin{tabular}{lllllllll}
\hline
Regression: S.E.(k) = alpha + beta * Mean(k) \tabularnewline
alpha & 1266.08759315802 \tabularnewline
beta & 0.02831442747785 \tabularnewline
S.D. & 0.0639366940674367 \tabularnewline
T-STAT & 0.442850977687172 \tabularnewline
p-value & 0.680768429105086 \tabularnewline
\hline
\end{tabular}
%Source: https://freestatistics.org/blog/index.php?pk=4919&T=2

[TABLE]
[ROW][C]Regression: S.E.(k) = alpha + beta * Mean(k)[/C][/ROW]
[ROW][C]alpha[/C][C]1266.08759315802[/C][/ROW]
[ROW][C]beta[/C][C]0.02831442747785[/C][/ROW]
[ROW][C]S.D.[/C][C]0.0639366940674367[/C][/ROW]
[ROW][C]T-STAT[/C][C]0.442850977687172[/C][/ROW]
[ROW][C]p-value[/C][C]0.680768429105086[/C][/ROW]
[/TABLE]
Source: https://freestatistics.org/blog/index.php?pk=4919&T=2

Globally Unique Identifier (entire table): ba.freestatistics.org/blog/index.php?pk=4919&T=2

As an alternative you can also use a QR Code:  

The GUIDs for individual cells are displayed in the table below:

Regression: S.E.(k) = alpha + beta * Mean(k)
alpha1266.08759315802
beta0.02831442747785
S.D.0.0639366940674367
T-STAT0.442850977687172
p-value0.680768429105086


Regression: ln S.E.(k) = alpha + beta * ln Mean(k)
alpha-19.0104766498032
beta2.24745864652528
S.D.2.11842580181497
T-STAT1.06090977772257
p-value0.348540405597753
Lambda-1.24745864652528

\begin{tabular}{lllllllll}
\hline
Regression: ln S.E.(k) = alpha + beta * ln Mean(k) \tabularnewline
alpha & -19.0104766498032 \tabularnewline
beta & 2.24745864652528 \tabularnewline
S.D. & 2.11842580181497 \tabularnewline
T-STAT & 1.06090977772257 \tabularnewline
p-value & 0.348540405597753 \tabularnewline
Lambda & -1.24745864652528 \tabularnewline
\hline
\end{tabular}
%Source: https://freestatistics.org/blog/index.php?pk=4919&T=3

[TABLE]
[ROW][C]Regression: ln S.E.(k) = alpha + beta * ln Mean(k)[/C][/ROW]
[ROW][C]alpha[/C][C]-19.0104766498032[/C][/ROW]
[ROW][C]beta[/C][C]2.24745864652528[/C][/ROW]
[ROW][C]S.D.[/C][C]2.11842580181497[/C][/ROW]
[ROW][C]T-STAT[/C][C]1.06090977772257[/C][/ROW]
[ROW][C]p-value[/C][C]0.348540405597753[/C][/ROW]
[ROW][C]Lambda[/C][C]-1.24745864652528[/C][/ROW]
[/TABLE]
Source: https://freestatistics.org/blog/index.php?pk=4919&T=3

Globally Unique Identifier (entire table): ba.freestatistics.org/blog/index.php?pk=4919&T=3

As an alternative you can also use a QR Code:  

The GUIDs for individual cells are displayed in the table below:

Regression: ln S.E.(k) = alpha + beta * ln Mean(k)
alpha-19.0104766498032
beta2.24745864652528
S.D.2.11842580181497
T-STAT1.06090977772257
p-value0.348540405597753
Lambda-1.24745864652528


Parameters (Session):
par1 = 4 ;
Parameters (R input):
par1 = 4 ;
R code (references can be found in the software module):
par1 <- as.numeric(par1)
(n <- length(x))
(np <- floor(n / par1))
arr <- array(NA,dim=c(par1,np))
j <- 0
k <- 1
for (i in 1:(np*par1))
{
j = j + 1
arr[j,k] <- x[i]
if (j == par1) {
j = 0
k=k+1
}
}
arr
arr.mean <- array(NA,dim=np)
arr.sd <- array(NA,dim=np)
arr.range <- array(NA,dim=np)
for (j in 1:np)
{
arr.mean[j] <- mean(arr[,j],na.rm=TRUE)
arr.sd[j] <- sd(arr[,j],na.rm=TRUE)
arr.range[j] <- max(arr[,j],na.rm=TRUE) - min(arr[,j],na.rm=TRUE)
}
arr.mean
arr.sd
arr.range
(lm1 <- lm(arr.sd~arr.mean))
(lnlm1 <- lm(log(arr.sd)~log(arr.mean)))
(lm2 <- lm(arr.range~arr.mean))
bitmap(file='test1.png')
plot(arr.mean,arr.sd,main='Standard Deviation-Mean Plot',xlab='mean',ylab='standard deviation')
dev.off()
bitmap(file='test2.png')
plot(arr.mean,arr.range,main='Range-Mean Plot',xlab='mean',ylab='range')
dev.off()
load(file='createtable')
a<-table.start()
a<-table.row.start(a)
a<-table.element(a,'Standard Deviation-Mean Plot',4,TRUE)
a<-table.row.end(a)
a<-table.row.start(a)
a<-table.element(a,'Section',header=TRUE)
a<-table.element(a,'Mean',header=TRUE)
a<-table.element(a,'Standard Deviation',header=TRUE)
a<-table.element(a,'Range',header=TRUE)
a<-table.row.end(a)
for (j in 1:np) {
a<-table.row.start(a)
a<-table.element(a,j,header=TRUE)
a<-table.element(a,arr.mean[j])
a<-table.element(a,arr.sd[j] )
a<-table.element(a,arr.range[j] )
a<-table.row.end(a)
}
a<-table.end(a)
table.save(a,file='mytable.tab')
a<-table.start()
a<-table.row.start(a)
a<-table.element(a,'Regression: S.E.(k) = alpha + beta * Mean(k)',2,TRUE)
a<-table.row.end(a)
a<-table.row.start(a)
a<-table.element(a,'alpha',header=TRUE)
a<-table.element(a,lm1$coefficients[[1]])
a<-table.row.end(a)
a<-table.row.start(a)
a<-table.element(a,'beta',header=TRUE)
a<-table.element(a,lm1$coefficients[[2]])
a<-table.row.end(a)
a<-table.row.start(a)
a<-table.element(a,'S.D.',header=TRUE)
a<-table.element(a,summary(lm1)$coefficients[2,2])
a<-table.row.end(a)
a<-table.row.start(a)
a<-table.element(a,'T-STAT',header=TRUE)
a<-table.element(a,summary(lm1)$coefficients[2,3])
a<-table.row.end(a)
a<-table.row.start(a)
a<-table.element(a,'p-value',header=TRUE)
a<-table.element(a,summary(lm1)$coefficients[2,4])
a<-table.row.end(a)
a<-table.end(a)
table.save(a,file='mytable1.tab')
a<-table.start()
a<-table.row.start(a)
a<-table.element(a,'Regression: ln S.E.(k) = alpha + beta * ln Mean(k)',2,TRUE)
a<-table.row.end(a)
a<-table.row.start(a)
a<-table.element(a,'alpha',header=TRUE)
a<-table.element(a,lnlm1$coefficients[[1]])
a<-table.row.end(a)
a<-table.row.start(a)
a<-table.element(a,'beta',header=TRUE)
a<-table.element(a,lnlm1$coefficients[[2]])
a<-table.row.end(a)
a<-table.row.start(a)
a<-table.element(a,'S.D.',header=TRUE)
a<-table.element(a,summary(lnlm1)$coefficients[2,2])
a<-table.row.end(a)
a<-table.row.start(a)
a<-table.element(a,'T-STAT',header=TRUE)
a<-table.element(a,summary(lnlm1)$coefficients[2,3])
a<-table.row.end(a)
a<-table.row.start(a)
a<-table.element(a,'p-value',header=TRUE)
a<-table.element(a,summary(lnlm1)$coefficients[2,4])
a<-table.row.end(a)
a<-table.row.start(a)
a<-table.element(a,'Lambda',header=TRUE)
a<-table.element(a,1-lnlm1$coefficients[[2]])
a<-table.row.end(a)
a<-table.end(a)
table.save(a,file='mytable2.tab')