Free Statistics

of Irreproducible Research!

Author's title

Author*Unverified author*
R Software Modulerwasp_autocorrelation.wasp
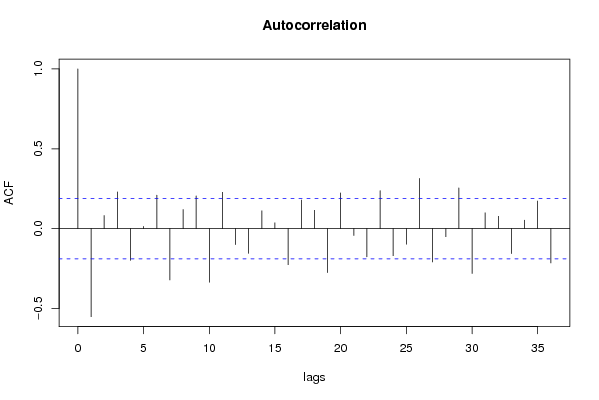
Title produced by software(Partial) Autocorrelation Function
Date of computationSat, 29 Dec 2007 10:25:51 -0700
Cite this page as followsStatistical Computations at FreeStatistics.org, Office for Research Development and Education, URL https://freestatistics.org/blog/index.php?v=date/2007/Dec/29/t1198947932271svarci0isuqc.htm/, Retrieved Sat, 27 Apr 2024 10:17:59 +0000
Statistical Computations at FreeStatistics.org, Office for Research Development and Education, URL https://freestatistics.org/blog/index.php?pk=4918, Retrieved Sat, 27 Apr 2024 10:17:59 +0000
QR Codes:

Original text written by user:
IsPrivate?No (this computation is public)
User-defined keywords
Estimated Impact271
Family? (F = Feedback message, R = changed R code, M = changed R Module, P = changed Parameters, D = changed Data)
-       [(Partial) Autocorrelation Function] [PAPER-ACF] [2007-12-29 17:25:51] [6bdd947de0ee04552c8f0fc807f31807] [Current]
Feedback Forum

Post a new message
Dataseries X:
7272.2
6680.1
8427.6
8752.8
7952.7
8694.3
7787
8474.2
9154.7
8557.2
7951.1
9156.7
7865.7
7337.4
9131.7
8814.6
8598.8
8439.6
7451.8
8016.2
9544.1
8270.7
8102.2
9369
7657.7
7816.6
9391.3
9445.4
9533.1
10068.7
8955.5
10423.9
11617.2
9391.1
10872
10230.4
9221
9428.6
10934.5
10986
11724.6
11180.9
11163.2
11240.9
12107.1
10762.3
11340.4
11266.8
9542.7
9227.7
10571.9
10774.4
10392.8
9920.2
9884.9
10174.5
11395.4
10760.2
10570.1
10536
9902.6
8889
10837.3
11624.1
10509
10984.9
10649.1
10855.7
11677.4
10760.2
10046.2
10772.8
9987.7
8638.7
11063.7
11855.7
10684.5
11337.4
10478
11123.9
12909.3
11339.9
10462.2
12733.5
10519.2
10414.9
12476.8
12384.6
12266.7
12919.9
11497.3
12142
13919.4
12656.8
12034.1
13199.7
10881.3
11301.2
13643.9
12517
13981.1
14275.7
13435
13565.7
16216.3
12970
14079.9
14235
12213.4
12581
14130.4
14210.8
14378.5
13142.8
13714.7
13621.9
15379.8
13306.3
14391.2
14909.9


Summary of compuational transaction
Raw Inputview raw input (R code)
Raw Outputview raw output of R engine
Computing time1 seconds
R Server'Gwilym Jenkins' @ 72.249.127.135

\begin{tabular}{lllllllll}
\hline
Summary of compuational transaction \tabularnewline
Raw Input & view raw input (R code)  \tabularnewline
Raw Output & view raw output of R engine  \tabularnewline
Computing time & 1 seconds \tabularnewline
R Server & 'Gwilym Jenkins' @ 72.249.127.135 \tabularnewline
\hline
\end{tabular}
%Source: https://freestatistics.org/blog/index.php?pk=4918&T=0

[TABLE]
[ROW][C]Summary of compuational transaction[/C][/ROW]
[ROW][C]Raw Input[/C][C]view raw input (R code) [/C][/ROW]
[ROW][C]Raw Output[/C][C]view raw output of R engine [/C][/ROW]
[ROW][C]Computing time[/C][C]1 seconds[/C][/ROW]
[ROW][C]R Server[/C][C]'Gwilym Jenkins' @ 72.249.127.135[/C][/ROW]
[/TABLE]
Source: https://freestatistics.org/blog/index.php?pk=4918&T=0

Globally Unique Identifier (entire table): ba.freestatistics.org/blog/index.php?pk=4918&T=0

As an alternative you can also use a QR Code:  

The GUIDs for individual cells are displayed in the table below:

Summary of compuational transaction
Raw Inputview raw input (R code)
Raw Outputview raw output of R engine
Computing time1 seconds
R Server'Gwilym Jenkins' @ 72.249.127.135


Autocorrelation Function
Time lag kACF(k)T-STATP-value
0110.34410
1-0.551305-5.70271
20.0819670.84790.199199
30.2298832.37790.009592
4-0.198698-2.05530.97886
50.0139490.14430.442774
60.2093492.16550.016284
7-0.321093-3.32140.999387
80.1191931.23290.11015
90.2049662.12020.018151
10-0.3357-3.47250.999627
110.2274952.35320.010219
12-0.100212-1.03660.848871
13-0.154288-1.5960.943278
140.1118061.15650.125019
150.0362070.37450.354377
16-0.225542-2.3330.989242
170.1786791.84830.033663
180.1146021.18550.119232
19-0.275082-2.84550.997342
200.2234332.31120.011369
21-0.042464-0.43920.669316
22-0.176776-1.82860.964877
230.2376892.45870.007774
24-0.169249-1.75070.95857
25-0.097865-1.01230.843166
260.3139863.24790.000777
27-0.208277-2.15440.983275
28-0.050367-0.5210.69828
290.2547052.63470.004835
30-0.281086-2.90760.997785
310.0993961.02820.153097
320.0767770.79420.214423
33-0.155844-1.61210.945052
340.0525260.54330.294015
350.172581.78520.038533

\begin{tabular}{lllllllll}
\hline
Autocorrelation Function \tabularnewline
Time lag k & ACF(k) & T-STAT & P-value \tabularnewline
0 & 1 & 10.3441 & 0 \tabularnewline
1 & -0.551305 & -5.7027 & 1 \tabularnewline
2 & 0.081967 & 0.8479 & 0.199199 \tabularnewline
3 & 0.229883 & 2.3779 & 0.009592 \tabularnewline
4 & -0.198698 & -2.0553 & 0.97886 \tabularnewline
5 & 0.013949 & 0.1443 & 0.442774 \tabularnewline
6 & 0.209349 & 2.1655 & 0.016284 \tabularnewline
7 & -0.321093 & -3.3214 & 0.999387 \tabularnewline
8 & 0.119193 & 1.2329 & 0.11015 \tabularnewline
9 & 0.204966 & 2.1202 & 0.018151 \tabularnewline
10 & -0.3357 & -3.4725 & 0.999627 \tabularnewline
11 & 0.227495 & 2.3532 & 0.010219 \tabularnewline
12 & -0.100212 & -1.0366 & 0.848871 \tabularnewline
13 & -0.154288 & -1.596 & 0.943278 \tabularnewline
14 & 0.111806 & 1.1565 & 0.125019 \tabularnewline
15 & 0.036207 & 0.3745 & 0.354377 \tabularnewline
16 & -0.225542 & -2.333 & 0.989242 \tabularnewline
17 & 0.178679 & 1.8483 & 0.033663 \tabularnewline
18 & 0.114602 & 1.1855 & 0.119232 \tabularnewline
19 & -0.275082 & -2.8455 & 0.997342 \tabularnewline
20 & 0.223433 & 2.3112 & 0.011369 \tabularnewline
21 & -0.042464 & -0.4392 & 0.669316 \tabularnewline
22 & -0.176776 & -1.8286 & 0.964877 \tabularnewline
23 & 0.237689 & 2.4587 & 0.007774 \tabularnewline
24 & -0.169249 & -1.7507 & 0.95857 \tabularnewline
25 & -0.097865 & -1.0123 & 0.843166 \tabularnewline
26 & 0.313986 & 3.2479 & 0.000777 \tabularnewline
27 & -0.208277 & -2.1544 & 0.983275 \tabularnewline
28 & -0.050367 & -0.521 & 0.69828 \tabularnewline
29 & 0.254705 & 2.6347 & 0.004835 \tabularnewline
30 & -0.281086 & -2.9076 & 0.997785 \tabularnewline
31 & 0.099396 & 1.0282 & 0.153097 \tabularnewline
32 & 0.076777 & 0.7942 & 0.214423 \tabularnewline
33 & -0.155844 & -1.6121 & 0.945052 \tabularnewline
34 & 0.052526 & 0.5433 & 0.294015 \tabularnewline
35 & 0.17258 & 1.7852 & 0.038533 \tabularnewline
\hline
\end{tabular}
%Source: https://freestatistics.org/blog/index.php?pk=4918&T=1

[TABLE]
[ROW][C]Autocorrelation Function[/C][/ROW]
[ROW][C]Time lag k[/C][C]ACF(k)[/C][C]T-STAT[/C][C]P-value[/C][/ROW]
[ROW][C]0[/C][C]1[/C][C]10.3441[/C][C]0[/C][/ROW]
[ROW][C]1[/C][C]-0.551305[/C][C]-5.7027[/C][C]1[/C][/ROW]
[ROW][C]2[/C][C]0.081967[/C][C]0.8479[/C][C]0.199199[/C][/ROW]
[ROW][C]3[/C][C]0.229883[/C][C]2.3779[/C][C]0.009592[/C][/ROW]
[ROW][C]4[/C][C]-0.198698[/C][C]-2.0553[/C][C]0.97886[/C][/ROW]
[ROW][C]5[/C][C]0.013949[/C][C]0.1443[/C][C]0.442774[/C][/ROW]
[ROW][C]6[/C][C]0.209349[/C][C]2.1655[/C][C]0.016284[/C][/ROW]
[ROW][C]7[/C][C]-0.321093[/C][C]-3.3214[/C][C]0.999387[/C][/ROW]
[ROW][C]8[/C][C]0.119193[/C][C]1.2329[/C][C]0.11015[/C][/ROW]
[ROW][C]9[/C][C]0.204966[/C][C]2.1202[/C][C]0.018151[/C][/ROW]
[ROW][C]10[/C][C]-0.3357[/C][C]-3.4725[/C][C]0.999627[/C][/ROW]
[ROW][C]11[/C][C]0.227495[/C][C]2.3532[/C][C]0.010219[/C][/ROW]
[ROW][C]12[/C][C]-0.100212[/C][C]-1.0366[/C][C]0.848871[/C][/ROW]
[ROW][C]13[/C][C]-0.154288[/C][C]-1.596[/C][C]0.943278[/C][/ROW]
[ROW][C]14[/C][C]0.111806[/C][C]1.1565[/C][C]0.125019[/C][/ROW]
[ROW][C]15[/C][C]0.036207[/C][C]0.3745[/C][C]0.354377[/C][/ROW]
[ROW][C]16[/C][C]-0.225542[/C][C]-2.333[/C][C]0.989242[/C][/ROW]
[ROW][C]17[/C][C]0.178679[/C][C]1.8483[/C][C]0.033663[/C][/ROW]
[ROW][C]18[/C][C]0.114602[/C][C]1.1855[/C][C]0.119232[/C][/ROW]
[ROW][C]19[/C][C]-0.275082[/C][C]-2.8455[/C][C]0.997342[/C][/ROW]
[ROW][C]20[/C][C]0.223433[/C][C]2.3112[/C][C]0.011369[/C][/ROW]
[ROW][C]21[/C][C]-0.042464[/C][C]-0.4392[/C][C]0.669316[/C][/ROW]
[ROW][C]22[/C][C]-0.176776[/C][C]-1.8286[/C][C]0.964877[/C][/ROW]
[ROW][C]23[/C][C]0.237689[/C][C]2.4587[/C][C]0.007774[/C][/ROW]
[ROW][C]24[/C][C]-0.169249[/C][C]-1.7507[/C][C]0.95857[/C][/ROW]
[ROW][C]25[/C][C]-0.097865[/C][C]-1.0123[/C][C]0.843166[/C][/ROW]
[ROW][C]26[/C][C]0.313986[/C][C]3.2479[/C][C]0.000777[/C][/ROW]
[ROW][C]27[/C][C]-0.208277[/C][C]-2.1544[/C][C]0.983275[/C][/ROW]
[ROW][C]28[/C][C]-0.050367[/C][C]-0.521[/C][C]0.69828[/C][/ROW]
[ROW][C]29[/C][C]0.254705[/C][C]2.6347[/C][C]0.004835[/C][/ROW]
[ROW][C]30[/C][C]-0.281086[/C][C]-2.9076[/C][C]0.997785[/C][/ROW]
[ROW][C]31[/C][C]0.099396[/C][C]1.0282[/C][C]0.153097[/C][/ROW]
[ROW][C]32[/C][C]0.076777[/C][C]0.7942[/C][C]0.214423[/C][/ROW]
[ROW][C]33[/C][C]-0.155844[/C][C]-1.6121[/C][C]0.945052[/C][/ROW]
[ROW][C]34[/C][C]0.052526[/C][C]0.5433[/C][C]0.294015[/C][/ROW]
[ROW][C]35[/C][C]0.17258[/C][C]1.7852[/C][C]0.038533[/C][/ROW]
[/TABLE]
Source: https://freestatistics.org/blog/index.php?pk=4918&T=1

Globally Unique Identifier (entire table): ba.freestatistics.org/blog/index.php?pk=4918&T=1

As an alternative you can also use a QR Code:  

The GUIDs for individual cells are displayed in the table below:

Autocorrelation Function
Time lag kACF(k)T-STATP-value
0110.34410
1-0.551305-5.70271
20.0819670.84790.199199
30.2298832.37790.009592
4-0.198698-2.05530.97886
50.0139490.14430.442774
60.2093492.16550.016284
7-0.321093-3.32140.999387
80.1191931.23290.11015
90.2049662.12020.018151
10-0.3357-3.47250.999627
110.2274952.35320.010219
12-0.100212-1.03660.848871
13-0.154288-1.5960.943278
140.1118061.15650.125019
150.0362070.37450.354377
16-0.225542-2.3330.989242
170.1786791.84830.033663
180.1146021.18550.119232
19-0.275082-2.84550.997342
200.2234332.31120.011369
21-0.042464-0.43920.669316
22-0.176776-1.82860.964877
230.2376892.45870.007774
24-0.169249-1.75070.95857
25-0.097865-1.01230.843166
260.3139863.24790.000777
27-0.208277-2.15440.983275
28-0.050367-0.5210.69828
290.2547052.63470.004835
30-0.281086-2.90760.997785
310.0993961.02820.153097
320.0767770.79420.214423
33-0.155844-1.61210.945052
340.0525260.54330.294015
350.172581.78520.038533


Partial Autocorrelation Function
Time lag kPACF(k)T-STATP-value
0-0.551305-5.70271
1-0.318892-3.29860.99934
20.18181.88060.031376
30.1168621.20880.114697
4-0.070779-0.73210.767159
50.1484371.53540.063814
6-0.1337-1.3830.915229
7-0.207981-2.15140.983152
80.1908731.97440.025456
90.0246770.25530.399506
100.0070820.07330.47087
11-0.172627-1.78570.961507
12-0.257187-2.66040.995497
13-0.271049-2.80370.997
140.0381830.3950.346828
150.0786010.81310.208996
16-0.048832-0.50510.692742
170.2859752.95810.001905
180.0108450.11220.455446
19-0.230586-2.38520.990586
20-0.045359-0.46920.680058
21-0.0796-0.82340.793941
220.0117110.12110.451905
23-0.113353-1.17250.878205
24-0.217739-2.25230.986828
25-0.044727-0.46270.677727
260.0382150.39530.346706
270.0114420.11840.453005
280.056630.58580.279627
290.0697570.72160.236066
30-0.007715-0.07980.531731
31-0.228438-2.3630.990033
32-0.018993-0.19650.57769
33-0.017559-0.18160.571893
340.0595420.61590.269632
35-0.027444-0.28390.611476

\begin{tabular}{lllllllll}
\hline
Partial Autocorrelation Function \tabularnewline
Time lag k & PACF(k) & T-STAT & P-value \tabularnewline
0 & -0.551305 & -5.7027 & 1 \tabularnewline
1 & -0.318892 & -3.2986 & 0.99934 \tabularnewline
2 & 0.1818 & 1.8806 & 0.031376 \tabularnewline
3 & 0.116862 & 1.2088 & 0.114697 \tabularnewline
4 & -0.070779 & -0.7321 & 0.767159 \tabularnewline
5 & 0.148437 & 1.5354 & 0.063814 \tabularnewline
6 & -0.1337 & -1.383 & 0.915229 \tabularnewline
7 & -0.207981 & -2.1514 & 0.983152 \tabularnewline
8 & 0.190873 & 1.9744 & 0.025456 \tabularnewline
9 & 0.024677 & 0.2553 & 0.399506 \tabularnewline
10 & 0.007082 & 0.0733 & 0.47087 \tabularnewline
11 & -0.172627 & -1.7857 & 0.961507 \tabularnewline
12 & -0.257187 & -2.6604 & 0.995497 \tabularnewline
13 & -0.271049 & -2.8037 & 0.997 \tabularnewline
14 & 0.038183 & 0.395 & 0.346828 \tabularnewline
15 & 0.078601 & 0.8131 & 0.208996 \tabularnewline
16 & -0.048832 & -0.5051 & 0.692742 \tabularnewline
17 & 0.285975 & 2.9581 & 0.001905 \tabularnewline
18 & 0.010845 & 0.1122 & 0.455446 \tabularnewline
19 & -0.230586 & -2.3852 & 0.990586 \tabularnewline
20 & -0.045359 & -0.4692 & 0.680058 \tabularnewline
21 & -0.0796 & -0.8234 & 0.793941 \tabularnewline
22 & 0.011711 & 0.1211 & 0.451905 \tabularnewline
23 & -0.113353 & -1.1725 & 0.878205 \tabularnewline
24 & -0.217739 & -2.2523 & 0.986828 \tabularnewline
25 & -0.044727 & -0.4627 & 0.677727 \tabularnewline
26 & 0.038215 & 0.3953 & 0.346706 \tabularnewline
27 & 0.011442 & 0.1184 & 0.453005 \tabularnewline
28 & 0.05663 & 0.5858 & 0.279627 \tabularnewline
29 & 0.069757 & 0.7216 & 0.236066 \tabularnewline
30 & -0.007715 & -0.0798 & 0.531731 \tabularnewline
31 & -0.228438 & -2.363 & 0.990033 \tabularnewline
32 & -0.018993 & -0.1965 & 0.57769 \tabularnewline
33 & -0.017559 & -0.1816 & 0.571893 \tabularnewline
34 & 0.059542 & 0.6159 & 0.269632 \tabularnewline
35 & -0.027444 & -0.2839 & 0.611476 \tabularnewline
\hline
\end{tabular}
%Source: https://freestatistics.org/blog/index.php?pk=4918&T=2

[TABLE]
[ROW][C]Partial Autocorrelation Function[/C][/ROW]
[ROW][C]Time lag k[/C][C]PACF(k)[/C][C]T-STAT[/C][C]P-value[/C][/ROW]
[ROW][C]0[/C][C]-0.551305[/C][C]-5.7027[/C][C]1[/C][/ROW]
[ROW][C]1[/C][C]-0.318892[/C][C]-3.2986[/C][C]0.99934[/C][/ROW]
[ROW][C]2[/C][C]0.1818[/C][C]1.8806[/C][C]0.031376[/C][/ROW]
[ROW][C]3[/C][C]0.116862[/C][C]1.2088[/C][C]0.114697[/C][/ROW]
[ROW][C]4[/C][C]-0.070779[/C][C]-0.7321[/C][C]0.767159[/C][/ROW]
[ROW][C]5[/C][C]0.148437[/C][C]1.5354[/C][C]0.063814[/C][/ROW]
[ROW][C]6[/C][C]-0.1337[/C][C]-1.383[/C][C]0.915229[/C][/ROW]
[ROW][C]7[/C][C]-0.207981[/C][C]-2.1514[/C][C]0.983152[/C][/ROW]
[ROW][C]8[/C][C]0.190873[/C][C]1.9744[/C][C]0.025456[/C][/ROW]
[ROW][C]9[/C][C]0.024677[/C][C]0.2553[/C][C]0.399506[/C][/ROW]
[ROW][C]10[/C][C]0.007082[/C][C]0.0733[/C][C]0.47087[/C][/ROW]
[ROW][C]11[/C][C]-0.172627[/C][C]-1.7857[/C][C]0.961507[/C][/ROW]
[ROW][C]12[/C][C]-0.257187[/C][C]-2.6604[/C][C]0.995497[/C][/ROW]
[ROW][C]13[/C][C]-0.271049[/C][C]-2.8037[/C][C]0.997[/C][/ROW]
[ROW][C]14[/C][C]0.038183[/C][C]0.395[/C][C]0.346828[/C][/ROW]
[ROW][C]15[/C][C]0.078601[/C][C]0.8131[/C][C]0.208996[/C][/ROW]
[ROW][C]16[/C][C]-0.048832[/C][C]-0.5051[/C][C]0.692742[/C][/ROW]
[ROW][C]17[/C][C]0.285975[/C][C]2.9581[/C][C]0.001905[/C][/ROW]
[ROW][C]18[/C][C]0.010845[/C][C]0.1122[/C][C]0.455446[/C][/ROW]
[ROW][C]19[/C][C]-0.230586[/C][C]-2.3852[/C][C]0.990586[/C][/ROW]
[ROW][C]20[/C][C]-0.045359[/C][C]-0.4692[/C][C]0.680058[/C][/ROW]
[ROW][C]21[/C][C]-0.0796[/C][C]-0.8234[/C][C]0.793941[/C][/ROW]
[ROW][C]22[/C][C]0.011711[/C][C]0.1211[/C][C]0.451905[/C][/ROW]
[ROW][C]23[/C][C]-0.113353[/C][C]-1.1725[/C][C]0.878205[/C][/ROW]
[ROW][C]24[/C][C]-0.217739[/C][C]-2.2523[/C][C]0.986828[/C][/ROW]
[ROW][C]25[/C][C]-0.044727[/C][C]-0.4627[/C][C]0.677727[/C][/ROW]
[ROW][C]26[/C][C]0.038215[/C][C]0.3953[/C][C]0.346706[/C][/ROW]
[ROW][C]27[/C][C]0.011442[/C][C]0.1184[/C][C]0.453005[/C][/ROW]
[ROW][C]28[/C][C]0.05663[/C][C]0.5858[/C][C]0.279627[/C][/ROW]
[ROW][C]29[/C][C]0.069757[/C][C]0.7216[/C][C]0.236066[/C][/ROW]
[ROW][C]30[/C][C]-0.007715[/C][C]-0.0798[/C][C]0.531731[/C][/ROW]
[ROW][C]31[/C][C]-0.228438[/C][C]-2.363[/C][C]0.990033[/C][/ROW]
[ROW][C]32[/C][C]-0.018993[/C][C]-0.1965[/C][C]0.57769[/C][/ROW]
[ROW][C]33[/C][C]-0.017559[/C][C]-0.1816[/C][C]0.571893[/C][/ROW]
[ROW][C]34[/C][C]0.059542[/C][C]0.6159[/C][C]0.269632[/C][/ROW]
[ROW][C]35[/C][C]-0.027444[/C][C]-0.2839[/C][C]0.611476[/C][/ROW]
[/TABLE]
Source: https://freestatistics.org/blog/index.php?pk=4918&T=2

Globally Unique Identifier (entire table): ba.freestatistics.org/blog/index.php?pk=4918&T=2

As an alternative you can also use a QR Code:  

The GUIDs for individual cells are displayed in the table below:

Partial Autocorrelation Function
Time lag kPACF(k)T-STATP-value
0-0.551305-5.70271
1-0.318892-3.29860.99934
20.18181.88060.031376
30.1168621.20880.114697
4-0.070779-0.73210.767159
50.1484371.53540.063814
6-0.1337-1.3830.915229
7-0.207981-2.15140.983152
80.1908731.97440.025456
90.0246770.25530.399506
100.0070820.07330.47087
11-0.172627-1.78570.961507
12-0.257187-2.66040.995497
13-0.271049-2.80370.997
140.0381830.3950.346828
150.0786010.81310.208996
16-0.048832-0.50510.692742
170.2859752.95810.001905
180.0108450.11220.455446
19-0.230586-2.38520.990586
20-0.045359-0.46920.680058
21-0.0796-0.82340.793941
220.0117110.12110.451905
23-0.113353-1.17250.878205
24-0.217739-2.25230.986828
25-0.044727-0.46270.677727
260.0382150.39530.346706
270.0114420.11840.453005
280.056630.58580.279627
290.0697570.72160.236066
30-0.007715-0.07980.531731
31-0.228438-2.3630.990033
32-0.018993-0.19650.57769
33-0.017559-0.18160.571893
340.0595420.61590.269632
35-0.027444-0.28390.611476


Parameters (Session):
par1 = 36 ; par2 = 0.0 ; par3 = 1 ; par4 = 1 ; par5 = 12 ;
Parameters (R input):
par1 = 36 ; par2 = 0.0 ; par3 = 1 ; par4 = 1 ; par5 = 12 ;
R code (references can be found in the software module):
if (par1 == 'Default') {
par1 = 10*log10(length(x))
} else {
par1 <- as.numeric(par1)
}
par2 <- as.numeric(par2)
par3 <- as.numeric(par3)
par4 <- as.numeric(par4)
par5 <- as.numeric(par5)
if (par2 == 0) {
x <- log(x)
} else {
x <- (x ^ par2 - 1) / par2
}
if (par3 > 0) x <- diff(x,lag=1,difference=par3)
if (par4 > 0) x <- diff(x,lag=par5,difference=par4)
bitmap(file='pic1.png')
racf <- acf(x,par1,main='Autocorrelation',xlab='lags',ylab='ACF')
dev.off()
bitmap(file='pic2.png')
rpacf <- pacf(x,par1,main='Partial Autocorrelation',xlab='lags',ylab='PACF')
dev.off()
(myacf <- c(racf$acf))
(mypacf <- c(rpacf$acf))
lengthx <- length(x)
sqrtn <- sqrt(lengthx)
load(file='createtable')
a<-table.start()
a<-table.row.start(a)
a<-table.element(a,'Autocorrelation Function',4,TRUE)
a<-table.row.end(a)
a<-table.row.start(a)
a<-table.element(a,'Time lag k',header=TRUE)
a<-table.element(a,hyperlink('basics.htm','ACF(k)','click here for more information about the Autocorrelation Function'),header=TRUE)
a<-table.element(a,'T-STAT',header=TRUE)
a<-table.element(a,'P-value',header=TRUE)
a<-table.row.end(a)
for (i in 1:par1) {
a<-table.row.start(a)
a<-table.element(a,i-1,header=TRUE)
a<-table.element(a,round(myacf[i],6))
mytstat <- myacf[i]*sqrtn
a<-table.element(a,round(mytstat,4))
a<-table.element(a,round(1-pt(mytstat,lengthx),6))
a<-table.row.end(a)
}
a<-table.end(a)
table.save(a,file='mytable.tab')
a<-table.start()
a<-table.row.start(a)
a<-table.element(a,'Partial Autocorrelation Function',4,TRUE)
a<-table.row.end(a)
a<-table.row.start(a)
a<-table.element(a,'Time lag k',header=TRUE)
a<-table.element(a,hyperlink('basics.htm','PACF(k)','click here for more information about the Partial Autocorrelation Function'),header=TRUE)
a<-table.element(a,'T-STAT',header=TRUE)
a<-table.element(a,'P-value',header=TRUE)
a<-table.row.end(a)
for (i in 1:par1) {
a<-table.row.start(a)
a<-table.element(a,i-1,header=TRUE)
a<-table.element(a,round(mypacf[i],6))
mytstat <- mypacf[i]*sqrtn
a<-table.element(a,round(mytstat,4))
a<-table.element(a,round(1-pt(mytstat,lengthx),6))
a<-table.row.end(a)
}
a<-table.end(a)
table.save(a,file='mytable1.tab')