| Multiple Linear Regression - Estimated Regression Equation |
| BBP[t] = + 132356.491935484 + 9922.88709677425`ja/nee`[t] + 7893.83243727606M1[t] + 3406.82885304658M2[t] + 2864.49193548385M3[t] + 12149.6388888889M4[t] + 9094.80197132617M5[t] + 8934.96505376345M6[t] + 6744.12813620071M7[t] + 7098.29121863798M8[t] + 10440.9543010753M9[t] + 8828.61738351255M10[t] + 2797.83691756272M11[t] + 6040.33691756272t + e[t] |
| Multiple Linear Regression - Ordinary Least Squares | |||||
| Variable | Parameter | S.D. | T-STAT H0: parameter = 0 | 2-tail p-value | 1-tail p-value |
| (Intercept) | 132356.491935484 | 10312.288128 | 12.8348 | 0 | 0 |
| `ja/nee` | 9922.88709677425 | 10018.430241 | 0.9905 | 0.340026 | 0.170013 |
| M1 | 7893.83243727606 | 11221.668845 | 0.7034 | 0.494185 | 0.247093 |
| M2 | 3406.82885304658 | 11189.086393 | 0.3045 | 0.765583 | 0.382792 |
| M3 | 2864.49193548385 | 11174.244781 | 0.2563 | 0.801694 | 0.400847 |
| M4 | 12149.6388888889 | 12669.279905 | 0.959 | 0.355064 | 0.177532 |
| M5 | 9094.80197132617 | 12677.136823 | 0.7174 | 0.485808 | 0.242904 |
| M6 | 8934.96505376345 | 12700.678416 | 0.7035 | 0.49415 | 0.247075 |
| M7 | 6744.12813620071 | 12739.817734 | 0.5294 | 0.605468 | 0.302734 |
| M8 | 7098.29121863798 | 12794.411632 | 0.5548 | 0.588453 | 0.294226 |
| M9 | 10440.9543010753 | 12864.263352 | 0.8116 | 0.431617 | 0.215809 |
| M10 | 8828.61738351255 | 12949.125979 | 0.6818 | 0.507336 | 0.253668 |
| M11 | 2797.83691756272 | 12180.427936 | 0.2297 | 0.8219 | 0.41095 |
| t | 6040.33691756272 | 446.256351 | 13.5356 | 0 | 0 |
| Multiple Linear Regression - Regression Statistics | |
| Multiple R | 0.985514095256932 |
| R-squared | 0.971238031950088 |
| Adjusted R-squared | 0.942476063900177 |
| F-TEST (value) | 33.7681354163477 |
| F-TEST (DF numerator) | 13 |
| F-TEST (DF denominator) | 13 |
| p-value | 7.43145109893817e-08 |
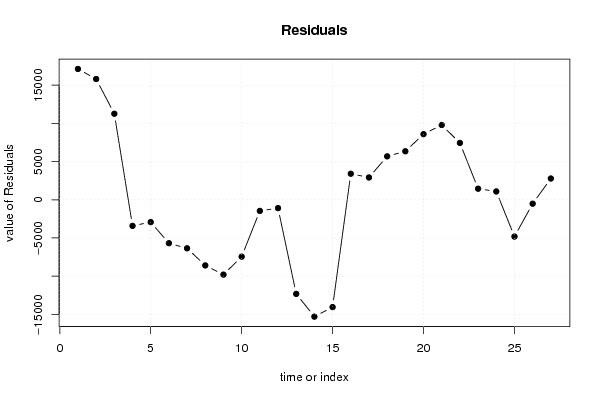
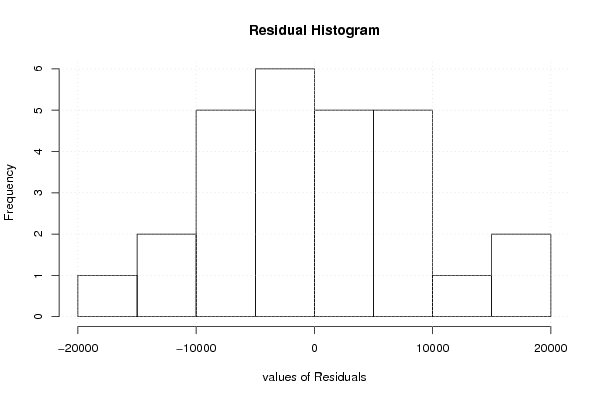
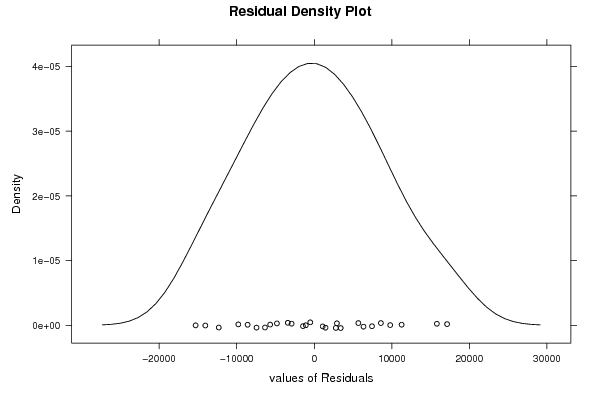
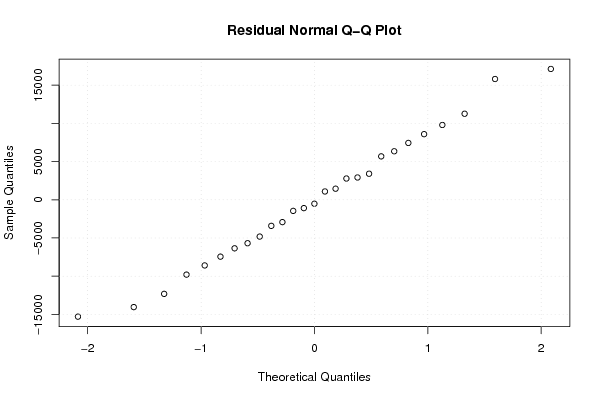
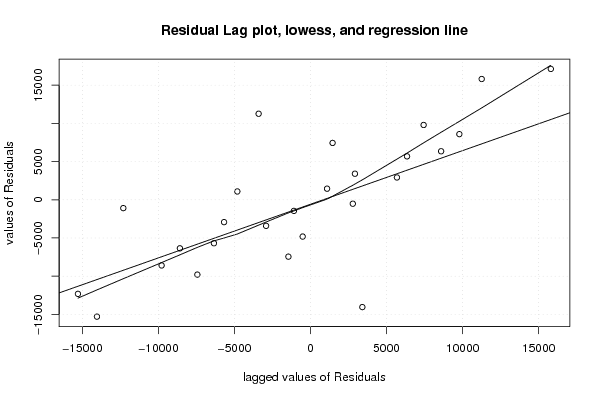
| Multiple Linear Regression - Residual Statistics | |
| Residual Standard Deviation | 12172.2504070904 |
| Sum Squared Residuals | 1926127839.64786 |
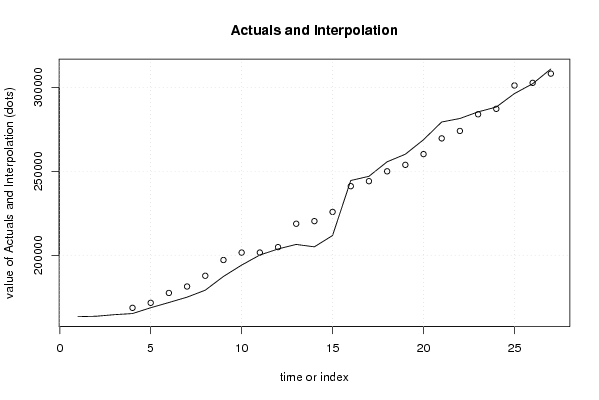
| Multiple Linear Regression - Actuals, Interpolation, and Residuals | |||
| Time or Index | Actuals | Interpolation Forecast | Residuals Prediction Error |
| 1 | 163414 | 146290.661290322 | 17123.3387096776 |
| 2 | 163652 | 147843.994623656 | 15808.0053763441 |
| 3 | 164603 | 153341.994623656 | 11261.0053763441 |
| 4 | 165257 | 168667.478494624 | -3410.47849462369 |
| 5 | 168731 | 171652.978494624 | -2921.97849462368 |
| 6 | 171848 | 177533.478494624 | -5685.47849462365 |
| 7 | 175032 | 181382.978494624 | -6350.97849462366 |
| 8 | 179187 | 187777.478494624 | -8590.47849462368 |
| 9 | 187369 | 197160.478494624 | -9791.47849462366 |
| 10 | 194147 | 201588.478494624 | -7441.47849462367 |
| 11 | 200145 | 201598.034946237 | -1453.03494623656 |
| 12 | 203750 | 204840.534946237 | -1090.53494623656 |
| 13 | 206464 | 218774.704301075 | -12310.7043010754 |
| 14 | 205034 | 220328.037634409 | -15294.0376344086 |
| 15 | 211782 | 225826.037634409 | -14044.0376344086 |
| 16 | 244562 | 241151.521505376 | 3410.47849462368 |
| 17 | 247059 | 244137.021505376 | 2921.97849462367 |
| 18 | 255703 | 250017.521505376 | 5685.47849462366 |
| 19 | 260218 | 253867.021505376 | 6350.97849462366 |
| 20 | 268852 | 260261.521505376 | 8590.47849462367 |
| 21 | 279436 | 269644.521505376 | 9791.47849462366 |
| 22 | 281514 | 274072.521505376 | 7441.47849462367 |
| 23 | 285458 | 284004.965053763 | 1453.03494623657 |
| 24 | 288338 | 287247.465053763 | 1090.53494623657 |
| 25 | 296369 | 301181.634408602 | -4812.63440860222 |
| 26 | 302221 | 302734.967741935 | -513.967741935443 |
| 27 | 311016 | 308232.967741935 | 2783.03225806454 |