Free Statistics

of Irreproducible Research!

Author's title

Author*Unverified author*
R Software Modulerwasp_autocorrelation.wasp
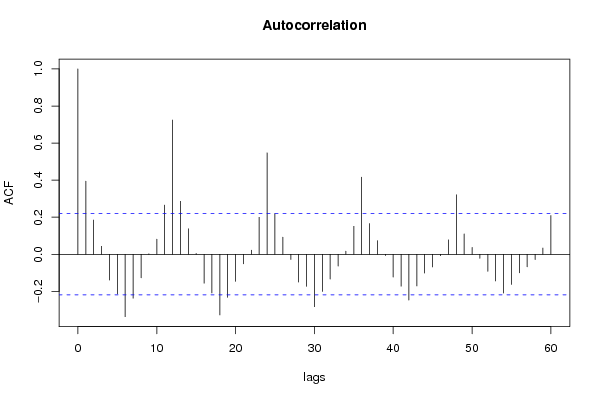
Title produced by software(Partial) Autocorrelation Function
Date of computationTue, 25 Dec 2007 05:26:40 -0700
Cite this page as followsStatistical Computations at FreeStatistics.org, Office for Research Development and Education, URL https://freestatistics.org/blog/index.php?v=date/2007/Dec/25/t1198584438pubjufxqefec4kk.htm/, Retrieved Sat, 04 May 2024 05:06:55 +0000
Statistical Computations at FreeStatistics.org, Office for Research Development and Education, URL https://freestatistics.org/blog/index.php?pk=4877, Retrieved Sat, 04 May 2024 05:06:55 +0000
QR Codes:

Original text written by user:
IsPrivate?No (this computation is public)
User-defined keywordsKlaas Van Pelt
Estimated Impact260
Family? (F = Feedback message, R = changed R code, M = changed R Module, P = changed Parameters, D = changed Data)
-       [(Partial) Autocorrelation Function] [ACF 1] [2007-12-25 12:26:40] [6abd901c2e17b7d5559c695bbff3d863] [Current]
Feedback Forum

Post a new message
Dataseries X:
37702
30364
32609
30212
29965
28352
25814
22414
20506
28806
22228
13971
36845
35338
35022
34777
26887
23970
22780
17351
21382
24561
17409
11514
31514
27071
29462
26105
22397
23843
21705
18089
20764
25316
17704
15548
28029
29383
36438
32034
22679
24319
18004
17537
20366
22782
19169
13807
29743
25591
29096
26482
22405
27044
17970
18730
19684
19785
18479
10698
31956
29506
34506
27165
26736
23691
18157
17328
18205
20995
17382
9367
31124
26551
30651
25859
25100
25778
20418
18688


Summary of compuational transaction
Raw Inputview raw input (R code)
Raw Outputview raw output of R engine
Computing time1 seconds
R Server'Gwilym Jenkins' @ 72.249.127.135

\begin{tabular}{lllllllll}
\hline
Summary of compuational transaction \tabularnewline
Raw Input & view raw input (R code)  \tabularnewline
Raw Output & view raw output of R engine  \tabularnewline
Computing time & 1 seconds \tabularnewline
R Server & 'Gwilym Jenkins' @ 72.249.127.135 \tabularnewline
\hline
\end{tabular}
%Source: https://freestatistics.org/blog/index.php?pk=4877&T=0

[TABLE]
[ROW][C]Summary of compuational transaction[/C][/ROW]
[ROW][C]Raw Input[/C][C]view raw input (R code) [/C][/ROW]
[ROW][C]Raw Output[/C][C]view raw output of R engine [/C][/ROW]
[ROW][C]Computing time[/C][C]1 seconds[/C][/ROW]
[ROW][C]R Server[/C][C]'Gwilym Jenkins' @ 72.249.127.135[/C][/ROW]
[/TABLE]
Source: https://freestatistics.org/blog/index.php?pk=4877&T=0

Globally Unique Identifier (entire table): ba.freestatistics.org/blog/index.php?pk=4877&T=0

As an alternative you can also use a QR Code:  

The GUIDs for individual cells are displayed in the table below:

Summary of compuational transaction
Raw Inputview raw input (R code)
Raw Outputview raw output of R engine
Computing time1 seconds
R Server'Gwilym Jenkins' @ 72.249.127.135


Autocorrelation Function
Time lag kACF(k)T-STATP-value
018.94430
10.3941793.52560.000351
20.1846431.65150.051278
30.0434250.38840.349372
4-0.139185-1.24490.8916
5-0.213576-1.91030.97016
6-0.336436-3.00920.998249
7-0.23692-2.11910.981407
8-0.127127-1.13710.870546
90.0027780.02480.49012
100.0815540.72940.233932
110.2653032.37290.010023
120.7239626.47530
130.2855942.55440.006267
140.1372231.22740.111644
150.0048370.04330.482801
16-0.156144-1.39660.9168
17-0.208298-1.86310.966939
18-0.327506-2.92930.997788
19-0.232428-2.07890.979585
20-0.145817-1.30420.902051
21-0.051392-0.45970.676498
220.0224960.20120.420522
230.1997471.78660.038896
240.5471914.89423e-06
250.2193181.96160.026642
260.0920290.82310.20644
27-0.028065-0.2510.598779
28-0.149765-1.33950.907906
29-0.172858-1.54610.936985
30-0.28241-2.5260.993244
31-0.200346-1.79190.961539
32-0.13356-1.19460.882113
33-0.063218-0.56540.71332
340.0169260.15140.440025
350.1510411.3510.09026
360.4161013.72170.000183
370.1659691.48450.070807
380.0736250.65850.256047
39-0.006678-0.05970.523742
40-0.122591-1.09650.861923
41-0.172333-1.54140.936416
42-0.247262-2.21160.985075
43-0.170905-1.52860.934848
44-0.101441-0.90730.816518
45-0.068506-0.61270.729105
46-0.007592-0.06790.526985
470.0778050.69590.24425
480.3208052.86940.002629
490.1095970.98030.164956
500.0369650.33060.370897
51-0.02163-0.19350.576457
52-0.091972-0.82260.793415
53-0.143938-1.28740.899171
54-0.20914-1.87060.967472
55-0.162468-1.45320.924954
56-0.099637-0.89120.812247
57-0.067307-0.6020.725565
58-0.028434-0.25430.600051
590.0335230.29980.382537

\begin{tabular}{lllllllll}
\hline
Autocorrelation Function \tabularnewline
Time lag k & ACF(k) & T-STAT & P-value \tabularnewline
0 & 1 & 8.9443 & 0 \tabularnewline
1 & 0.394179 & 3.5256 & 0.000351 \tabularnewline
2 & 0.184643 & 1.6515 & 0.051278 \tabularnewline
3 & 0.043425 & 0.3884 & 0.349372 \tabularnewline
4 & -0.139185 & -1.2449 & 0.8916 \tabularnewline
5 & -0.213576 & -1.9103 & 0.97016 \tabularnewline
6 & -0.336436 & -3.0092 & 0.998249 \tabularnewline
7 & -0.23692 & -2.1191 & 0.981407 \tabularnewline
8 & -0.127127 & -1.1371 & 0.870546 \tabularnewline
9 & 0.002778 & 0.0248 & 0.49012 \tabularnewline
10 & 0.081554 & 0.7294 & 0.233932 \tabularnewline
11 & 0.265303 & 2.3729 & 0.010023 \tabularnewline
12 & 0.723962 & 6.4753 & 0 \tabularnewline
13 & 0.285594 & 2.5544 & 0.006267 \tabularnewline
14 & 0.137223 & 1.2274 & 0.111644 \tabularnewline
15 & 0.004837 & 0.0433 & 0.482801 \tabularnewline
16 & -0.156144 & -1.3966 & 0.9168 \tabularnewline
17 & -0.208298 & -1.8631 & 0.966939 \tabularnewline
18 & -0.327506 & -2.9293 & 0.997788 \tabularnewline
19 & -0.232428 & -2.0789 & 0.979585 \tabularnewline
20 & -0.145817 & -1.3042 & 0.902051 \tabularnewline
21 & -0.051392 & -0.4597 & 0.676498 \tabularnewline
22 & 0.022496 & 0.2012 & 0.420522 \tabularnewline
23 & 0.199747 & 1.7866 & 0.038896 \tabularnewline
24 & 0.547191 & 4.8942 & 3e-06 \tabularnewline
25 & 0.219318 & 1.9616 & 0.026642 \tabularnewline
26 & 0.092029 & 0.8231 & 0.20644 \tabularnewline
27 & -0.028065 & -0.251 & 0.598779 \tabularnewline
28 & -0.149765 & -1.3395 & 0.907906 \tabularnewline
29 & -0.172858 & -1.5461 & 0.936985 \tabularnewline
30 & -0.28241 & -2.526 & 0.993244 \tabularnewline
31 & -0.200346 & -1.7919 & 0.961539 \tabularnewline
32 & -0.13356 & -1.1946 & 0.882113 \tabularnewline
33 & -0.063218 & -0.5654 & 0.71332 \tabularnewline
34 & 0.016926 & 0.1514 & 0.440025 \tabularnewline
35 & 0.151041 & 1.351 & 0.09026 \tabularnewline
36 & 0.416101 & 3.7217 & 0.000183 \tabularnewline
37 & 0.165969 & 1.4845 & 0.070807 \tabularnewline
38 & 0.073625 & 0.6585 & 0.256047 \tabularnewline
39 & -0.006678 & -0.0597 & 0.523742 \tabularnewline
40 & -0.122591 & -1.0965 & 0.861923 \tabularnewline
41 & -0.172333 & -1.5414 & 0.936416 \tabularnewline
42 & -0.247262 & -2.2116 & 0.985075 \tabularnewline
43 & -0.170905 & -1.5286 & 0.934848 \tabularnewline
44 & -0.101441 & -0.9073 & 0.816518 \tabularnewline
45 & -0.068506 & -0.6127 & 0.729105 \tabularnewline
46 & -0.007592 & -0.0679 & 0.526985 \tabularnewline
47 & 0.077805 & 0.6959 & 0.24425 \tabularnewline
48 & 0.320805 & 2.8694 & 0.002629 \tabularnewline
49 & 0.109597 & 0.9803 & 0.164956 \tabularnewline
50 & 0.036965 & 0.3306 & 0.370897 \tabularnewline
51 & -0.02163 & -0.1935 & 0.576457 \tabularnewline
52 & -0.091972 & -0.8226 & 0.793415 \tabularnewline
53 & -0.143938 & -1.2874 & 0.899171 \tabularnewline
54 & -0.20914 & -1.8706 & 0.967472 \tabularnewline
55 & -0.162468 & -1.4532 & 0.924954 \tabularnewline
56 & -0.099637 & -0.8912 & 0.812247 \tabularnewline
57 & -0.067307 & -0.602 & 0.725565 \tabularnewline
58 & -0.028434 & -0.2543 & 0.600051 \tabularnewline
59 & 0.033523 & 0.2998 & 0.382537 \tabularnewline
\hline
\end{tabular}
%Source: https://freestatistics.org/blog/index.php?pk=4877&T=1

[TABLE]
[ROW][C]Autocorrelation Function[/C][/ROW]
[ROW][C]Time lag k[/C][C]ACF(k)[/C][C]T-STAT[/C][C]P-value[/C][/ROW]
[ROW][C]0[/C][C]1[/C][C]8.9443[/C][C]0[/C][/ROW]
[ROW][C]1[/C][C]0.394179[/C][C]3.5256[/C][C]0.000351[/C][/ROW]
[ROW][C]2[/C][C]0.184643[/C][C]1.6515[/C][C]0.051278[/C][/ROW]
[ROW][C]3[/C][C]0.043425[/C][C]0.3884[/C][C]0.349372[/C][/ROW]
[ROW][C]4[/C][C]-0.139185[/C][C]-1.2449[/C][C]0.8916[/C][/ROW]
[ROW][C]5[/C][C]-0.213576[/C][C]-1.9103[/C][C]0.97016[/C][/ROW]
[ROW][C]6[/C][C]-0.336436[/C][C]-3.0092[/C][C]0.998249[/C][/ROW]
[ROW][C]7[/C][C]-0.23692[/C][C]-2.1191[/C][C]0.981407[/C][/ROW]
[ROW][C]8[/C][C]-0.127127[/C][C]-1.1371[/C][C]0.870546[/C][/ROW]
[ROW][C]9[/C][C]0.002778[/C][C]0.0248[/C][C]0.49012[/C][/ROW]
[ROW][C]10[/C][C]0.081554[/C][C]0.7294[/C][C]0.233932[/C][/ROW]
[ROW][C]11[/C][C]0.265303[/C][C]2.3729[/C][C]0.010023[/C][/ROW]
[ROW][C]12[/C][C]0.723962[/C][C]6.4753[/C][C]0[/C][/ROW]
[ROW][C]13[/C][C]0.285594[/C][C]2.5544[/C][C]0.006267[/C][/ROW]
[ROW][C]14[/C][C]0.137223[/C][C]1.2274[/C][C]0.111644[/C][/ROW]
[ROW][C]15[/C][C]0.004837[/C][C]0.0433[/C][C]0.482801[/C][/ROW]
[ROW][C]16[/C][C]-0.156144[/C][C]-1.3966[/C][C]0.9168[/C][/ROW]
[ROW][C]17[/C][C]-0.208298[/C][C]-1.8631[/C][C]0.966939[/C][/ROW]
[ROW][C]18[/C][C]-0.327506[/C][C]-2.9293[/C][C]0.997788[/C][/ROW]
[ROW][C]19[/C][C]-0.232428[/C][C]-2.0789[/C][C]0.979585[/C][/ROW]
[ROW][C]20[/C][C]-0.145817[/C][C]-1.3042[/C][C]0.902051[/C][/ROW]
[ROW][C]21[/C][C]-0.051392[/C][C]-0.4597[/C][C]0.676498[/C][/ROW]
[ROW][C]22[/C][C]0.022496[/C][C]0.2012[/C][C]0.420522[/C][/ROW]
[ROW][C]23[/C][C]0.199747[/C][C]1.7866[/C][C]0.038896[/C][/ROW]
[ROW][C]24[/C][C]0.547191[/C][C]4.8942[/C][C]3e-06[/C][/ROW]
[ROW][C]25[/C][C]0.219318[/C][C]1.9616[/C][C]0.026642[/C][/ROW]
[ROW][C]26[/C][C]0.092029[/C][C]0.8231[/C][C]0.20644[/C][/ROW]
[ROW][C]27[/C][C]-0.028065[/C][C]-0.251[/C][C]0.598779[/C][/ROW]
[ROW][C]28[/C][C]-0.149765[/C][C]-1.3395[/C][C]0.907906[/C][/ROW]
[ROW][C]29[/C][C]-0.172858[/C][C]-1.5461[/C][C]0.936985[/C][/ROW]
[ROW][C]30[/C][C]-0.28241[/C][C]-2.526[/C][C]0.993244[/C][/ROW]
[ROW][C]31[/C][C]-0.200346[/C][C]-1.7919[/C][C]0.961539[/C][/ROW]
[ROW][C]32[/C][C]-0.13356[/C][C]-1.1946[/C][C]0.882113[/C][/ROW]
[ROW][C]33[/C][C]-0.063218[/C][C]-0.5654[/C][C]0.71332[/C][/ROW]
[ROW][C]34[/C][C]0.016926[/C][C]0.1514[/C][C]0.440025[/C][/ROW]
[ROW][C]35[/C][C]0.151041[/C][C]1.351[/C][C]0.09026[/C][/ROW]
[ROW][C]36[/C][C]0.416101[/C][C]3.7217[/C][C]0.000183[/C][/ROW]
[ROW][C]37[/C][C]0.165969[/C][C]1.4845[/C][C]0.070807[/C][/ROW]
[ROW][C]38[/C][C]0.073625[/C][C]0.6585[/C][C]0.256047[/C][/ROW]
[ROW][C]39[/C][C]-0.006678[/C][C]-0.0597[/C][C]0.523742[/C][/ROW]
[ROW][C]40[/C][C]-0.122591[/C][C]-1.0965[/C][C]0.861923[/C][/ROW]
[ROW][C]41[/C][C]-0.172333[/C][C]-1.5414[/C][C]0.936416[/C][/ROW]
[ROW][C]42[/C][C]-0.247262[/C][C]-2.2116[/C][C]0.985075[/C][/ROW]
[ROW][C]43[/C][C]-0.170905[/C][C]-1.5286[/C][C]0.934848[/C][/ROW]
[ROW][C]44[/C][C]-0.101441[/C][C]-0.9073[/C][C]0.816518[/C][/ROW]
[ROW][C]45[/C][C]-0.068506[/C][C]-0.6127[/C][C]0.729105[/C][/ROW]
[ROW][C]46[/C][C]-0.007592[/C][C]-0.0679[/C][C]0.526985[/C][/ROW]
[ROW][C]47[/C][C]0.077805[/C][C]0.6959[/C][C]0.24425[/C][/ROW]
[ROW][C]48[/C][C]0.320805[/C][C]2.8694[/C][C]0.002629[/C][/ROW]
[ROW][C]49[/C][C]0.109597[/C][C]0.9803[/C][C]0.164956[/C][/ROW]
[ROW][C]50[/C][C]0.036965[/C][C]0.3306[/C][C]0.370897[/C][/ROW]
[ROW][C]51[/C][C]-0.02163[/C][C]-0.1935[/C][C]0.576457[/C][/ROW]
[ROW][C]52[/C][C]-0.091972[/C][C]-0.8226[/C][C]0.793415[/C][/ROW]
[ROW][C]53[/C][C]-0.143938[/C][C]-1.2874[/C][C]0.899171[/C][/ROW]
[ROW][C]54[/C][C]-0.20914[/C][C]-1.8706[/C][C]0.967472[/C][/ROW]
[ROW][C]55[/C][C]-0.162468[/C][C]-1.4532[/C][C]0.924954[/C][/ROW]
[ROW][C]56[/C][C]-0.099637[/C][C]-0.8912[/C][C]0.812247[/C][/ROW]
[ROW][C]57[/C][C]-0.067307[/C][C]-0.602[/C][C]0.725565[/C][/ROW]
[ROW][C]58[/C][C]-0.028434[/C][C]-0.2543[/C][C]0.600051[/C][/ROW]
[ROW][C]59[/C][C]0.033523[/C][C]0.2998[/C][C]0.382537[/C][/ROW]
[/TABLE]
Source: https://freestatistics.org/blog/index.php?pk=4877&T=1

Globally Unique Identifier (entire table): ba.freestatistics.org/blog/index.php?pk=4877&T=1

As an alternative you can also use a QR Code:  

The GUIDs for individual cells are displayed in the table below:

Autocorrelation Function
Time lag kACF(k)T-STATP-value
018.94430
10.3941793.52560.000351
20.1846431.65150.051278
30.0434250.38840.349372
4-0.139185-1.24490.8916
5-0.213576-1.91030.97016
6-0.336436-3.00920.998249
7-0.23692-2.11910.981407
8-0.127127-1.13710.870546
90.0027780.02480.49012
100.0815540.72940.233932
110.2653032.37290.010023
120.7239626.47530
130.2855942.55440.006267
140.1372231.22740.111644
150.0048370.04330.482801
16-0.156144-1.39660.9168
17-0.208298-1.86310.966939
18-0.327506-2.92930.997788
19-0.232428-2.07890.979585
20-0.145817-1.30420.902051
21-0.051392-0.45970.676498
220.0224960.20120.420522
230.1997471.78660.038896
240.5471914.89423e-06
250.2193181.96160.026642
260.0920290.82310.20644
27-0.028065-0.2510.598779
28-0.149765-1.33950.907906
29-0.172858-1.54610.936985
30-0.28241-2.5260.993244
31-0.200346-1.79190.961539
32-0.13356-1.19460.882113
33-0.063218-0.56540.71332
340.0169260.15140.440025
350.1510411.3510.09026
360.4161013.72170.000183
370.1659691.48450.070807
380.0736250.65850.256047
39-0.006678-0.05970.523742
40-0.122591-1.09650.861923
41-0.172333-1.54140.936416
42-0.247262-2.21160.985075
43-0.170905-1.52860.934848
44-0.101441-0.90730.816518
45-0.068506-0.61270.729105
46-0.007592-0.06790.526985
470.0778050.69590.24425
480.3208052.86940.002629
490.1095970.98030.164956
500.0369650.33060.370897
51-0.02163-0.19350.576457
52-0.091972-0.82260.793415
53-0.143938-1.28740.899171
54-0.20914-1.87060.967472
55-0.162468-1.45320.924954
56-0.099637-0.89120.812247
57-0.067307-0.6020.725565
58-0.028434-0.25430.600051
590.0335230.29980.382537


Partial Autocorrelation Function
Time lag kPACF(k)T-STATP-value
00.3941793.52560.000351
10.034650.30990.378714
2-0.048-0.42930.66558
3-0.174216-1.55820.938437
4-0.121309-1.0850.859413
5-0.225928-2.02080.976675
6-0.018068-0.16160.563987
70.0008970.0080.496808
80.0583920.52230.301463
90.001160.01040.495872
100.1920911.71810.044822
110.6589445.89380
12-0.317164-2.83680.997115
13-0.082178-0.7350.767762
14-0.026481-0.23690.593313
150.0087870.07860.468775
16-0.044241-0.39570.653312
170.0009590.00860.496587
180.0144730.12950.448663
19-0.112015-1.00190.840292
20-0.039497-0.35330.637592
210.054380.48640.314011
220.0492580.44060.330355
23-0.021106-0.18880.574629
24-0.039352-0.3520.637109
25-0.06417-0.5740.716196
26-0.029441-0.26330.603512
270.0339890.3040.380957
280.0577520.51660.303447
29-0.01132-0.10120.540197
30-0.044009-0.39360.65255
31-0.018208-0.16290.564478
320.0116630.10430.45859
330.0544810.48730.313691
34-0.045903-0.41060.658757
35-0.021715-0.19420.576753
36-0.049015-0.43840.668863
370.0268670.24030.405352
380.0810140.72460.235403
39-0.024527-0.21940.586541
40-0.132895-1.18860.880952
410.0071410.06390.474616
420.0262130.23450.407616
430.0545730.48810.313401
44-0.046505-0.4160.66072
45-0.061429-0.54940.707883
46-0.124557-1.11410.865709
470.0675650.60430.27367
480.0014350.01280.494897
49-0.007932-0.07090.528192
50-0.086069-0.76980.778164
510.0353950.31660.376193
52-0.019393-0.17350.568634
53-0.012716-0.11370.545132
54-0.02928-0.26190.60296
55-0.030542-0.27320.607288
56-0.020867-0.18660.573794
57-0.045494-0.40690.657419
580.020150.18020.428716
59-0.108009-0.96610.831538

\begin{tabular}{lllllllll}
\hline
Partial Autocorrelation Function \tabularnewline
Time lag k & PACF(k) & T-STAT & P-value \tabularnewline
0 & 0.394179 & 3.5256 & 0.000351 \tabularnewline
1 & 0.03465 & 0.3099 & 0.378714 \tabularnewline
2 & -0.048 & -0.4293 & 0.66558 \tabularnewline
3 & -0.174216 & -1.5582 & 0.938437 \tabularnewline
4 & -0.121309 & -1.085 & 0.859413 \tabularnewline
5 & -0.225928 & -2.0208 & 0.976675 \tabularnewline
6 & -0.018068 & -0.1616 & 0.563987 \tabularnewline
7 & 0.000897 & 0.008 & 0.496808 \tabularnewline
8 & 0.058392 & 0.5223 & 0.301463 \tabularnewline
9 & 0.00116 & 0.0104 & 0.495872 \tabularnewline
10 & 0.192091 & 1.7181 & 0.044822 \tabularnewline
11 & 0.658944 & 5.8938 & 0 \tabularnewline
12 & -0.317164 & -2.8368 & 0.997115 \tabularnewline
13 & -0.082178 & -0.735 & 0.767762 \tabularnewline
14 & -0.026481 & -0.2369 & 0.593313 \tabularnewline
15 & 0.008787 & 0.0786 & 0.468775 \tabularnewline
16 & -0.044241 & -0.3957 & 0.653312 \tabularnewline
17 & 0.000959 & 0.0086 & 0.496587 \tabularnewline
18 & 0.014473 & 0.1295 & 0.448663 \tabularnewline
19 & -0.112015 & -1.0019 & 0.840292 \tabularnewline
20 & -0.039497 & -0.3533 & 0.637592 \tabularnewline
21 & 0.05438 & 0.4864 & 0.314011 \tabularnewline
22 & 0.049258 & 0.4406 & 0.330355 \tabularnewline
23 & -0.021106 & -0.1888 & 0.574629 \tabularnewline
24 & -0.039352 & -0.352 & 0.637109 \tabularnewline
25 & -0.06417 & -0.574 & 0.716196 \tabularnewline
26 & -0.029441 & -0.2633 & 0.603512 \tabularnewline
27 & 0.033989 & 0.304 & 0.380957 \tabularnewline
28 & 0.057752 & 0.5166 & 0.303447 \tabularnewline
29 & -0.01132 & -0.1012 & 0.540197 \tabularnewline
30 & -0.044009 & -0.3936 & 0.65255 \tabularnewline
31 & -0.018208 & -0.1629 & 0.564478 \tabularnewline
32 & 0.011663 & 0.1043 & 0.45859 \tabularnewline
33 & 0.054481 & 0.4873 & 0.313691 \tabularnewline
34 & -0.045903 & -0.4106 & 0.658757 \tabularnewline
35 & -0.021715 & -0.1942 & 0.576753 \tabularnewline
36 & -0.049015 & -0.4384 & 0.668863 \tabularnewline
37 & 0.026867 & 0.2403 & 0.405352 \tabularnewline
38 & 0.081014 & 0.7246 & 0.235403 \tabularnewline
39 & -0.024527 & -0.2194 & 0.586541 \tabularnewline
40 & -0.132895 & -1.1886 & 0.880952 \tabularnewline
41 & 0.007141 & 0.0639 & 0.474616 \tabularnewline
42 & 0.026213 & 0.2345 & 0.407616 \tabularnewline
43 & 0.054573 & 0.4881 & 0.313401 \tabularnewline
44 & -0.046505 & -0.416 & 0.66072 \tabularnewline
45 & -0.061429 & -0.5494 & 0.707883 \tabularnewline
46 & -0.124557 & -1.1141 & 0.865709 \tabularnewline
47 & 0.067565 & 0.6043 & 0.27367 \tabularnewline
48 & 0.001435 & 0.0128 & 0.494897 \tabularnewline
49 & -0.007932 & -0.0709 & 0.528192 \tabularnewline
50 & -0.086069 & -0.7698 & 0.778164 \tabularnewline
51 & 0.035395 & 0.3166 & 0.376193 \tabularnewline
52 & -0.019393 & -0.1735 & 0.568634 \tabularnewline
53 & -0.012716 & -0.1137 & 0.545132 \tabularnewline
54 & -0.02928 & -0.2619 & 0.60296 \tabularnewline
55 & -0.030542 & -0.2732 & 0.607288 \tabularnewline
56 & -0.020867 & -0.1866 & 0.573794 \tabularnewline
57 & -0.045494 & -0.4069 & 0.657419 \tabularnewline
58 & 0.02015 & 0.1802 & 0.428716 \tabularnewline
59 & -0.108009 & -0.9661 & 0.831538 \tabularnewline
\hline
\end{tabular}
%Source: https://freestatistics.org/blog/index.php?pk=4877&T=2

[TABLE]
[ROW][C]Partial Autocorrelation Function[/C][/ROW]
[ROW][C]Time lag k[/C][C]PACF(k)[/C][C]T-STAT[/C][C]P-value[/C][/ROW]
[ROW][C]0[/C][C]0.394179[/C][C]3.5256[/C][C]0.000351[/C][/ROW]
[ROW][C]1[/C][C]0.03465[/C][C]0.3099[/C][C]0.378714[/C][/ROW]
[ROW][C]2[/C][C]-0.048[/C][C]-0.4293[/C][C]0.66558[/C][/ROW]
[ROW][C]3[/C][C]-0.174216[/C][C]-1.5582[/C][C]0.938437[/C][/ROW]
[ROW][C]4[/C][C]-0.121309[/C][C]-1.085[/C][C]0.859413[/C][/ROW]
[ROW][C]5[/C][C]-0.225928[/C][C]-2.0208[/C][C]0.976675[/C][/ROW]
[ROW][C]6[/C][C]-0.018068[/C][C]-0.1616[/C][C]0.563987[/C][/ROW]
[ROW][C]7[/C][C]0.000897[/C][C]0.008[/C][C]0.496808[/C][/ROW]
[ROW][C]8[/C][C]0.058392[/C][C]0.5223[/C][C]0.301463[/C][/ROW]
[ROW][C]9[/C][C]0.00116[/C][C]0.0104[/C][C]0.495872[/C][/ROW]
[ROW][C]10[/C][C]0.192091[/C][C]1.7181[/C][C]0.044822[/C][/ROW]
[ROW][C]11[/C][C]0.658944[/C][C]5.8938[/C][C]0[/C][/ROW]
[ROW][C]12[/C][C]-0.317164[/C][C]-2.8368[/C][C]0.997115[/C][/ROW]
[ROW][C]13[/C][C]-0.082178[/C][C]-0.735[/C][C]0.767762[/C][/ROW]
[ROW][C]14[/C][C]-0.026481[/C][C]-0.2369[/C][C]0.593313[/C][/ROW]
[ROW][C]15[/C][C]0.008787[/C][C]0.0786[/C][C]0.468775[/C][/ROW]
[ROW][C]16[/C][C]-0.044241[/C][C]-0.3957[/C][C]0.653312[/C][/ROW]
[ROW][C]17[/C][C]0.000959[/C][C]0.0086[/C][C]0.496587[/C][/ROW]
[ROW][C]18[/C][C]0.014473[/C][C]0.1295[/C][C]0.448663[/C][/ROW]
[ROW][C]19[/C][C]-0.112015[/C][C]-1.0019[/C][C]0.840292[/C][/ROW]
[ROW][C]20[/C][C]-0.039497[/C][C]-0.3533[/C][C]0.637592[/C][/ROW]
[ROW][C]21[/C][C]0.05438[/C][C]0.4864[/C][C]0.314011[/C][/ROW]
[ROW][C]22[/C][C]0.049258[/C][C]0.4406[/C][C]0.330355[/C][/ROW]
[ROW][C]23[/C][C]-0.021106[/C][C]-0.1888[/C][C]0.574629[/C][/ROW]
[ROW][C]24[/C][C]-0.039352[/C][C]-0.352[/C][C]0.637109[/C][/ROW]
[ROW][C]25[/C][C]-0.06417[/C][C]-0.574[/C][C]0.716196[/C][/ROW]
[ROW][C]26[/C][C]-0.029441[/C][C]-0.2633[/C][C]0.603512[/C][/ROW]
[ROW][C]27[/C][C]0.033989[/C][C]0.304[/C][C]0.380957[/C][/ROW]
[ROW][C]28[/C][C]0.057752[/C][C]0.5166[/C][C]0.303447[/C][/ROW]
[ROW][C]29[/C][C]-0.01132[/C][C]-0.1012[/C][C]0.540197[/C][/ROW]
[ROW][C]30[/C][C]-0.044009[/C][C]-0.3936[/C][C]0.65255[/C][/ROW]
[ROW][C]31[/C][C]-0.018208[/C][C]-0.1629[/C][C]0.564478[/C][/ROW]
[ROW][C]32[/C][C]0.011663[/C][C]0.1043[/C][C]0.45859[/C][/ROW]
[ROW][C]33[/C][C]0.054481[/C][C]0.4873[/C][C]0.313691[/C][/ROW]
[ROW][C]34[/C][C]-0.045903[/C][C]-0.4106[/C][C]0.658757[/C][/ROW]
[ROW][C]35[/C][C]-0.021715[/C][C]-0.1942[/C][C]0.576753[/C][/ROW]
[ROW][C]36[/C][C]-0.049015[/C][C]-0.4384[/C][C]0.668863[/C][/ROW]
[ROW][C]37[/C][C]0.026867[/C][C]0.2403[/C][C]0.405352[/C][/ROW]
[ROW][C]38[/C][C]0.081014[/C][C]0.7246[/C][C]0.235403[/C][/ROW]
[ROW][C]39[/C][C]-0.024527[/C][C]-0.2194[/C][C]0.586541[/C][/ROW]
[ROW][C]40[/C][C]-0.132895[/C][C]-1.1886[/C][C]0.880952[/C][/ROW]
[ROW][C]41[/C][C]0.007141[/C][C]0.0639[/C][C]0.474616[/C][/ROW]
[ROW][C]42[/C][C]0.026213[/C][C]0.2345[/C][C]0.407616[/C][/ROW]
[ROW][C]43[/C][C]0.054573[/C][C]0.4881[/C][C]0.313401[/C][/ROW]
[ROW][C]44[/C][C]-0.046505[/C][C]-0.416[/C][C]0.66072[/C][/ROW]
[ROW][C]45[/C][C]-0.061429[/C][C]-0.5494[/C][C]0.707883[/C][/ROW]
[ROW][C]46[/C][C]-0.124557[/C][C]-1.1141[/C][C]0.865709[/C][/ROW]
[ROW][C]47[/C][C]0.067565[/C][C]0.6043[/C][C]0.27367[/C][/ROW]
[ROW][C]48[/C][C]0.001435[/C][C]0.0128[/C][C]0.494897[/C][/ROW]
[ROW][C]49[/C][C]-0.007932[/C][C]-0.0709[/C][C]0.528192[/C][/ROW]
[ROW][C]50[/C][C]-0.086069[/C][C]-0.7698[/C][C]0.778164[/C][/ROW]
[ROW][C]51[/C][C]0.035395[/C][C]0.3166[/C][C]0.376193[/C][/ROW]
[ROW][C]52[/C][C]-0.019393[/C][C]-0.1735[/C][C]0.568634[/C][/ROW]
[ROW][C]53[/C][C]-0.012716[/C][C]-0.1137[/C][C]0.545132[/C][/ROW]
[ROW][C]54[/C][C]-0.02928[/C][C]-0.2619[/C][C]0.60296[/C][/ROW]
[ROW][C]55[/C][C]-0.030542[/C][C]-0.2732[/C][C]0.607288[/C][/ROW]
[ROW][C]56[/C][C]-0.020867[/C][C]-0.1866[/C][C]0.573794[/C][/ROW]
[ROW][C]57[/C][C]-0.045494[/C][C]-0.4069[/C][C]0.657419[/C][/ROW]
[ROW][C]58[/C][C]0.02015[/C][C]0.1802[/C][C]0.428716[/C][/ROW]
[ROW][C]59[/C][C]-0.108009[/C][C]-0.9661[/C][C]0.831538[/C][/ROW]
[/TABLE]
Source: https://freestatistics.org/blog/index.php?pk=4877&T=2

Globally Unique Identifier (entire table): ba.freestatistics.org/blog/index.php?pk=4877&T=2

As an alternative you can also use a QR Code:  

The GUIDs for individual cells are displayed in the table below:

Partial Autocorrelation Function
Time lag kPACF(k)T-STATP-value
00.3941793.52560.000351
10.034650.30990.378714
2-0.048-0.42930.66558
3-0.174216-1.55820.938437
4-0.121309-1.0850.859413
5-0.225928-2.02080.976675
6-0.018068-0.16160.563987
70.0008970.0080.496808
80.0583920.52230.301463
90.001160.01040.495872
100.1920911.71810.044822
110.6589445.89380
12-0.317164-2.83680.997115
13-0.082178-0.7350.767762
14-0.026481-0.23690.593313
150.0087870.07860.468775
16-0.044241-0.39570.653312
170.0009590.00860.496587
180.0144730.12950.448663
19-0.112015-1.00190.840292
20-0.039497-0.35330.637592
210.054380.48640.314011
220.0492580.44060.330355
23-0.021106-0.18880.574629
24-0.039352-0.3520.637109
25-0.06417-0.5740.716196
26-0.029441-0.26330.603512
270.0339890.3040.380957
280.0577520.51660.303447
29-0.01132-0.10120.540197
30-0.044009-0.39360.65255
31-0.018208-0.16290.564478
320.0116630.10430.45859
330.0544810.48730.313691
34-0.045903-0.41060.658757
35-0.021715-0.19420.576753
36-0.049015-0.43840.668863
370.0268670.24030.405352
380.0810140.72460.235403
39-0.024527-0.21940.586541
40-0.132895-1.18860.880952
410.0071410.06390.474616
420.0262130.23450.407616
430.0545730.48810.313401
44-0.046505-0.4160.66072
45-0.061429-0.54940.707883
46-0.124557-1.11410.865709
470.0675650.60430.27367
480.0014350.01280.494897
49-0.007932-0.07090.528192
50-0.086069-0.76980.778164
510.0353950.31660.376193
52-0.019393-0.17350.568634
53-0.012716-0.11370.545132
54-0.02928-0.26190.60296
55-0.030542-0.27320.607288
56-0.020867-0.18660.573794
57-0.045494-0.40690.657419
580.020150.18020.428716
59-0.108009-0.96610.831538


Parameters (Session):
par1 = 60 ; par2 = 1 ; par3 = 0 ; par4 = 0 ; par5 = 12 ;
Parameters (R input):
par1 = 60 ; par2 = 1 ; par3 = 0 ; par4 = 0 ; par5 = 12 ;
R code (references can be found in the software module):
if (par1 == 'Default') {
par1 = 10*log10(length(x))
} else {
par1 <- as.numeric(par1)
}
par2 <- as.numeric(par2)
par3 <- as.numeric(par3)
par4 <- as.numeric(par4)
par5 <- as.numeric(par5)
if (par2 == 0) {
x <- log(x)
} else {
x <- (x ^ par2 - 1) / par2
}
if (par3 > 0) x <- diff(x,lag=1,difference=par3)
if (par4 > 0) x <- diff(x,lag=par5,difference=par4)
bitmap(file='pic1.png')
racf <- acf(x,par1,main='Autocorrelation',xlab='lags',ylab='ACF')
dev.off()
bitmap(file='pic2.png')
rpacf <- pacf(x,par1,main='Partial Autocorrelation',xlab='lags',ylab='PACF')
dev.off()
(myacf <- c(racf$acf))
(mypacf <- c(rpacf$acf))
lengthx <- length(x)
sqrtn <- sqrt(lengthx)
load(file='createtable')
a<-table.start()
a<-table.row.start(a)
a<-table.element(a,'Autocorrelation Function',4,TRUE)
a<-table.row.end(a)
a<-table.row.start(a)
a<-table.element(a,'Time lag k',header=TRUE)
a<-table.element(a,hyperlink('basics.htm','ACF(k)','click here for more information about the Autocorrelation Function'),header=TRUE)
a<-table.element(a,'T-STAT',header=TRUE)
a<-table.element(a,'P-value',header=TRUE)
a<-table.row.end(a)
for (i in 1:par1) {
a<-table.row.start(a)
a<-table.element(a,i-1,header=TRUE)
a<-table.element(a,round(myacf[i],6))
mytstat <- myacf[i]*sqrtn
a<-table.element(a,round(mytstat,4))
a<-table.element(a,round(1-pt(mytstat,lengthx),6))
a<-table.row.end(a)
}
a<-table.end(a)
table.save(a,file='mytable.tab')
a<-table.start()
a<-table.row.start(a)
a<-table.element(a,'Partial Autocorrelation Function',4,TRUE)
a<-table.row.end(a)
a<-table.row.start(a)
a<-table.element(a,'Time lag k',header=TRUE)
a<-table.element(a,hyperlink('basics.htm','PACF(k)','click here for more information about the Partial Autocorrelation Function'),header=TRUE)
a<-table.element(a,'T-STAT',header=TRUE)
a<-table.element(a,'P-value',header=TRUE)
a<-table.row.end(a)
for (i in 1:par1) {
a<-table.row.start(a)
a<-table.element(a,i-1,header=TRUE)
a<-table.element(a,round(mypacf[i],6))
mytstat <- mypacf[i]*sqrtn
a<-table.element(a,round(mytstat,4))
a<-table.element(a,round(1-pt(mytstat,lengthx),6))
a<-table.row.end(a)
}
a<-table.end(a)
table.save(a,file='mytable1.tab')