Free Statistics

of Irreproducible Research!

Author's title

Author*Unverified author*
R Software Modulerwasp_multipleregression.wasp
Title produced by softwareMultiple Regression
Date of computationSat, 22 Dec 2007 09:30:31 -0700
Cite this page as followsStatistical Computations at FreeStatistics.org, Office for Research Development and Education, URL https://freestatistics.org/blog/index.php?v=date/2007/Dec/22/t1198339934ugo23igddcoytxn.htm/, Retrieved Sat, 04 May 2024 21:35:15 +0000
Statistical Computations at FreeStatistics.org, Office for Research Development and Education, URL https://freestatistics.org/blog/index.php?pk=4825, Retrieved Sat, 04 May 2024 21:35:15 +0000
QR Codes:

Original text written by user:
IsPrivate?No (this computation is public)
User-defined keywordsGoudkoers Inflatie
Estimated Impact266
Family? (F = Feedback message, R = changed R code, M = changed R Module, P = changed Parameters, D = changed Data)
-       [Multiple Regression] [Multiple lineair ...] [2007-12-22 16:30:31] [fea8286ffce1c0d00dd375fb36de4323] [Current]
Feedback Forum

Post a new message
Dataseries X:
10511	1.1
10812	1.3
10738	1.2
10171	1.6
9721	1.7
9897	1.5
9828	0.9
9924	1.5
10371	1.4
10846	1.6
10413	1.7
10709	1.4
10662	1.8
10570	1.7
10297	1.4
10635	1.2
10872	1
10296	1.7
10383	2.4
10431	2
10574	2.1
10653	2
10805	1.8
10872	2.7
10625	2.3
10407	1.9
10463	2
10556	2.3
10646	2.8
10702	2.4
11353	2.3
11346	2.7
11451	2.7
11964	2.9
12574	3
13031	2.2
13812	2.3
14544	2.8
14931	2.8
14886	2.8
16005	2.2
17064	2.6
15168	2.8
16050	2.5
15839	2.4
15137	2.3
14954	1.9
15648	1.7
15305	2
15579	2.1
16348	1.7
15928	1.8
16171	1.8
15937	1.8
15713	1.3
15594	1.3
15683	1.3
16438	1.2
17032	1.4
17696	2.2


Summary of compuational transaction
Raw Inputview raw input (R code)
Raw Outputview raw output of R engine
Computing time3 seconds
R Server'Gwilym Jenkins' @ 72.249.127.135

\begin{tabular}{lllllllll}
\hline
Summary of compuational transaction \tabularnewline
Raw Input & view raw input (R code)  \tabularnewline
Raw Output & view raw output of R engine  \tabularnewline
Computing time & 3 seconds \tabularnewline
R Server & 'Gwilym Jenkins' @ 72.249.127.135 \tabularnewline
\hline
\end{tabular}
%Source: https://freestatistics.org/blog/index.php?pk=4825&T=0

[TABLE]
[ROW][C]Summary of compuational transaction[/C][/ROW]
[ROW][C]Raw Input[/C][C]view raw input (R code) [/C][/ROW]
[ROW][C]Raw Output[/C][C]view raw output of R engine [/C][/ROW]
[ROW][C]Computing time[/C][C]3 seconds[/C][/ROW]
[ROW][C]R Server[/C][C]'Gwilym Jenkins' @ 72.249.127.135[/C][/ROW]
[/TABLE]
Source: https://freestatistics.org/blog/index.php?pk=4825&T=0

Globally Unique Identifier (entire table): ba.freestatistics.org/blog/index.php?pk=4825&T=0

As an alternative you can also use a QR Code:  

The GUIDs for individual cells are displayed in the table below:

Summary of compuational transaction
Raw Inputview raw input (R code)
Raw Outputview raw output of R engine
Computing time3 seconds
R Server'Gwilym Jenkins' @ 72.249.127.135


Multiple Linear Regression - Estimated Regression Equation
Goud[t] = + 9521.03968922578 -485.323390468976inflatie[t] + 70.033067018788M1[t] + 157.990803021074M2[t] + 122.483860929558M3[t] -80.0389996400236M4[t] + 7.78639731535772M5[t] + 11.9570689363958M6[t] -447.924001917602M7[t] -379.366265915322M8[t] -415.034401150561M9[t] -321.889600767041M10[t] -333.86420381166M11[t] + 140.561667425859t + e[t]

\begin{tabular}{lllllllll}
\hline
Multiple Linear Regression - Estimated Regression Equation \tabularnewline
Goud[t] =  +  9521.03968922578 -485.323390468976inflatie[t] +  70.033067018788M1[t] +  157.990803021074M2[t] +  122.483860929558M3[t] -80.0389996400236M4[t] +  7.78639731535772M5[t] +  11.9570689363958M6[t] -447.924001917602M7[t] -379.366265915322M8[t] -415.034401150561M9[t] -321.889600767041M10[t] -333.86420381166M11[t] +  140.561667425859t  + e[t] \tabularnewline
\hline
\end{tabular}
%Source: https://freestatistics.org/blog/index.php?pk=4825&T=1

[TABLE]
[ROW][C]Multiple Linear Regression - Estimated Regression Equation[/C][/ROW]
[ROW][C]Goud[t] =  +  9521.03968922578 -485.323390468976inflatie[t] +  70.033067018788M1[t] +  157.990803021074M2[t] +  122.483860929558M3[t] -80.0389996400236M4[t] +  7.78639731535772M5[t] +  11.9570689363958M6[t] -447.924001917602M7[t] -379.366265915322M8[t] -415.034401150561M9[t] -321.889600767041M10[t] -333.86420381166M11[t] +  140.561667425859t  + e[t][/C][/ROW]
[/TABLE]
Source: https://freestatistics.org/blog/index.php?pk=4825&T=1

Globally Unique Identifier (entire table): ba.freestatistics.org/blog/index.php?pk=4825&T=1

As an alternative you can also use a QR Code:  

The GUIDs for individual cells are displayed in the table below:

Multiple Linear Regression - Estimated Regression Equation
Goud[t] = + 9521.03968922578 -485.323390468976inflatie[t] + 70.033067018788M1[t] + 157.990803021074M2[t] + 122.483860929558M3[t] -80.0389996400236M4[t] + 7.78639731535772M5[t] + 11.9570689363958M6[t] -447.924001917602M7[t] -379.366265915322M8[t] -415.034401150561M9[t] -321.889600767041M10[t] -333.86420381166M11[t] + 140.561667425859t + e[t]


Multiple Linear Regression - Ordinary Least Squares
VariableParameterS.D.T-STATH0: parameter = 02-tail p-value1-tail p-value
(Intercept)9521.03968922578778.05567512.23700
inflatie-485.323390468976286.152717-1.6960.0966390.04832
M170.033067018788736.7114120.09510.9246790.462339
M2157.990803021074735.5373730.21480.8308750.415438
M3122.483860929558735.5751890.16650.8684820.434241
M4-80.0389996400236733.676362-0.10910.9136030.456802
M57.78639731535772733.1662420.01060.9915720.495786
M611.9570689363958732.17780.01630.9870410.493521
M7-447.924001917602731.746783-0.61210.5434660.271733
M8-379.366265915322731.110496-0.51890.6063250.303162
M9-415.034401150561730.798946-0.56790.5728520.286426
M10-321.889600767041730.502495-0.44060.6615370.330768
M11-333.86420381166730.59874-0.4570.6498410.32492
t140.5616674258599.17272915.323900

\begin{tabular}{lllllllll}
\hline
Multiple Linear Regression - Ordinary Least Squares \tabularnewline
Variable & Parameter & S.D. & T-STATH0: parameter = 0 & 2-tail p-value & 1-tail p-value \tabularnewline
(Intercept) & 9521.03968922578 & 778.055675 & 12.237 & 0 & 0 \tabularnewline
inflatie & -485.323390468976 & 286.152717 & -1.696 & 0.096639 & 0.04832 \tabularnewline
M1 & 70.033067018788 & 736.711412 & 0.0951 & 0.924679 & 0.462339 \tabularnewline
M2 & 157.990803021074 & 735.537373 & 0.2148 & 0.830875 & 0.415438 \tabularnewline
M3 & 122.483860929558 & 735.575189 & 0.1665 & 0.868482 & 0.434241 \tabularnewline
M4 & -80.0389996400236 & 733.676362 & -0.1091 & 0.913603 & 0.456802 \tabularnewline
M5 & 7.78639731535772 & 733.166242 & 0.0106 & 0.991572 & 0.495786 \tabularnewline
M6 & 11.9570689363958 & 732.1778 & 0.0163 & 0.987041 & 0.493521 \tabularnewline
M7 & -447.924001917602 & 731.746783 & -0.6121 & 0.543466 & 0.271733 \tabularnewline
M8 & -379.366265915322 & 731.110496 & -0.5189 & 0.606325 & 0.303162 \tabularnewline
M9 & -415.034401150561 & 730.798946 & -0.5679 & 0.572852 & 0.286426 \tabularnewline
M10 & -321.889600767041 & 730.502495 & -0.4406 & 0.661537 & 0.330768 \tabularnewline
M11 & -333.86420381166 & 730.59874 & -0.457 & 0.649841 & 0.32492 \tabularnewline
t & 140.561667425859 & 9.172729 & 15.3239 & 0 & 0 \tabularnewline
\hline
\end{tabular}
%Source: https://freestatistics.org/blog/index.php?pk=4825&T=2

[TABLE]
[ROW][C]Multiple Linear Regression - Ordinary Least Squares[/C][/ROW]
[ROW][C]Variable[/C][C]Parameter[/C][C]S.D.[/C][C]T-STATH0: parameter = 0[/C][C]2-tail p-value[/C][C]1-tail p-value[/C][/ROW]
[ROW][C](Intercept)[/C][C]9521.03968922578[/C][C]778.055675[/C][C]12.237[/C][C]0[/C][C]0[/C][/ROW]
[ROW][C]inflatie[/C][C]-485.323390468976[/C][C]286.152717[/C][C]-1.696[/C][C]0.096639[/C][C]0.04832[/C][/ROW]
[ROW][C]M1[/C][C]70.033067018788[/C][C]736.711412[/C][C]0.0951[/C][C]0.924679[/C][C]0.462339[/C][/ROW]
[ROW][C]M2[/C][C]157.990803021074[/C][C]735.537373[/C][C]0.2148[/C][C]0.830875[/C][C]0.415438[/C][/ROW]
[ROW][C]M3[/C][C]122.483860929558[/C][C]735.575189[/C][C]0.1665[/C][C]0.868482[/C][C]0.434241[/C][/ROW]
[ROW][C]M4[/C][C]-80.0389996400236[/C][C]733.676362[/C][C]-0.1091[/C][C]0.913603[/C][C]0.456802[/C][/ROW]
[ROW][C]M5[/C][C]7.78639731535772[/C][C]733.166242[/C][C]0.0106[/C][C]0.991572[/C][C]0.495786[/C][/ROW]
[ROW][C]M6[/C][C]11.9570689363958[/C][C]732.1778[/C][C]0.0163[/C][C]0.987041[/C][C]0.493521[/C][/ROW]
[ROW][C]M7[/C][C]-447.924001917602[/C][C]731.746783[/C][C]-0.6121[/C][C]0.543466[/C][C]0.271733[/C][/ROW]
[ROW][C]M8[/C][C]-379.366265915322[/C][C]731.110496[/C][C]-0.5189[/C][C]0.606325[/C][C]0.303162[/C][/ROW]
[ROW][C]M9[/C][C]-415.034401150561[/C][C]730.798946[/C][C]-0.5679[/C][C]0.572852[/C][C]0.286426[/C][/ROW]
[ROW][C]M10[/C][C]-321.889600767041[/C][C]730.502495[/C][C]-0.4406[/C][C]0.661537[/C][C]0.330768[/C][/ROW]
[ROW][C]M11[/C][C]-333.86420381166[/C][C]730.59874[/C][C]-0.457[/C][C]0.649841[/C][C]0.32492[/C][/ROW]
[ROW][C]t[/C][C]140.561667425859[/C][C]9.172729[/C][C]15.3239[/C][C]0[/C][C]0[/C][/ROW]
[/TABLE]
Source: https://freestatistics.org/blog/index.php?pk=4825&T=2

Globally Unique Identifier (entire table): ba.freestatistics.org/blog/index.php?pk=4825&T=2

As an alternative you can also use a QR Code:  

The GUIDs for individual cells are displayed in the table below:

Multiple Linear Regression - Ordinary Least Squares
VariableParameterS.D.T-STATH0: parameter = 02-tail p-value1-tail p-value
(Intercept)9521.03968922578778.05567512.23700
inflatie-485.323390468976286.152717-1.6960.0966390.04832
M170.033067018788736.7114120.09510.9246790.462339
M2157.990803021074735.5373730.21480.8308750.415438
M3122.483860929558735.5751890.16650.8684820.434241
M4-80.0389996400236733.676362-0.10910.9136030.456802
M57.78639731535772733.1662420.01060.9915720.495786
M611.9570689363958732.17780.01630.9870410.493521
M7-447.924001917602731.746783-0.61210.5434660.271733
M8-379.366265915322731.110496-0.51890.6063250.303162
M9-415.034401150561730.798946-0.56790.5728520.286426
M10-321.889600767041730.502495-0.44060.6615370.330768
M11-333.86420381166730.59874-0.4570.6498410.32492
t140.5616674258599.17272915.323900


Multiple Linear Regression - Regression Statistics
Multiple R0.91870547257001
R-squared0.844019745330085
Adjusted R-squared0.799938369010327
F-TEST (value)19.1468555611266
F-TEST (DF numerator)13
F-TEST (DF denominator)46
p-value2.48689957516035e-14
Multiple Linear Regression - Residual Statistics
Residual Standard Deviation1154.65073860238
Sum Squared Residuals61328043.095131

\begin{tabular}{lllllllll}
\hline
Multiple Linear Regression - Regression Statistics \tabularnewline
Multiple R & 0.91870547257001 \tabularnewline
R-squared & 0.844019745330085 \tabularnewline
Adjusted R-squared & 0.799938369010327 \tabularnewline
F-TEST (value) & 19.1468555611266 \tabularnewline
F-TEST (DF numerator) & 13 \tabularnewline
F-TEST (DF denominator) & 46 \tabularnewline
p-value & 2.48689957516035e-14 \tabularnewline
Multiple Linear Regression - Residual Statistics \tabularnewline
Residual Standard Deviation & 1154.65073860238 \tabularnewline
Sum Squared Residuals & 61328043.095131 \tabularnewline
\hline
\end{tabular}
%Source: https://freestatistics.org/blog/index.php?pk=4825&T=3

[TABLE]
[ROW][C]Multiple Linear Regression - Regression Statistics[/C][/ROW]
[ROW][C]Multiple R[/C][C]0.91870547257001[/C][/ROW]
[ROW][C]R-squared[/C][C]0.844019745330085[/C][/ROW]
[ROW][C]Adjusted R-squared[/C][C]0.799938369010327[/C][/ROW]
[ROW][C]F-TEST (value)[/C][C]19.1468555611266[/C][/ROW]
[ROW][C]F-TEST (DF numerator)[/C][C]13[/C][/ROW]
[ROW][C]F-TEST (DF denominator)[/C][C]46[/C][/ROW]
[ROW][C]p-value[/C][C]2.48689957516035e-14[/C][/ROW]
[ROW][C]Multiple Linear Regression - Residual Statistics[/C][/ROW]
[ROW][C]Residual Standard Deviation[/C][C]1154.65073860238[/C][/ROW]
[ROW][C]Sum Squared Residuals[/C][C]61328043.095131[/C][/ROW]
[/TABLE]
Source: https://freestatistics.org/blog/index.php?pk=4825&T=3

Globally Unique Identifier (entire table): ba.freestatistics.org/blog/index.php?pk=4825&T=3

As an alternative you can also use a QR Code:  

The GUIDs for individual cells are displayed in the table below:

Multiple Linear Regression - Regression Statistics
Multiple R0.91870547257001
R-squared0.844019745330085
Adjusted R-squared0.799938369010327
F-TEST (value)19.1468555611266
F-TEST (DF numerator)13
F-TEST (DF denominator)46
p-value2.48689957516035e-14
Multiple Linear Regression - Residual Statistics
Residual Standard Deviation1154.65073860238
Sum Squared Residuals61328043.095131


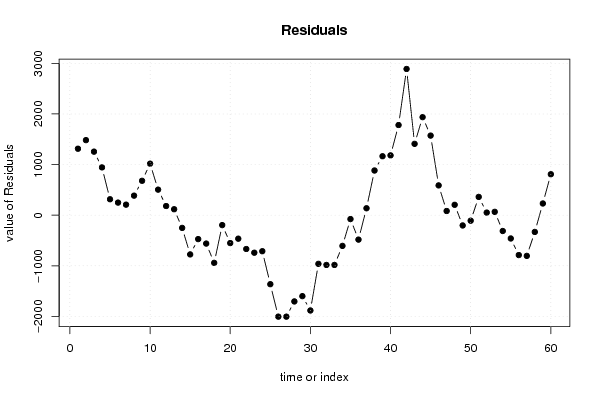
Multiple Linear Regression - Actuals, Interpolation, and Residuals
Time or IndexActualsInterpolationForecastResidualsPrediction Error
1105119197.778694154591313.22130584542
2108129329.23341948891482.7665805111
3107389482.820483870141255.17951612986
4101719226.72993453882944.270065461176
597219406.58465987317314.415340126828
698979648.38167701386248.618322986138
798289620.2563078671207.743692132889
899249538.18167701386385.818322986137
9103719691.60754825138679.392451748619
10108469828.249337966971017.75066203303
11104139908.30406330131504.695936698691
121070910528.3269516795180.673048320477
131066210544.7923299366117.207670063421
141057010821.8440724116-251.844072411618
151029711072.4958148867-775.495814886657
161063511107.5992998367-472.599299836731
171087211433.0510423118-561.051042311765
181029611238.0570080304-942.057008030382
191038310579.0112312740-196.011231273959
201043110982.2599908897-551.259990889688
211057411038.6211840334-464.621184033411
221065311320.8599908897-667.859990889688
231080511546.5117333647-741.511733364724
241087211584.1465531802-712.146553180164
251062511988.8706438124-1363.87064381240
261040712411.5194034281-2004.51940342814
271046312468.0417897156-2005.04178971558
281055612260.4835794312-1704.48357943117
291064612246.2089485779-1600.20894857792
301070212585.0706438124-1883.07064381241
311135312314.2835794312-961.283579431169
321134612329.2736266717-983.273626671717
331145112434.1671588623-983.167158862338
341196412570.8089485779-606.808948577922
351257412650.8636739123-76.8636739122658
361303113513.5482575250-482.548257524965
371381213675.6106529227136.389347077286
381454413661.4683611164882.531638883626
391493113766.52308645071164.47691354928
401488613704.5618933071181.43810669301
411600514224.14299196961780.85700803038
421706414174.74597482892889.25402517107
431516813758.3618933071409.63810669301
441605014113.07831387581936.92168612418
451583914266.50418511331572.49581488666
461513714548.7429919696588.257008030381
471495414871.459412538582.5405874615483
481564815442.9499618698205.050038130236
491530515507.9476791737-202.947679173718
501557915687.9347435550-108.934743554969
511634815987.1188250769360.881174923100
521592815876.625292886351.3747071137194
531617116105.012357267565.9876427324785
541593716249.7446963144-312.744696314419
551571316173.0869881208-460.086988120768
561559416382.2063915489-788.206391548907
571568316487.0999237395-804.099923739527
581643816769.3387305958-331.338730595804
591703216800.8611168833231.138883116751
601769616887.0282757456808.971724254413

\begin{tabular}{lllllllll}
\hline
Multiple Linear Regression - Actuals, Interpolation, and Residuals \tabularnewline
Time or Index & Actuals & InterpolationForecast & ResidualsPrediction Error \tabularnewline
1 & 10511 & 9197.77869415459 & 1313.22130584542 \tabularnewline
2 & 10812 & 9329.2334194889 & 1482.7665805111 \tabularnewline
3 & 10738 & 9482.82048387014 & 1255.17951612986 \tabularnewline
4 & 10171 & 9226.72993453882 & 944.270065461176 \tabularnewline
5 & 9721 & 9406.58465987317 & 314.415340126828 \tabularnewline
6 & 9897 & 9648.38167701386 & 248.618322986138 \tabularnewline
7 & 9828 & 9620.2563078671 & 207.743692132889 \tabularnewline
8 & 9924 & 9538.18167701386 & 385.818322986137 \tabularnewline
9 & 10371 & 9691.60754825138 & 679.392451748619 \tabularnewline
10 & 10846 & 9828.24933796697 & 1017.75066203303 \tabularnewline
11 & 10413 & 9908.30406330131 & 504.695936698691 \tabularnewline
12 & 10709 & 10528.3269516795 & 180.673048320477 \tabularnewline
13 & 10662 & 10544.7923299366 & 117.207670063421 \tabularnewline
14 & 10570 & 10821.8440724116 & -251.844072411618 \tabularnewline
15 & 10297 & 11072.4958148867 & -775.495814886657 \tabularnewline
16 & 10635 & 11107.5992998367 & -472.599299836731 \tabularnewline
17 & 10872 & 11433.0510423118 & -561.051042311765 \tabularnewline
18 & 10296 & 11238.0570080304 & -942.057008030382 \tabularnewline
19 & 10383 & 10579.0112312740 & -196.011231273959 \tabularnewline
20 & 10431 & 10982.2599908897 & -551.259990889688 \tabularnewline
21 & 10574 & 11038.6211840334 & -464.621184033411 \tabularnewline
22 & 10653 & 11320.8599908897 & -667.859990889688 \tabularnewline
23 & 10805 & 11546.5117333647 & -741.511733364724 \tabularnewline
24 & 10872 & 11584.1465531802 & -712.146553180164 \tabularnewline
25 & 10625 & 11988.8706438124 & -1363.87064381240 \tabularnewline
26 & 10407 & 12411.5194034281 & -2004.51940342814 \tabularnewline
27 & 10463 & 12468.0417897156 & -2005.04178971558 \tabularnewline
28 & 10556 & 12260.4835794312 & -1704.48357943117 \tabularnewline
29 & 10646 & 12246.2089485779 & -1600.20894857792 \tabularnewline
30 & 10702 & 12585.0706438124 & -1883.07064381241 \tabularnewline
31 & 11353 & 12314.2835794312 & -961.283579431169 \tabularnewline
32 & 11346 & 12329.2736266717 & -983.273626671717 \tabularnewline
33 & 11451 & 12434.1671588623 & -983.167158862338 \tabularnewline
34 & 11964 & 12570.8089485779 & -606.808948577922 \tabularnewline
35 & 12574 & 12650.8636739123 & -76.8636739122658 \tabularnewline
36 & 13031 & 13513.5482575250 & -482.548257524965 \tabularnewline
37 & 13812 & 13675.6106529227 & 136.389347077286 \tabularnewline
38 & 14544 & 13661.4683611164 & 882.531638883626 \tabularnewline
39 & 14931 & 13766.5230864507 & 1164.47691354928 \tabularnewline
40 & 14886 & 13704.561893307 & 1181.43810669301 \tabularnewline
41 & 16005 & 14224.1429919696 & 1780.85700803038 \tabularnewline
42 & 17064 & 14174.7459748289 & 2889.25402517107 \tabularnewline
43 & 15168 & 13758.361893307 & 1409.63810669301 \tabularnewline
44 & 16050 & 14113.0783138758 & 1936.92168612418 \tabularnewline
45 & 15839 & 14266.5041851133 & 1572.49581488666 \tabularnewline
46 & 15137 & 14548.7429919696 & 588.257008030381 \tabularnewline
47 & 14954 & 14871.4594125385 & 82.5405874615483 \tabularnewline
48 & 15648 & 15442.9499618698 & 205.050038130236 \tabularnewline
49 & 15305 & 15507.9476791737 & -202.947679173718 \tabularnewline
50 & 15579 & 15687.9347435550 & -108.934743554969 \tabularnewline
51 & 16348 & 15987.1188250769 & 360.881174923100 \tabularnewline
52 & 15928 & 15876.6252928863 & 51.3747071137194 \tabularnewline
53 & 16171 & 16105.0123572675 & 65.9876427324785 \tabularnewline
54 & 15937 & 16249.7446963144 & -312.744696314419 \tabularnewline
55 & 15713 & 16173.0869881208 & -460.086988120768 \tabularnewline
56 & 15594 & 16382.2063915489 & -788.206391548907 \tabularnewline
57 & 15683 & 16487.0999237395 & -804.099923739527 \tabularnewline
58 & 16438 & 16769.3387305958 & -331.338730595804 \tabularnewline
59 & 17032 & 16800.8611168833 & 231.138883116751 \tabularnewline
60 & 17696 & 16887.0282757456 & 808.971724254413 \tabularnewline
\hline
\end{tabular}
%Source: https://freestatistics.org/blog/index.php?pk=4825&T=4

[TABLE]
[ROW][C]Multiple Linear Regression - Actuals, Interpolation, and Residuals[/C][/ROW]
[ROW][C]Time or Index[/C][C]Actuals[/C][C]InterpolationForecast[/C][C]ResidualsPrediction Error[/C][/ROW]
[ROW][C]1[/C][C]10511[/C][C]9197.77869415459[/C][C]1313.22130584542[/C][/ROW]
[ROW][C]2[/C][C]10812[/C][C]9329.2334194889[/C][C]1482.7665805111[/C][/ROW]
[ROW][C]3[/C][C]10738[/C][C]9482.82048387014[/C][C]1255.17951612986[/C][/ROW]
[ROW][C]4[/C][C]10171[/C][C]9226.72993453882[/C][C]944.270065461176[/C][/ROW]
[ROW][C]5[/C][C]9721[/C][C]9406.58465987317[/C][C]314.415340126828[/C][/ROW]
[ROW][C]6[/C][C]9897[/C][C]9648.38167701386[/C][C]248.618322986138[/C][/ROW]
[ROW][C]7[/C][C]9828[/C][C]9620.2563078671[/C][C]207.743692132889[/C][/ROW]
[ROW][C]8[/C][C]9924[/C][C]9538.18167701386[/C][C]385.818322986137[/C][/ROW]
[ROW][C]9[/C][C]10371[/C][C]9691.60754825138[/C][C]679.392451748619[/C][/ROW]
[ROW][C]10[/C][C]10846[/C][C]9828.24933796697[/C][C]1017.75066203303[/C][/ROW]
[ROW][C]11[/C][C]10413[/C][C]9908.30406330131[/C][C]504.695936698691[/C][/ROW]
[ROW][C]12[/C][C]10709[/C][C]10528.3269516795[/C][C]180.673048320477[/C][/ROW]
[ROW][C]13[/C][C]10662[/C][C]10544.7923299366[/C][C]117.207670063421[/C][/ROW]
[ROW][C]14[/C][C]10570[/C][C]10821.8440724116[/C][C]-251.844072411618[/C][/ROW]
[ROW][C]15[/C][C]10297[/C][C]11072.4958148867[/C][C]-775.495814886657[/C][/ROW]
[ROW][C]16[/C][C]10635[/C][C]11107.5992998367[/C][C]-472.599299836731[/C][/ROW]
[ROW][C]17[/C][C]10872[/C][C]11433.0510423118[/C][C]-561.051042311765[/C][/ROW]
[ROW][C]18[/C][C]10296[/C][C]11238.0570080304[/C][C]-942.057008030382[/C][/ROW]
[ROW][C]19[/C][C]10383[/C][C]10579.0112312740[/C][C]-196.011231273959[/C][/ROW]
[ROW][C]20[/C][C]10431[/C][C]10982.2599908897[/C][C]-551.259990889688[/C][/ROW]
[ROW][C]21[/C][C]10574[/C][C]11038.6211840334[/C][C]-464.621184033411[/C][/ROW]
[ROW][C]22[/C][C]10653[/C][C]11320.8599908897[/C][C]-667.859990889688[/C][/ROW]
[ROW][C]23[/C][C]10805[/C][C]11546.5117333647[/C][C]-741.511733364724[/C][/ROW]
[ROW][C]24[/C][C]10872[/C][C]11584.1465531802[/C][C]-712.146553180164[/C][/ROW]
[ROW][C]25[/C][C]10625[/C][C]11988.8706438124[/C][C]-1363.87064381240[/C][/ROW]
[ROW][C]26[/C][C]10407[/C][C]12411.5194034281[/C][C]-2004.51940342814[/C][/ROW]
[ROW][C]27[/C][C]10463[/C][C]12468.0417897156[/C][C]-2005.04178971558[/C][/ROW]
[ROW][C]28[/C][C]10556[/C][C]12260.4835794312[/C][C]-1704.48357943117[/C][/ROW]
[ROW][C]29[/C][C]10646[/C][C]12246.2089485779[/C][C]-1600.20894857792[/C][/ROW]
[ROW][C]30[/C][C]10702[/C][C]12585.0706438124[/C][C]-1883.07064381241[/C][/ROW]
[ROW][C]31[/C][C]11353[/C][C]12314.2835794312[/C][C]-961.283579431169[/C][/ROW]
[ROW][C]32[/C][C]11346[/C][C]12329.2736266717[/C][C]-983.273626671717[/C][/ROW]
[ROW][C]33[/C][C]11451[/C][C]12434.1671588623[/C][C]-983.167158862338[/C][/ROW]
[ROW][C]34[/C][C]11964[/C][C]12570.8089485779[/C][C]-606.808948577922[/C][/ROW]
[ROW][C]35[/C][C]12574[/C][C]12650.8636739123[/C][C]-76.8636739122658[/C][/ROW]
[ROW][C]36[/C][C]13031[/C][C]13513.5482575250[/C][C]-482.548257524965[/C][/ROW]
[ROW][C]37[/C][C]13812[/C][C]13675.6106529227[/C][C]136.389347077286[/C][/ROW]
[ROW][C]38[/C][C]14544[/C][C]13661.4683611164[/C][C]882.531638883626[/C][/ROW]
[ROW][C]39[/C][C]14931[/C][C]13766.5230864507[/C][C]1164.47691354928[/C][/ROW]
[ROW][C]40[/C][C]14886[/C][C]13704.561893307[/C][C]1181.43810669301[/C][/ROW]
[ROW][C]41[/C][C]16005[/C][C]14224.1429919696[/C][C]1780.85700803038[/C][/ROW]
[ROW][C]42[/C][C]17064[/C][C]14174.7459748289[/C][C]2889.25402517107[/C][/ROW]
[ROW][C]43[/C][C]15168[/C][C]13758.361893307[/C][C]1409.63810669301[/C][/ROW]
[ROW][C]44[/C][C]16050[/C][C]14113.0783138758[/C][C]1936.92168612418[/C][/ROW]
[ROW][C]45[/C][C]15839[/C][C]14266.5041851133[/C][C]1572.49581488666[/C][/ROW]
[ROW][C]46[/C][C]15137[/C][C]14548.7429919696[/C][C]588.257008030381[/C][/ROW]
[ROW][C]47[/C][C]14954[/C][C]14871.4594125385[/C][C]82.5405874615483[/C][/ROW]
[ROW][C]48[/C][C]15648[/C][C]15442.9499618698[/C][C]205.050038130236[/C][/ROW]
[ROW][C]49[/C][C]15305[/C][C]15507.9476791737[/C][C]-202.947679173718[/C][/ROW]
[ROW][C]50[/C][C]15579[/C][C]15687.9347435550[/C][C]-108.934743554969[/C][/ROW]
[ROW][C]51[/C][C]16348[/C][C]15987.1188250769[/C][C]360.881174923100[/C][/ROW]
[ROW][C]52[/C][C]15928[/C][C]15876.6252928863[/C][C]51.3747071137194[/C][/ROW]
[ROW][C]53[/C][C]16171[/C][C]16105.0123572675[/C][C]65.9876427324785[/C][/ROW]
[ROW][C]54[/C][C]15937[/C][C]16249.7446963144[/C][C]-312.744696314419[/C][/ROW]
[ROW][C]55[/C][C]15713[/C][C]16173.0869881208[/C][C]-460.086988120768[/C][/ROW]
[ROW][C]56[/C][C]15594[/C][C]16382.2063915489[/C][C]-788.206391548907[/C][/ROW]
[ROW][C]57[/C][C]15683[/C][C]16487.0999237395[/C][C]-804.099923739527[/C][/ROW]
[ROW][C]58[/C][C]16438[/C][C]16769.3387305958[/C][C]-331.338730595804[/C][/ROW]
[ROW][C]59[/C][C]17032[/C][C]16800.8611168833[/C][C]231.138883116751[/C][/ROW]
[ROW][C]60[/C][C]17696[/C][C]16887.0282757456[/C][C]808.971724254413[/C][/ROW]
[/TABLE]
Source: https://freestatistics.org/blog/index.php?pk=4825&T=4

Globally Unique Identifier (entire table): ba.freestatistics.org/blog/index.php?pk=4825&T=4

As an alternative you can also use a QR Code:  

The GUIDs for individual cells are displayed in the table below:

Multiple Linear Regression - Actuals, Interpolation, and Residuals
Time or IndexActualsInterpolationForecastResidualsPrediction Error
1105119197.778694154591313.22130584542
2108129329.23341948891482.7665805111
3107389482.820483870141255.17951612986
4101719226.72993453882944.270065461176
597219406.58465987317314.415340126828
698979648.38167701386248.618322986138
798289620.2563078671207.743692132889
899249538.18167701386385.818322986137
9103719691.60754825138679.392451748619
10108469828.249337966971017.75066203303
11104139908.30406330131504.695936698691
121070910528.3269516795180.673048320477
131066210544.7923299366117.207670063421
141057010821.8440724116-251.844072411618
151029711072.4958148867-775.495814886657
161063511107.5992998367-472.599299836731
171087211433.0510423118-561.051042311765
181029611238.0570080304-942.057008030382
191038310579.0112312740-196.011231273959
201043110982.2599908897-551.259990889688
211057411038.6211840334-464.621184033411
221065311320.8599908897-667.859990889688
231080511546.5117333647-741.511733364724
241087211584.1465531802-712.146553180164
251062511988.8706438124-1363.87064381240
261040712411.5194034281-2004.51940342814
271046312468.0417897156-2005.04178971558
281055612260.4835794312-1704.48357943117
291064612246.2089485779-1600.20894857792
301070212585.0706438124-1883.07064381241
311135312314.2835794312-961.283579431169
321134612329.2736266717-983.273626671717
331145112434.1671588623-983.167158862338
341196412570.8089485779-606.808948577922
351257412650.8636739123-76.8636739122658
361303113513.5482575250-482.548257524965
371381213675.6106529227136.389347077286
381454413661.4683611164882.531638883626
391493113766.52308645071164.47691354928
401488613704.5618933071181.43810669301
411600514224.14299196961780.85700803038
421706414174.74597482892889.25402517107
431516813758.3618933071409.63810669301
441605014113.07831387581936.92168612418
451583914266.50418511331572.49581488666
461513714548.7429919696588.257008030381
471495414871.459412538582.5405874615483
481564815442.9499618698205.050038130236
491530515507.9476791737-202.947679173718
501557915687.9347435550-108.934743554969
511634815987.1188250769360.881174923100
521592815876.625292886351.3747071137194
531617116105.012357267565.9876427324785
541593716249.7446963144-312.744696314419
551571316173.0869881208-460.086988120768
561559416382.2063915489-788.206391548907
571568316487.0999237395-804.099923739527
581643816769.3387305958-331.338730595804
591703216800.8611168833231.138883116751
601769616887.0282757456808.971724254413


Parameters (Session):
par1 = 1 ; par2 = Include Monthly Dummies ; par3 = Linear Trend ;
Parameters (R input):
par1 = 1 ; par2 = Include Monthly Dummies ; par3 = Linear Trend ;
R code (references can be found in the software module):
library(lattice)
par1 <- as.numeric(par1)
x <- t(y)
k <- length(x[1,])
n <- length(x[,1])
x1 <- cbind(x[,par1], x[,1:k!=par1])
mycolnames <- c(colnames(x)[par1], colnames(x)[1:k!=par1])
colnames(x1) <- mycolnames #colnames(x)[par1]
x <- x1
if (par3 == 'First Differences'){
x2 <- array(0, dim=c(n-1,k), dimnames=list(1:(n-1), paste('(1-B)',colnames(x),sep='')))
for (i in 1:n-1) {
for (j in 1:k) {
x2[i,j] <- x[i+1,j] - x[i,j]
}
}
x <- x2
}
if (par2 == 'Include Monthly Dummies'){
x2 <- array(0, dim=c(n,11), dimnames=list(1:n, paste('M', seq(1:11), sep ='')))
for (i in 1:11){
x2[seq(i,n,12),i] <- 1
}
x <- cbind(x, x2)
}
if (par2 == 'Include Quarterly Dummies'){
x2 <- array(0, dim=c(n,3), dimnames=list(1:n, paste('Q', seq(1:3), sep ='')))
for (i in 1:3){
x2[seq(i,n,4),i] <- 1
}
x <- cbind(x, x2)
}
k <- length(x[1,])
if (par3 == 'Linear Trend'){
x <- cbind(x, c(1:n))
colnames(x)[k+1] <- 't'
}
x
k <- length(x[1,])
df <- as.data.frame(x)
(mylm <- lm(df))
(mysum <- summary(mylm))
bitmap(file='test0.png')
plot(x[,1], type='l', main='Actuals and Interpolation', ylab='value of Actuals and Interpolation (dots)', xlab='time or index')
points(x[,1]-mysum$resid)
grid()
dev.off()
bitmap(file='test1.png')
plot(mysum$resid, type='b', pch=19, main='Residuals', ylab='value of Residuals', xlab='time or index')
grid()
dev.off()
bitmap(file='test2.png')
hist(mysum$resid, main='Residual Histogram', xlab='values of Residuals')
grid()
dev.off()
bitmap(file='test3.png')
densityplot(~mysum$resid,col='black',main='Residual Density Plot', xlab='values of Residuals')
dev.off()
bitmap(file='test4.png')
qqnorm(mysum$resid, main='Residual Normal Q-Q Plot')
grid()
dev.off()
(myerror <- as.ts(mysum$resid))
bitmap(file='test5.png')
dum <- cbind(lag(myerror,k=1),myerror)
dum
dum1 <- dum[2:length(myerror),]
dum1
z <- as.data.frame(dum1)
z
plot(z,main=paste('Residual Lag plot, lowess, and regression line'), ylab='values of Residuals', xlab='lagged values of Residuals')
lines(lowess(z))
abline(lm(z))
grid()
dev.off()
bitmap(file='test6.png')
acf(mysum$resid, lag.max=length(mysum$resid)/2, main='Residual Autocorrelation Function')
grid()
dev.off()
bitmap(file='test7.png')
pacf(mysum$resid, lag.max=length(mysum$resid)/2, main='Residual Partial Autocorrelation Function')
grid()
dev.off()
bitmap(file='test8.png')
opar <- par(mfrow = c(2,2), oma = c(0, 0, 1.1, 0))
plot(mylm, las = 1, sub='Residual Diagnostics')
par(opar)
dev.off()
load(file='createtable')
a<-table.start()
a<-table.row.start(a)
a<-table.element(a, 'Multiple Linear Regression - Estimated Regression Equation', 1, TRUE)
a<-table.row.end(a)
myeq <- colnames(x)[1]
myeq <- paste(myeq, '[t] = ', sep='')
for (i in 1:k){
if (mysum$coefficients[i,1] > 0) myeq <- paste(myeq, '+', '')
myeq <- paste(myeq, mysum$coefficients[i,1], sep=' ')
if (rownames(mysum$coefficients)[i] != '(Intercept)') {
myeq <- paste(myeq, rownames(mysum$coefficients)[i], sep='')
if (rownames(mysum$coefficients)[i] != 't') myeq <- paste(myeq, '[t]', sep='')
}
}
myeq <- paste(myeq, ' + e[t]')
a<-table.row.start(a)
a<-table.element(a, myeq)
a<-table.row.end(a)
a<-table.end(a)
table.save(a,file='mytable1.tab')
a<-table.start()
a<-table.row.start(a)
a<-table.element(a,hyperlink('ols1.htm','Multiple Linear Regression - Ordinary Least Squares',''), 6, TRUE)
a<-table.row.end(a)
a<-table.row.start(a)
a<-table.element(a,'Variable',header=TRUE)
a<-table.element(a,'Parameter',header=TRUE)
a<-table.element(a,'S.D.',header=TRUE)
a<-table.element(a,'T-STAT
H0: parameter = 0',header=TRUE)
a<-table.element(a,'2-tail p-value',header=TRUE)
a<-table.element(a,'1-tail p-value',header=TRUE)
a<-table.row.end(a)
for (i in 1:k){
a<-table.row.start(a)
a<-table.element(a,rownames(mysum$coefficients)[i],header=TRUE)
a<-table.element(a,mysum$coefficients[i,1])
a<-table.element(a, round(mysum$coefficients[i,2],6))
a<-table.element(a, round(mysum$coefficients[i,3],4))
a<-table.element(a, round(mysum$coefficients[i,4],6))
a<-table.element(a, round(mysum$coefficients[i,4]/2,6))
a<-table.row.end(a)
}
a<-table.end(a)
table.save(a,file='mytable2.tab')
a<-table.start()
a<-table.row.start(a)
a<-table.element(a, 'Multiple Linear Regression - Regression Statistics', 2, TRUE)
a<-table.row.end(a)
a<-table.row.start(a)
a<-table.element(a, 'Multiple R',1,TRUE)
a<-table.element(a, sqrt(mysum$r.squared))
a<-table.row.end(a)
a<-table.row.start(a)
a<-table.element(a, 'R-squared',1,TRUE)
a<-table.element(a, mysum$r.squared)
a<-table.row.end(a)
a<-table.row.start(a)
a<-table.element(a, 'Adjusted R-squared',1,TRUE)
a<-table.element(a, mysum$adj.r.squared)
a<-table.row.end(a)
a<-table.row.start(a)
a<-table.element(a, 'F-TEST (value)',1,TRUE)
a<-table.element(a, mysum$fstatistic[1])
a<-table.row.end(a)
a<-table.row.start(a)
a<-table.element(a, 'F-TEST (DF numerator)',1,TRUE)
a<-table.element(a, mysum$fstatistic[2])
a<-table.row.end(a)
a<-table.row.start(a)
a<-table.element(a, 'F-TEST (DF denominator)',1,TRUE)
a<-table.element(a, mysum$fstatistic[3])
a<-table.row.end(a)
a<-table.row.start(a)
a<-table.element(a, 'p-value',1,TRUE)
a<-table.element(a, 1-pf(mysum$fstatistic[1],mysum$fstatistic[2],mysum$fstatistic[3]))
a<-table.row.end(a)
a<-table.row.start(a)
a<-table.element(a, 'Multiple Linear Regression - Residual Statistics', 2, TRUE)
a<-table.row.end(a)
a<-table.row.start(a)
a<-table.element(a, 'Residual Standard Deviation',1,TRUE)
a<-table.element(a, mysum$sigma)
a<-table.row.end(a)
a<-table.row.start(a)
a<-table.element(a, 'Sum Squared Residuals',1,TRUE)
a<-table.element(a, sum(myerror*myerror))
a<-table.row.end(a)
a<-table.end(a)
table.save(a,file='mytable3.tab')
a<-table.start()
a<-table.row.start(a)
a<-table.element(a, 'Multiple Linear Regression - Actuals, Interpolation, and Residuals', 4, TRUE)
a<-table.row.end(a)
a<-table.row.start(a)
a<-table.element(a, 'Time or Index', 1, TRUE)
a<-table.element(a, 'Actuals', 1, TRUE)
a<-table.element(a, 'Interpolation
Forecast', 1, TRUE)
a<-table.element(a, 'Residuals
Prediction Error', 1, TRUE)
a<-table.row.end(a)
for (i in 1:n) {
a<-table.row.start(a)
a<-table.element(a,i, 1, TRUE)
a<-table.element(a,x[i])
a<-table.element(a,x[i]-mysum$resid[i])
a<-table.element(a,mysum$resid[i])
a<-table.row.end(a)
}
a<-table.end(a)
table.save(a,file='mytable4.tab')