Free Statistics

of Irreproducible Research!

Author's title

Author*Unverified author*
R Software Modulerwasp_multipleregression.wasp
Title produced by softwareMultiple Regression
Date of computationFri, 21 Dec 2007 06:19:43 -0700
Cite this page as followsStatistical Computations at FreeStatistics.org, Office for Research Development and Education, URL https://freestatistics.org/blog/index.php?v=date/2007/Dec/21/t11982422859ndxbqiqcekeu6l.htm/, Retrieved Wed, 08 May 2024 02:21:14 +0000
Statistical Computations at FreeStatistics.org, Office for Research Development and Education, URL https://freestatistics.org/blog/index.php?pk=4802, Retrieved Wed, 08 May 2024 02:21:14 +0000
QR Codes:

Original text written by user:
IsPrivate?No (this computation is public)
User-defined keywords
Estimated Impact233
Family? (F = Feedback message, R = changed R code, M = changed R Module, P = changed Parameters, D = changed Data)
-       [Multiple Regression] [] [2007-12-21 13:19:43] [dd38921fafddee0dfc20da83e9650a2a] [Current]
Feedback Forum

Post a new message
Dataseries X:
8.1	359
8.3	304.6
8.2	297.7
8.1	303.3
7.7	304.7
7.6	331.3
7.7	318.8
8.2	306.8
8.4	331.1
8.4	284.1
8.6	259.7
8.4	335.8
8.5	338.5
8.7	310.3
8.7	322.1
8.6	289.3
7.4	300.8
7.3	360.6
7.4	327.3
9	304.1
9.2	362
9.2	287.8
8.5	286.1
8.3	358.2
8.3	346
8.6	329.9
8.6	334.3
8.5	303.7
8.1	307.6
8.1	351.7
8	324.6
8.6	311.9
8.7	361.5
8.7	271.1
8.6	286.5
8.4	352.8
8.4	322.4
8.7	335
8.7	322.2
8.5	313.6
8.3	323.3
8.3	379.1
8.3	315.6
8.1	353.6
8.2	371.7
8.1	282.9
8.1	298.8
7.9	361.8
7.7	365.9
8.1	357.6
8	335.4
7.7	340.1
7.8	337.8
7.6	389.6
7.4	342.5
7.7	354.6
7.8	391.6
7.5	317.7
7.2	312.8
7	356.2


Summary of compuational transaction
Raw Inputview raw input (R code)
Raw Outputview raw output of R engine
Computing time3 seconds
R Server'Gwilym Jenkins' @ 72.249.127.135

\begin{tabular}{lllllllll}
\hline
Summary of compuational transaction \tabularnewline
Raw Input & view raw input (R code)  \tabularnewline
Raw Output & view raw output of R engine  \tabularnewline
Computing time & 3 seconds \tabularnewline
R Server & 'Gwilym Jenkins' @ 72.249.127.135 \tabularnewline
\hline
\end{tabular}
%Source: https://freestatistics.org/blog/index.php?pk=4802&T=0

[TABLE]
[ROW][C]Summary of compuational transaction[/C][/ROW]
[ROW][C]Raw Input[/C][C]view raw input (R code) [/C][/ROW]
[ROW][C]Raw Output[/C][C]view raw output of R engine [/C][/ROW]
[ROW][C]Computing time[/C][C]3 seconds[/C][/ROW]
[ROW][C]R Server[/C][C]'Gwilym Jenkins' @ 72.249.127.135[/C][/ROW]
[/TABLE]
Source: https://freestatistics.org/blog/index.php?pk=4802&T=0

Globally Unique Identifier (entire table): ba.freestatistics.org/blog/index.php?pk=4802&T=0

As an alternative you can also use a QR Code:  

The GUIDs for individual cells are displayed in the table below:

Summary of compuational transaction
Raw Inputview raw input (R code)
Raw Outputview raw output of R engine
Computing time3 seconds
R Server'Gwilym Jenkins' @ 72.249.127.135


Multiple Linear Regression - Estimated Regression Equation
Iprod[t] = + 480.35014392631 -18.6911341393208werkl[t] + e[t]

\begin{tabular}{lllllllll}
\hline
Multiple Linear Regression - Estimated Regression Equation \tabularnewline
Iprod[t] =  +  480.35014392631 -18.6911341393208werkl[t]  + e[t] \tabularnewline
\hline
\end{tabular}
%Source: https://freestatistics.org/blog/index.php?pk=4802&T=1

[TABLE]
[ROW][C]Multiple Linear Regression - Estimated Regression Equation[/C][/ROW]
[ROW][C]Iprod[t] =  +  480.35014392631 -18.6911341393208werkl[t]  + e[t][/C][/ROW]
[/TABLE]
Source: https://freestatistics.org/blog/index.php?pk=4802&T=1

Globally Unique Identifier (entire table): ba.freestatistics.org/blog/index.php?pk=4802&T=1

As an alternative you can also use a QR Code:  

The GUIDs for individual cells are displayed in the table below:

Multiple Linear Regression - Estimated Regression Equation
Iprod[t] = + 480.35014392631 -18.6911341393208werkl[t] + e[t]


Multiple Linear Regression - Ordinary Least Squares
VariableParameterS.D.T-STATH0: parameter = 02-tail p-value1-tail p-value
(Intercept)480.3501439263162.4342647.693700
werkl-18.69113413932087.619376-2.45310.017190.008595

\begin{tabular}{lllllllll}
\hline
Multiple Linear Regression - Ordinary Least Squares \tabularnewline
Variable & Parameter & S.D. & T-STATH0: parameter = 0 & 2-tail p-value & 1-tail p-value \tabularnewline
(Intercept) & 480.35014392631 & 62.434264 & 7.6937 & 0 & 0 \tabularnewline
werkl & -18.6911341393208 & 7.619376 & -2.4531 & 0.01719 & 0.008595 \tabularnewline
\hline
\end{tabular}
%Source: https://freestatistics.org/blog/index.php?pk=4802&T=2

[TABLE]
[ROW][C]Multiple Linear Regression - Ordinary Least Squares[/C][/ROW]
[ROW][C]Variable[/C][C]Parameter[/C][C]S.D.[/C][C]T-STATH0: parameter = 0[/C][C]2-tail p-value[/C][C]1-tail p-value[/C][/ROW]
[ROW][C](Intercept)[/C][C]480.35014392631[/C][C]62.434264[/C][C]7.6937[/C][C]0[/C][C]0[/C][/ROW]
[ROW][C]werkl[/C][C]-18.6911341393208[/C][C]7.619376[/C][C]-2.4531[/C][C]0.01719[/C][C]0.008595[/C][/ROW]
[/TABLE]
Source: https://freestatistics.org/blog/index.php?pk=4802&T=2

Globally Unique Identifier (entire table): ba.freestatistics.org/blog/index.php?pk=4802&T=2

As an alternative you can also use a QR Code:  

The GUIDs for individual cells are displayed in the table below:

Multiple Linear Regression - Ordinary Least Squares
VariableParameterS.D.T-STATH0: parameter = 02-tail p-value1-tail p-value
(Intercept)480.3501439263162.4342647.693700
werkl-18.69113413932087.619376-2.45310.017190.008595


Multiple Linear Regression - Regression Statistics
Multiple R0.306595751824479
R-squared0.0940009550368178
Adjusted R-squared0.0783802818477976
F-TEST (value)6.0177275268066
F-TEST (DF numerator)1
F-TEST (DF denominator)58
p-value0.0171902079089168
Multiple Linear Regression - Residual Statistics
Residual Standard Deviation28.4030054508137
Sum Squared Residuals46790.3816810592

\begin{tabular}{lllllllll}
\hline
Multiple Linear Regression - Regression Statistics \tabularnewline
Multiple R & 0.306595751824479 \tabularnewline
R-squared & 0.0940009550368178 \tabularnewline
Adjusted R-squared & 0.0783802818477976 \tabularnewline
F-TEST (value) & 6.0177275268066 \tabularnewline
F-TEST (DF numerator) & 1 \tabularnewline
F-TEST (DF denominator) & 58 \tabularnewline
p-value & 0.0171902079089168 \tabularnewline
Multiple Linear Regression - Residual Statistics \tabularnewline
Residual Standard Deviation & 28.4030054508137 \tabularnewline
Sum Squared Residuals & 46790.3816810592 \tabularnewline
\hline
\end{tabular}
%Source: https://freestatistics.org/blog/index.php?pk=4802&T=3

[TABLE]
[ROW][C]Multiple Linear Regression - Regression Statistics[/C][/ROW]
[ROW][C]Multiple R[/C][C]0.306595751824479[/C][/ROW]
[ROW][C]R-squared[/C][C]0.0940009550368178[/C][/ROW]
[ROW][C]Adjusted R-squared[/C][C]0.0783802818477976[/C][/ROW]
[ROW][C]F-TEST (value)[/C][C]6.0177275268066[/C][/ROW]
[ROW][C]F-TEST (DF numerator)[/C][C]1[/C][/ROW]
[ROW][C]F-TEST (DF denominator)[/C][C]58[/C][/ROW]
[ROW][C]p-value[/C][C]0.0171902079089168[/C][/ROW]
[ROW][C]Multiple Linear Regression - Residual Statistics[/C][/ROW]
[ROW][C]Residual Standard Deviation[/C][C]28.4030054508137[/C][/ROW]
[ROW][C]Sum Squared Residuals[/C][C]46790.3816810592[/C][/ROW]
[/TABLE]
Source: https://freestatistics.org/blog/index.php?pk=4802&T=3

Globally Unique Identifier (entire table): ba.freestatistics.org/blog/index.php?pk=4802&T=3

As an alternative you can also use a QR Code:  

The GUIDs for individual cells are displayed in the table below:

Multiple Linear Regression - Regression Statistics
Multiple R0.306595751824479
R-squared0.0940009550368178
Adjusted R-squared0.0783802818477976
F-TEST (value)6.0177275268066
F-TEST (DF numerator)1
F-TEST (DF denominator)58
p-value0.0171902079089168
Multiple Linear Regression - Residual Statistics
Residual Standard Deviation28.4030054508137
Sum Squared Residuals46790.3816810592


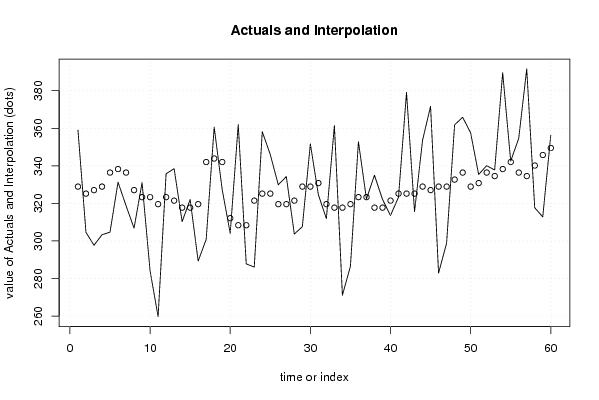
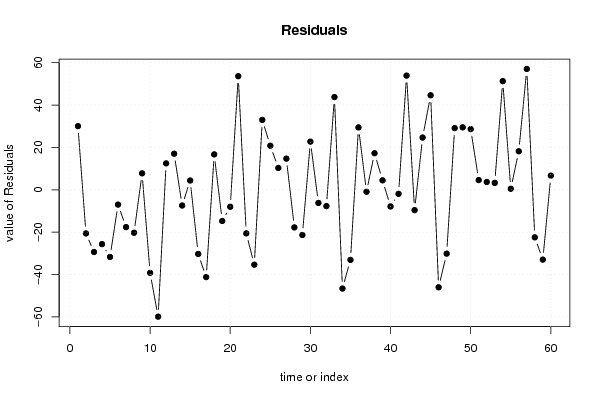
Multiple Linear Regression - Actuals, Interpolation, and Residuals
Time or IndexActualsInterpolationForecastResidualsPrediction Error
1359328.95195739781430.0480426021856
2304.6325.213730569948-20.6137305699481
3297.7327.08284398388-29.3828439838802
4303.3328.951957397812-25.6519573978123
5304.7336.428411053541-31.7284110535406
6331.3338.297524467473-6.99752446747267
7318.8336.428411053541-17.6284110535406
8306.8327.08284398388-20.2828439838802
9331.1323.3446171560167.75538284398396
10284.1323.344617156016-39.244617156016
11259.7319.606390328152-59.9063903281519
12335.8323.34461715601612.4553828439840
13338.5321.47550374208417.024496257916
14310.3317.73727691422-7.43727691421984
15322.1317.737276914224.36272308578017
16289.3319.606390328152-30.3063903281519
17300.8342.035751295337-41.2357512953368
18360.6343.90486470926916.6951352907311
19327.3342.035751295337-14.7357512953368
20304.1312.129936672424-8.02993667242359
21362308.39170984455953.6082901554405
22287.8308.391709844559-20.5917098445595
23286.1321.475503742084-35.375503742084
24358.2325.21373056994832.9862694300519
25346325.21373056994820.7862694300519
26329.9319.60639032815210.2936096718481
27334.3319.60639032815214.6936096718481
28303.7321.475503742084-17.775503742084
29307.6328.951957397812-21.3519573978123
30351.7328.95195739781222.7480426021877
31324.6330.821070811744-6.22107081174435
32311.9319.606390328152-7.70639032815195
33361.5317.7372769142243.7627230857802
34271.1317.73727691422-46.6372769142198
35286.5319.606390328152-33.1063903281519
36352.8323.34461715601629.4553828439839
37322.4323.344617156016-0.944617156016084
38335317.7372769142217.2627230857801
39322.2317.737276914224.46272308578014
40313.6321.475503742084-7.87550374208397
41323.3325.213730569948-1.91373056994812
42379.1325.21373056994853.8862694300519
43315.6325.213730569948-9.6137305699481
44353.6328.95195739781224.6480426021877
45371.7327.0828439838844.6171560161198
46282.9328.951957397812-46.0519573978123
47298.8328.951957397812-30.1519573978123
48361.8332.69018422567629.1098157743236
49365.9336.42841105354129.4715889464594
50357.6328.95195739781228.6480426021877
51335.4330.8210708117444.57892918825560
52340.1336.4284110535413.67158894645942
53337.8334.5592976396093.24070236039148
54389.6338.29752446747351.3024755325273
55342.5342.0357512953370.464248704663175
56354.6336.42841105354118.1715889464594
57391.6334.55929763960957.0407023603915
58317.7340.166637881405-22.4666378814048
59312.8345.773978123201-32.973978123201
60356.2349.5122049510656.68779504893485

\begin{tabular}{lllllllll}
\hline
Multiple Linear Regression - Actuals, Interpolation, and Residuals \tabularnewline
Time or Index & Actuals & InterpolationForecast & ResidualsPrediction Error \tabularnewline
1 & 359 & 328.951957397814 & 30.0480426021856 \tabularnewline
2 & 304.6 & 325.213730569948 & -20.6137305699481 \tabularnewline
3 & 297.7 & 327.08284398388 & -29.3828439838802 \tabularnewline
4 & 303.3 & 328.951957397812 & -25.6519573978123 \tabularnewline
5 & 304.7 & 336.428411053541 & -31.7284110535406 \tabularnewline
6 & 331.3 & 338.297524467473 & -6.99752446747267 \tabularnewline
7 & 318.8 & 336.428411053541 & -17.6284110535406 \tabularnewline
8 & 306.8 & 327.08284398388 & -20.2828439838802 \tabularnewline
9 & 331.1 & 323.344617156016 & 7.75538284398396 \tabularnewline
10 & 284.1 & 323.344617156016 & -39.244617156016 \tabularnewline
11 & 259.7 & 319.606390328152 & -59.9063903281519 \tabularnewline
12 & 335.8 & 323.344617156016 & 12.4553828439840 \tabularnewline
13 & 338.5 & 321.475503742084 & 17.024496257916 \tabularnewline
14 & 310.3 & 317.73727691422 & -7.43727691421984 \tabularnewline
15 & 322.1 & 317.73727691422 & 4.36272308578017 \tabularnewline
16 & 289.3 & 319.606390328152 & -30.3063903281519 \tabularnewline
17 & 300.8 & 342.035751295337 & -41.2357512953368 \tabularnewline
18 & 360.6 & 343.904864709269 & 16.6951352907311 \tabularnewline
19 & 327.3 & 342.035751295337 & -14.7357512953368 \tabularnewline
20 & 304.1 & 312.129936672424 & -8.02993667242359 \tabularnewline
21 & 362 & 308.391709844559 & 53.6082901554405 \tabularnewline
22 & 287.8 & 308.391709844559 & -20.5917098445595 \tabularnewline
23 & 286.1 & 321.475503742084 & -35.375503742084 \tabularnewline
24 & 358.2 & 325.213730569948 & 32.9862694300519 \tabularnewline
25 & 346 & 325.213730569948 & 20.7862694300519 \tabularnewline
26 & 329.9 & 319.606390328152 & 10.2936096718481 \tabularnewline
27 & 334.3 & 319.606390328152 & 14.6936096718481 \tabularnewline
28 & 303.7 & 321.475503742084 & -17.775503742084 \tabularnewline
29 & 307.6 & 328.951957397812 & -21.3519573978123 \tabularnewline
30 & 351.7 & 328.951957397812 & 22.7480426021877 \tabularnewline
31 & 324.6 & 330.821070811744 & -6.22107081174435 \tabularnewline
32 & 311.9 & 319.606390328152 & -7.70639032815195 \tabularnewline
33 & 361.5 & 317.73727691422 & 43.7627230857802 \tabularnewline
34 & 271.1 & 317.73727691422 & -46.6372769142198 \tabularnewline
35 & 286.5 & 319.606390328152 & -33.1063903281519 \tabularnewline
36 & 352.8 & 323.344617156016 & 29.4553828439839 \tabularnewline
37 & 322.4 & 323.344617156016 & -0.944617156016084 \tabularnewline
38 & 335 & 317.73727691422 & 17.2627230857801 \tabularnewline
39 & 322.2 & 317.73727691422 & 4.46272308578014 \tabularnewline
40 & 313.6 & 321.475503742084 & -7.87550374208397 \tabularnewline
41 & 323.3 & 325.213730569948 & -1.91373056994812 \tabularnewline
42 & 379.1 & 325.213730569948 & 53.8862694300519 \tabularnewline
43 & 315.6 & 325.213730569948 & -9.6137305699481 \tabularnewline
44 & 353.6 & 328.951957397812 & 24.6480426021877 \tabularnewline
45 & 371.7 & 327.08284398388 & 44.6171560161198 \tabularnewline
46 & 282.9 & 328.951957397812 & -46.0519573978123 \tabularnewline
47 & 298.8 & 328.951957397812 & -30.1519573978123 \tabularnewline
48 & 361.8 & 332.690184225676 & 29.1098157743236 \tabularnewline
49 & 365.9 & 336.428411053541 & 29.4715889464594 \tabularnewline
50 & 357.6 & 328.951957397812 & 28.6480426021877 \tabularnewline
51 & 335.4 & 330.821070811744 & 4.57892918825560 \tabularnewline
52 & 340.1 & 336.428411053541 & 3.67158894645942 \tabularnewline
53 & 337.8 & 334.559297639609 & 3.24070236039148 \tabularnewline
54 & 389.6 & 338.297524467473 & 51.3024755325273 \tabularnewline
55 & 342.5 & 342.035751295337 & 0.464248704663175 \tabularnewline
56 & 354.6 & 336.428411053541 & 18.1715889464594 \tabularnewline
57 & 391.6 & 334.559297639609 & 57.0407023603915 \tabularnewline
58 & 317.7 & 340.166637881405 & -22.4666378814048 \tabularnewline
59 & 312.8 & 345.773978123201 & -32.973978123201 \tabularnewline
60 & 356.2 & 349.512204951065 & 6.68779504893485 \tabularnewline
\hline
\end{tabular}
%Source: https://freestatistics.org/blog/index.php?pk=4802&T=4

[TABLE]
[ROW][C]Multiple Linear Regression - Actuals, Interpolation, and Residuals[/C][/ROW]
[ROW][C]Time or Index[/C][C]Actuals[/C][C]InterpolationForecast[/C][C]ResidualsPrediction Error[/C][/ROW]
[ROW][C]1[/C][C]359[/C][C]328.951957397814[/C][C]30.0480426021856[/C][/ROW]
[ROW][C]2[/C][C]304.6[/C][C]325.213730569948[/C][C]-20.6137305699481[/C][/ROW]
[ROW][C]3[/C][C]297.7[/C][C]327.08284398388[/C][C]-29.3828439838802[/C][/ROW]
[ROW][C]4[/C][C]303.3[/C][C]328.951957397812[/C][C]-25.6519573978123[/C][/ROW]
[ROW][C]5[/C][C]304.7[/C][C]336.428411053541[/C][C]-31.7284110535406[/C][/ROW]
[ROW][C]6[/C][C]331.3[/C][C]338.297524467473[/C][C]-6.99752446747267[/C][/ROW]
[ROW][C]7[/C][C]318.8[/C][C]336.428411053541[/C][C]-17.6284110535406[/C][/ROW]
[ROW][C]8[/C][C]306.8[/C][C]327.08284398388[/C][C]-20.2828439838802[/C][/ROW]
[ROW][C]9[/C][C]331.1[/C][C]323.344617156016[/C][C]7.75538284398396[/C][/ROW]
[ROW][C]10[/C][C]284.1[/C][C]323.344617156016[/C][C]-39.244617156016[/C][/ROW]
[ROW][C]11[/C][C]259.7[/C][C]319.606390328152[/C][C]-59.9063903281519[/C][/ROW]
[ROW][C]12[/C][C]335.8[/C][C]323.344617156016[/C][C]12.4553828439840[/C][/ROW]
[ROW][C]13[/C][C]338.5[/C][C]321.475503742084[/C][C]17.024496257916[/C][/ROW]
[ROW][C]14[/C][C]310.3[/C][C]317.73727691422[/C][C]-7.43727691421984[/C][/ROW]
[ROW][C]15[/C][C]322.1[/C][C]317.73727691422[/C][C]4.36272308578017[/C][/ROW]
[ROW][C]16[/C][C]289.3[/C][C]319.606390328152[/C][C]-30.3063903281519[/C][/ROW]
[ROW][C]17[/C][C]300.8[/C][C]342.035751295337[/C][C]-41.2357512953368[/C][/ROW]
[ROW][C]18[/C][C]360.6[/C][C]343.904864709269[/C][C]16.6951352907311[/C][/ROW]
[ROW][C]19[/C][C]327.3[/C][C]342.035751295337[/C][C]-14.7357512953368[/C][/ROW]
[ROW][C]20[/C][C]304.1[/C][C]312.129936672424[/C][C]-8.02993667242359[/C][/ROW]
[ROW][C]21[/C][C]362[/C][C]308.391709844559[/C][C]53.6082901554405[/C][/ROW]
[ROW][C]22[/C][C]287.8[/C][C]308.391709844559[/C][C]-20.5917098445595[/C][/ROW]
[ROW][C]23[/C][C]286.1[/C][C]321.475503742084[/C][C]-35.375503742084[/C][/ROW]
[ROW][C]24[/C][C]358.2[/C][C]325.213730569948[/C][C]32.9862694300519[/C][/ROW]
[ROW][C]25[/C][C]346[/C][C]325.213730569948[/C][C]20.7862694300519[/C][/ROW]
[ROW][C]26[/C][C]329.9[/C][C]319.606390328152[/C][C]10.2936096718481[/C][/ROW]
[ROW][C]27[/C][C]334.3[/C][C]319.606390328152[/C][C]14.6936096718481[/C][/ROW]
[ROW][C]28[/C][C]303.7[/C][C]321.475503742084[/C][C]-17.775503742084[/C][/ROW]
[ROW][C]29[/C][C]307.6[/C][C]328.951957397812[/C][C]-21.3519573978123[/C][/ROW]
[ROW][C]30[/C][C]351.7[/C][C]328.951957397812[/C][C]22.7480426021877[/C][/ROW]
[ROW][C]31[/C][C]324.6[/C][C]330.821070811744[/C][C]-6.22107081174435[/C][/ROW]
[ROW][C]32[/C][C]311.9[/C][C]319.606390328152[/C][C]-7.70639032815195[/C][/ROW]
[ROW][C]33[/C][C]361.5[/C][C]317.73727691422[/C][C]43.7627230857802[/C][/ROW]
[ROW][C]34[/C][C]271.1[/C][C]317.73727691422[/C][C]-46.6372769142198[/C][/ROW]
[ROW][C]35[/C][C]286.5[/C][C]319.606390328152[/C][C]-33.1063903281519[/C][/ROW]
[ROW][C]36[/C][C]352.8[/C][C]323.344617156016[/C][C]29.4553828439839[/C][/ROW]
[ROW][C]37[/C][C]322.4[/C][C]323.344617156016[/C][C]-0.944617156016084[/C][/ROW]
[ROW][C]38[/C][C]335[/C][C]317.73727691422[/C][C]17.2627230857801[/C][/ROW]
[ROW][C]39[/C][C]322.2[/C][C]317.73727691422[/C][C]4.46272308578014[/C][/ROW]
[ROW][C]40[/C][C]313.6[/C][C]321.475503742084[/C][C]-7.87550374208397[/C][/ROW]
[ROW][C]41[/C][C]323.3[/C][C]325.213730569948[/C][C]-1.91373056994812[/C][/ROW]
[ROW][C]42[/C][C]379.1[/C][C]325.213730569948[/C][C]53.8862694300519[/C][/ROW]
[ROW][C]43[/C][C]315.6[/C][C]325.213730569948[/C][C]-9.6137305699481[/C][/ROW]
[ROW][C]44[/C][C]353.6[/C][C]328.951957397812[/C][C]24.6480426021877[/C][/ROW]
[ROW][C]45[/C][C]371.7[/C][C]327.08284398388[/C][C]44.6171560161198[/C][/ROW]
[ROW][C]46[/C][C]282.9[/C][C]328.951957397812[/C][C]-46.0519573978123[/C][/ROW]
[ROW][C]47[/C][C]298.8[/C][C]328.951957397812[/C][C]-30.1519573978123[/C][/ROW]
[ROW][C]48[/C][C]361.8[/C][C]332.690184225676[/C][C]29.1098157743236[/C][/ROW]
[ROW][C]49[/C][C]365.9[/C][C]336.428411053541[/C][C]29.4715889464594[/C][/ROW]
[ROW][C]50[/C][C]357.6[/C][C]328.951957397812[/C][C]28.6480426021877[/C][/ROW]
[ROW][C]51[/C][C]335.4[/C][C]330.821070811744[/C][C]4.57892918825560[/C][/ROW]
[ROW][C]52[/C][C]340.1[/C][C]336.428411053541[/C][C]3.67158894645942[/C][/ROW]
[ROW][C]53[/C][C]337.8[/C][C]334.559297639609[/C][C]3.24070236039148[/C][/ROW]
[ROW][C]54[/C][C]389.6[/C][C]338.297524467473[/C][C]51.3024755325273[/C][/ROW]
[ROW][C]55[/C][C]342.5[/C][C]342.035751295337[/C][C]0.464248704663175[/C][/ROW]
[ROW][C]56[/C][C]354.6[/C][C]336.428411053541[/C][C]18.1715889464594[/C][/ROW]
[ROW][C]57[/C][C]391.6[/C][C]334.559297639609[/C][C]57.0407023603915[/C][/ROW]
[ROW][C]58[/C][C]317.7[/C][C]340.166637881405[/C][C]-22.4666378814048[/C][/ROW]
[ROW][C]59[/C][C]312.8[/C][C]345.773978123201[/C][C]-32.973978123201[/C][/ROW]
[ROW][C]60[/C][C]356.2[/C][C]349.512204951065[/C][C]6.68779504893485[/C][/ROW]
[/TABLE]
Source: https://freestatistics.org/blog/index.php?pk=4802&T=4

Globally Unique Identifier (entire table): ba.freestatistics.org/blog/index.php?pk=4802&T=4

As an alternative you can also use a QR Code:  

The GUIDs for individual cells are displayed in the table below:

Multiple Linear Regression - Actuals, Interpolation, and Residuals
Time or IndexActualsInterpolationForecastResidualsPrediction Error
1359328.95195739781430.0480426021856
2304.6325.213730569948-20.6137305699481
3297.7327.08284398388-29.3828439838802
4303.3328.951957397812-25.6519573978123
5304.7336.428411053541-31.7284110535406
6331.3338.297524467473-6.99752446747267
7318.8336.428411053541-17.6284110535406
8306.8327.08284398388-20.2828439838802
9331.1323.3446171560167.75538284398396
10284.1323.344617156016-39.244617156016
11259.7319.606390328152-59.9063903281519
12335.8323.34461715601612.4553828439840
13338.5321.47550374208417.024496257916
14310.3317.73727691422-7.43727691421984
15322.1317.737276914224.36272308578017
16289.3319.606390328152-30.3063903281519
17300.8342.035751295337-41.2357512953368
18360.6343.90486470926916.6951352907311
19327.3342.035751295337-14.7357512953368
20304.1312.129936672424-8.02993667242359
21362308.39170984455953.6082901554405
22287.8308.391709844559-20.5917098445595
23286.1321.475503742084-35.375503742084
24358.2325.21373056994832.9862694300519
25346325.21373056994820.7862694300519
26329.9319.60639032815210.2936096718481
27334.3319.60639032815214.6936096718481
28303.7321.475503742084-17.775503742084
29307.6328.951957397812-21.3519573978123
30351.7328.95195739781222.7480426021877
31324.6330.821070811744-6.22107081174435
32311.9319.606390328152-7.70639032815195
33361.5317.7372769142243.7627230857802
34271.1317.73727691422-46.6372769142198
35286.5319.606390328152-33.1063903281519
36352.8323.34461715601629.4553828439839
37322.4323.344617156016-0.944617156016084
38335317.7372769142217.2627230857801
39322.2317.737276914224.46272308578014
40313.6321.475503742084-7.87550374208397
41323.3325.213730569948-1.91373056994812
42379.1325.21373056994853.8862694300519
43315.6325.213730569948-9.6137305699481
44353.6328.95195739781224.6480426021877
45371.7327.0828439838844.6171560161198
46282.9328.951957397812-46.0519573978123
47298.8328.951957397812-30.1519573978123
48361.8332.69018422567629.1098157743236
49365.9336.42841105354129.4715889464594
50357.6328.95195739781228.6480426021877
51335.4330.8210708117444.57892918825560
52340.1336.4284110535413.67158894645942
53337.8334.5592976396093.24070236039148
54389.6338.29752446747351.3024755325273
55342.5342.0357512953370.464248704663175
56354.6336.42841105354118.1715889464594
57391.6334.55929763960957.0407023603915
58317.7340.166637881405-22.4666378814048
59312.8345.773978123201-32.973978123201
60356.2349.5122049510656.68779504893485


Parameters (Session):
par1 = 2 ; par2 = Do not include Seasonal Dummies ; par3 = No Linear Trend ;
Parameters (R input):
par1 = 2 ; par2 = Do not include Seasonal Dummies ; par3 = No Linear Trend ;
R code (references can be found in the software module):
library(lattice)
par1 <- as.numeric(par1)
x <- t(y)
k <- length(x[1,])
n <- length(x[,1])
x1 <- cbind(x[,par1], x[,1:k!=par1])
mycolnames <- c(colnames(x)[par1], colnames(x)[1:k!=par1])
colnames(x1) <- mycolnames #colnames(x)[par1]
x <- x1
if (par3 == 'First Differences'){
x2 <- array(0, dim=c(n-1,k), dimnames=list(1:(n-1), paste('(1-B)',colnames(x),sep='')))
for (i in 1:n-1) {
for (j in 1:k) {
x2[i,j] <- x[i+1,j] - x[i,j]
}
}
x <- x2
}
if (par2 == 'Include Monthly Dummies'){
x2 <- array(0, dim=c(n,11), dimnames=list(1:n, paste('M', seq(1:11), sep ='')))
for (i in 1:11){
x2[seq(i,n,12),i] <- 1
}
x <- cbind(x, x2)
}
if (par2 == 'Include Quarterly Dummies'){
x2 <- array(0, dim=c(n,3), dimnames=list(1:n, paste('Q', seq(1:3), sep ='')))
for (i in 1:3){
x2[seq(i,n,4),i] <- 1
}
x <- cbind(x, x2)
}
k <- length(x[1,])
if (par3 == 'Linear Trend'){
x <- cbind(x, c(1:n))
colnames(x)[k+1] <- 't'
}
x
k <- length(x[1,])
df <- as.data.frame(x)
(mylm <- lm(df))
(mysum <- summary(mylm))
bitmap(file='test0.png')
plot(x[,1], type='l', main='Actuals and Interpolation', ylab='value of Actuals and Interpolation (dots)', xlab='time or index')
points(x[,1]-mysum$resid)
grid()
dev.off()
bitmap(file='test1.png')
plot(mysum$resid, type='b', pch=19, main='Residuals', ylab='value of Residuals', xlab='time or index')
grid()
dev.off()
bitmap(file='test2.png')
hist(mysum$resid, main='Residual Histogram', xlab='values of Residuals')
grid()
dev.off()
bitmap(file='test3.png')
densityplot(~mysum$resid,col='black',main='Residual Density Plot', xlab='values of Residuals')
dev.off()
bitmap(file='test4.png')
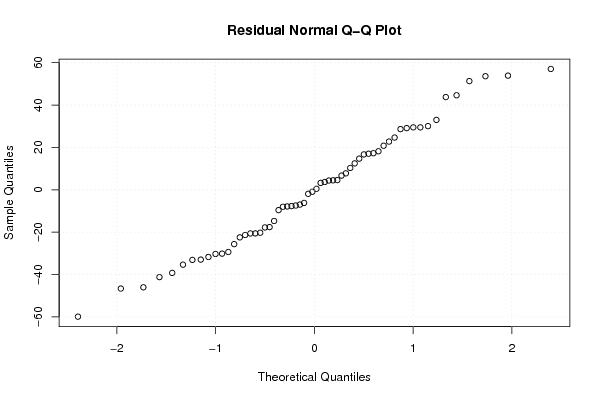
qqnorm(mysum$resid, main='Residual Normal Q-Q Plot')
grid()
dev.off()
(myerror <- as.ts(mysum$resid))
bitmap(file='test5.png')
dum <- cbind(lag(myerror,k=1),myerror)
dum
dum1 <- dum[2:length(myerror),]
dum1
z <- as.data.frame(dum1)
z
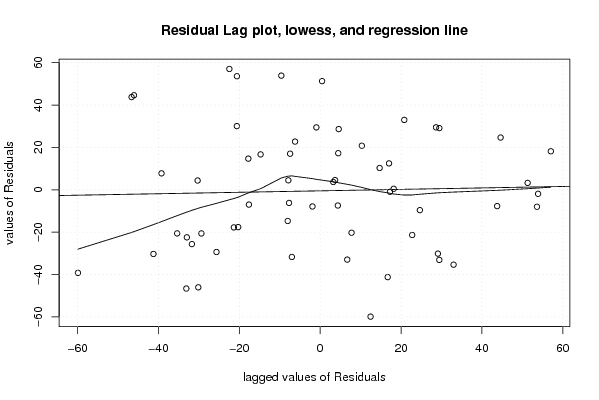
plot(z,main=paste('Residual Lag plot, lowess, and regression line'), ylab='values of Residuals', xlab='lagged values of Residuals')
lines(lowess(z))
abline(lm(z))
grid()
dev.off()
bitmap(file='test6.png')
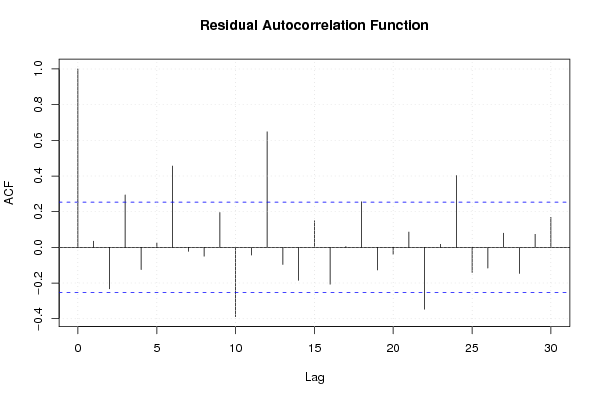
acf(mysum$resid, lag.max=length(mysum$resid)/2, main='Residual Autocorrelation Function')
grid()
dev.off()
bitmap(file='test7.png')
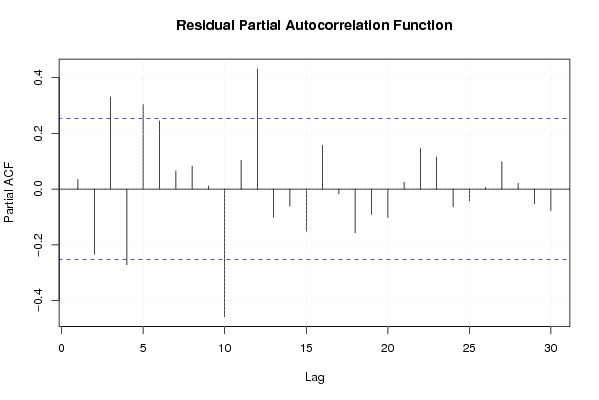
pacf(mysum$resid, lag.max=length(mysum$resid)/2, main='Residual Partial Autocorrelation Function')
grid()
dev.off()
bitmap(file='test8.png')
opar <- par(mfrow = c(2,2), oma = c(0, 0, 1.1, 0))
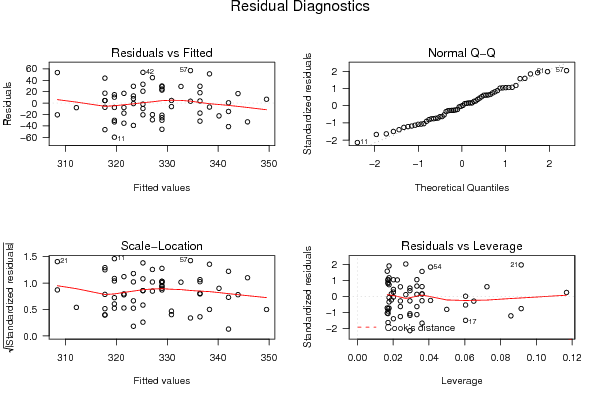
plot(mylm, las = 1, sub='Residual Diagnostics')
par(opar)
dev.off()
load(file='createtable')
a<-table.start()
a<-table.row.start(a)
a<-table.element(a, 'Multiple Linear Regression - Estimated Regression Equation', 1, TRUE)
a<-table.row.end(a)
myeq <- colnames(x)[1]
myeq <- paste(myeq, '[t] = ', sep='')
for (i in 1:k){
if (mysum$coefficients[i,1] > 0) myeq <- paste(myeq, '+', '')
myeq <- paste(myeq, mysum$coefficients[i,1], sep=' ')
if (rownames(mysum$coefficients)[i] != '(Intercept)') {
myeq <- paste(myeq, rownames(mysum$coefficients)[i], sep='')
if (rownames(mysum$coefficients)[i] != 't') myeq <- paste(myeq, '[t]', sep='')
}
}
myeq <- paste(myeq, ' + e[t]')
a<-table.row.start(a)
a<-table.element(a, myeq)
a<-table.row.end(a)
a<-table.end(a)
table.save(a,file='mytable1.tab')
a<-table.start()
a<-table.row.start(a)
a<-table.element(a,hyperlink('ols1.htm','Multiple Linear Regression - Ordinary Least Squares',''), 6, TRUE)
a<-table.row.end(a)
a<-table.row.start(a)
a<-table.element(a,'Variable',header=TRUE)
a<-table.element(a,'Parameter',header=TRUE)
a<-table.element(a,'S.D.',header=TRUE)
a<-table.element(a,'T-STAT
H0: parameter = 0',header=TRUE)
a<-table.element(a,'2-tail p-value',header=TRUE)
a<-table.element(a,'1-tail p-value',header=TRUE)
a<-table.row.end(a)
for (i in 1:k){
a<-table.row.start(a)
a<-table.element(a,rownames(mysum$coefficients)[i],header=TRUE)
a<-table.element(a,mysum$coefficients[i,1])
a<-table.element(a, round(mysum$coefficients[i,2],6))
a<-table.element(a, round(mysum$coefficients[i,3],4))
a<-table.element(a, round(mysum$coefficients[i,4],6))
a<-table.element(a, round(mysum$coefficients[i,4]/2,6))
a<-table.row.end(a)
}
a<-table.end(a)
table.save(a,file='mytable2.tab')
a<-table.start()
a<-table.row.start(a)
a<-table.element(a, 'Multiple Linear Regression - Regression Statistics', 2, TRUE)
a<-table.row.end(a)
a<-table.row.start(a)
a<-table.element(a, 'Multiple R',1,TRUE)
a<-table.element(a, sqrt(mysum$r.squared))
a<-table.row.end(a)
a<-table.row.start(a)
a<-table.element(a, 'R-squared',1,TRUE)
a<-table.element(a, mysum$r.squared)
a<-table.row.end(a)
a<-table.row.start(a)
a<-table.element(a, 'Adjusted R-squared',1,TRUE)
a<-table.element(a, mysum$adj.r.squared)
a<-table.row.end(a)
a<-table.row.start(a)
a<-table.element(a, 'F-TEST (value)',1,TRUE)
a<-table.element(a, mysum$fstatistic[1])
a<-table.row.end(a)
a<-table.row.start(a)
a<-table.element(a, 'F-TEST (DF numerator)',1,TRUE)
a<-table.element(a, mysum$fstatistic[2])
a<-table.row.end(a)
a<-table.row.start(a)
a<-table.element(a, 'F-TEST (DF denominator)',1,TRUE)
a<-table.element(a, mysum$fstatistic[3])
a<-table.row.end(a)
a<-table.row.start(a)
a<-table.element(a, 'p-value',1,TRUE)
a<-table.element(a, 1-pf(mysum$fstatistic[1],mysum$fstatistic[2],mysum$fstatistic[3]))
a<-table.row.end(a)
a<-table.row.start(a)
a<-table.element(a, 'Multiple Linear Regression - Residual Statistics', 2, TRUE)
a<-table.row.end(a)
a<-table.row.start(a)
a<-table.element(a, 'Residual Standard Deviation',1,TRUE)
a<-table.element(a, mysum$sigma)
a<-table.row.end(a)
a<-table.row.start(a)
a<-table.element(a, 'Sum Squared Residuals',1,TRUE)
a<-table.element(a, sum(myerror*myerror))
a<-table.row.end(a)
a<-table.end(a)
table.save(a,file='mytable3.tab')
a<-table.start()
a<-table.row.start(a)
a<-table.element(a, 'Multiple Linear Regression - Actuals, Interpolation, and Residuals', 4, TRUE)
a<-table.row.end(a)
a<-table.row.start(a)
a<-table.element(a, 'Time or Index', 1, TRUE)
a<-table.element(a, 'Actuals', 1, TRUE)
a<-table.element(a, 'Interpolation
Forecast', 1, TRUE)
a<-table.element(a, 'Residuals
Prediction Error', 1, TRUE)
a<-table.row.end(a)
for (i in 1:n) {
a<-table.row.start(a)
a<-table.element(a,i, 1, TRUE)
a<-table.element(a,x[i])
a<-table.element(a,x[i]-mysum$resid[i])
a<-table.element(a,mysum$resid[i])
a<-table.row.end(a)
}
a<-table.end(a)
table.save(a,file='mytable4.tab')