Free Statistics
of Irreproducible Research!
Description of Statistical Computation | |||||||||||||||||||||||||||||||||||||||
|---|---|---|---|---|---|---|---|---|---|---|---|---|---|---|---|---|---|---|---|---|---|---|---|---|---|---|---|---|---|---|---|---|---|---|---|---|---|---|---|
| Author's title | |||||||||||||||||||||||||||||||||||||||
| Author | *Unverified author* | ||||||||||||||||||||||||||||||||||||||
| R Software Module | rwasp_fitdistrnorm.wasp | ||||||||||||||||||||||||||||||||||||||
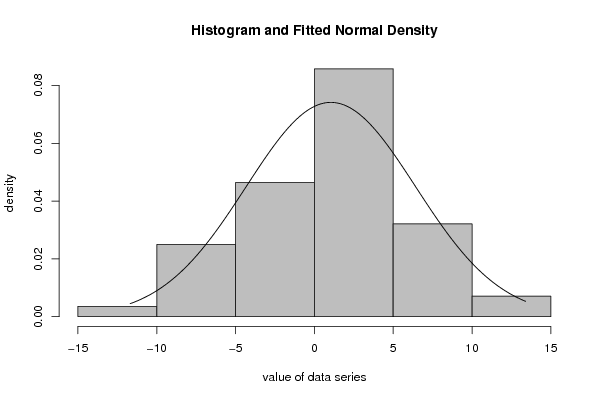
| Title produced by software | Maximum-likelihood Fitting - Normal Distribution | ||||||||||||||||||||||||||||||||||||||
| Date of computation | Fri, 21 Dec 2007 02:08:55 -0700 | ||||||||||||||||||||||||||||||||||||||
| Cite this page as follows | Statistical Computations at FreeStatistics.org, Office for Research Development and Education, URL https://freestatistics.org/blog/index.php?v=date/2007/Dec/21/t1198227869ujjxaevri4lsa1e.htm/, Retrieved Tue, 07 May 2024 04:42:10 +0000 | ||||||||||||||||||||||||||||||||||||||
| Statistical Computations at FreeStatistics.org, Office for Research Development and Education, URL https://freestatistics.org/blog/index.php?pk=4780, Retrieved Tue, 07 May 2024 04:42:10 +0000 | |||||||||||||||||||||||||||||||||||||||
| QR Codes: | |||||||||||||||||||||||||||||||||||||||
|
| |||||||||||||||||||||||||||||||||||||||
| Original text written by user: | |||||||||||||||||||||||||||||||||||||||
| IsPrivate? | No (this computation is public) | ||||||||||||||||||||||||||||||||||||||
| User-defined keywords | Maximul Likelihood Tinne Van der Eycken | ||||||||||||||||||||||||||||||||||||||
| Estimated Impact | 226 | ||||||||||||||||||||||||||||||||||||||
Tree of Dependent Computations | |||||||||||||||||||||||||||||||||||||||
| Family? (F = Feedback message, R = changed R code, M = changed R Module, P = changed Parameters, D = changed Data) | |||||||||||||||||||||||||||||||||||||||
| - [Maximum-likelihood Fitting - Normal Distribution] [Paper: industriel...] [2007-12-21 09:08:55] [d41d8cd98f00b204e9800998ecf8427e] [Current] | |||||||||||||||||||||||||||||||||||||||
| Feedback Forum | |||||||||||||||||||||||||||||||||||||||
Post a new message | |||||||||||||||||||||||||||||||||||||||
Dataset | |||||||||||||||||||||||||||||||||||||||
| Dataseries X: | |||||||||||||||||||||||||||||||||||||||
0.0963998702089473 3.68776849361799 -2.21255748827435 -7.20539944007456 -7.023891220501 -7.61148340355811 -3.99320973953091 6.89080433018175 4.29343380939718 7.62272567916079 -11.6843627244492 -0.535869903617174 4.04039602192003 2.32019809603990 9.33968250429729 -2.53778924222572 -1.01815086767597 12.8776109208021 -8.42487576488816 2.83410372215247 -0.471503171874632 -4.91856672164707 7.16052036556875 6.998877306551 1.22749287747846 1.66434155208273 -4.36846797387122 -2.09547670954011 4.81586323198283 -4.48888699863318 -8.48643331579231 2.89866303275703 5.27231601243985 -2.56938765772798 2.36292159333768 -6.05726375617971 4.66991235080987 0.262121137580347 5.3112374408186 -7.91592347989297 6.18741413248122 0.747779670353935 -1.40792915135314 4.52258059154915 0.456098235973329 13.4046188187457 4.19387306989446 2.69556495773171 8.39583369915604 4.06972911185789 1.66853211858185 1.26029425179894 -1.31856162906204 3.42176579549080 4.38702403425957 3.14027069254159 | |||||||||||||||||||||||||||||||||||||||
Tables (Output of Computation) | |||||||||||||||||||||||||||||||||||||||
| |||||||||||||||||||||||||||||||||||||||
Figures (Output of Computation) | |||||||||||||||||||||||||||||||||||||||
Input Parameters & R Code | |||||||||||||||||||||||||||||||||||||||
| Parameters (Session): | |||||||||||||||||||||||||||||||||||||||
| par1 = 8 ; par2 = 6 ; | |||||||||||||||||||||||||||||||||||||||
| Parameters (R input): | |||||||||||||||||||||||||||||||||||||||
| par1 = 8 ; par2 = 6 ; | |||||||||||||||||||||||||||||||||||||||
| R code (references can be found in the software module): | |||||||||||||||||||||||||||||||||||||||
library(MASS) | |||||||||||||||||||||||||||||||||||||||