Free Statistics

of Irreproducible Research!

Author's title

Author*Unverified author*
R Software Modulerwasp_multipleregression.wasp
Title produced by softwareMultiple Regression
Date of computationThu, 20 Dec 2007 13:05:01 -0700
Cite this page as followsStatistical Computations at FreeStatistics.org, Office for Research Development and Education, URL https://freestatistics.org/blog/index.php?v=date/2007/Dec/20/t1198180037n127zrmizpvqq4h.htm/, Retrieved Mon, 29 Apr 2024 12:55:51 +0000
Statistical Computations at FreeStatistics.org, Office for Research Development and Education, URL https://freestatistics.org/blog/index.php?pk=4759, Retrieved Mon, 29 Apr 2024 12:55:51 +0000
QR Codes:

Original text written by user:
IsPrivate?No (this computation is public)
User-defined keywords
Estimated Impact187
Family? (F = Feedback message, R = changed R code, M = changed R Module, P = changed Parameters, D = changed Data)
-       [Multiple Regression] [Regression Model2] [2007-12-20 20:05:01] [805775fbed00654de000aba64f64fa11] [Current]
Feedback Forum

Post a new message
Dataseries X:
115,4	126,6	117
106,9	93,9	103,8
107,1	89,8	100,8
99,3	93,4	110,6
99,2	101,5	104
108,3	110,4	112,6
105,6	105,9	107,3
99,5	108,4	98,9
107,4	113,9	109,8
93,1	86,1	104,9
88,1	69,4	102,2
110,7	101,2	123,9
113,1	100,5	124,9
99,6	98	112,7
93,6	106,6	121,9
98,6	90,1	100,6
99,6	96,9	104,3
114,3	125,9	120,4
107,8	112	107,5
101,2	100	102,9
112,5	123,9	125,6
100,5	79,8	107,5
93,9	83,4	108,8
116,2	113,6	128,4
112	112,9	121,1
106,4	104	119,5
95,7	109,9	128,7
96	99	108,7
95,8	106,3	105,5
103	128,9	119,8
102,2	111,1	111,3
98,4	102,9	110,6
111,4	130	120,1
86,6	87	97,5
91,3	87,5	107,7
107,9	117,6	127,3
101,8	103,4	117,2
104,4	110,8	119,8
93,4	112,6	116,2
100,1	102,5	111
98,5	112,4	112,4
112,9	135,6	130,6
101,4	105,1	109,1
107,1	127,7	118,8
110,8	137	123,9
90,3	91	101,6
95,5	90,5	112,8
111,4	122,4	128
113	123,3	129,6
107,5	124,3	125,8
95,9	120	119,5
106,3	118,1	115,7
105,2	119	113,6
117,2	142,7	129,7
106,9	123,6	112
108,2	129,6	116,8
113	151,6	127
96,1	108,7	112,9
100,2	99,3	113,3
108,1	126,4	121,7


Summary of compuational transaction
Raw Inputview raw input (R code)
Raw Outputview raw output of R engine
Computing time6 seconds
R Server'Herman Ole Andreas Wold' @ 193.190.124.10:1001

\begin{tabular}{lllllllll}
\hline
Summary of compuational transaction \tabularnewline
Raw Input & view raw input (R code)  \tabularnewline
Raw Output & view raw output of R engine  \tabularnewline
Computing time & 6 seconds \tabularnewline
R Server & 'Herman Ole Andreas Wold' @ 193.190.124.10:1001 \tabularnewline
\hline
\end{tabular}
%Source: https://freestatistics.org/blog/index.php?pk=4759&T=0

[TABLE]
[ROW][C]Summary of compuational transaction[/C][/ROW]
[ROW][C]Raw Input[/C][C]view raw input (R code) [/C][/ROW]
[ROW][C]Raw Output[/C][C]view raw output of R engine [/C][/ROW]
[ROW][C]Computing time[/C][C]6 seconds[/C][/ROW]
[ROW][C]R Server[/C][C]'Herman Ole Andreas Wold' @ 193.190.124.10:1001[/C][/ROW]
[/TABLE]
Source: https://freestatistics.org/blog/index.php?pk=4759&T=0

Globally Unique Identifier (entire table): ba.freestatistics.org/blog/index.php?pk=4759&T=0

As an alternative you can also use a QR Code:  

The GUIDs for individual cells are displayed in the table below:

Summary of compuational transaction
Raw Inputview raw input (R code)
Raw Outputview raw output of R engine
Computing time6 seconds
R Server'Herman Ole Andreas Wold' @ 193.190.124.10:1001


Multiple Linear Regression - Estimated Regression Equation
Consum[t] = + 67.4291999833155 + 0.122648897109028Interm[t] + 0.385701507941996Invest[t] -2.80599540639002M1[t] -4.9439283673191M2[t] -3.49422237447485M3[t] -9.19073435716852M4[t] -13.0473047507421M5[t] -8.0801824801478M6[t] -13.8614976182497M7[t] -14.3092940010561M8[t] -10.4005745029851M9[t] -8.9084955604395M10[t] -3.15171024531287M11[t] + e[t]

\begin{tabular}{lllllllll}
\hline
Multiple Linear Regression - Estimated Regression Equation \tabularnewline
Consum[t] =  +  67.4291999833155 +  0.122648897109028Interm[t] +  0.385701507941996Invest[t] -2.80599540639002M1[t] -4.9439283673191M2[t] -3.49422237447485M3[t] -9.19073435716852M4[t] -13.0473047507421M5[t] -8.0801824801478M6[t] -13.8614976182497M7[t] -14.3092940010561M8[t] -10.4005745029851M9[t] -8.9084955604395M10[t] -3.15171024531287M11[t]  + e[t] \tabularnewline
\hline
\end{tabular}
%Source: https://freestatistics.org/blog/index.php?pk=4759&T=1

[TABLE]
[ROW][C]Multiple Linear Regression - Estimated Regression Equation[/C][/ROW]
[ROW][C]Consum[t] =  +  67.4291999833155 +  0.122648897109028Interm[t] +  0.385701507941996Invest[t] -2.80599540639002M1[t] -4.9439283673191M2[t] -3.49422237447485M3[t] -9.19073435716852M4[t] -13.0473047507421M5[t] -8.0801824801478M6[t] -13.8614976182497M7[t] -14.3092940010561M8[t] -10.4005745029851M9[t] -8.9084955604395M10[t] -3.15171024531287M11[t]  + e[t][/C][/ROW]
[/TABLE]
Source: https://freestatistics.org/blog/index.php?pk=4759&T=1

Globally Unique Identifier (entire table): ba.freestatistics.org/blog/index.php?pk=4759&T=1

As an alternative you can also use a QR Code:  

The GUIDs for individual cells are displayed in the table below:

Multiple Linear Regression - Estimated Regression Equation
Consum[t] = + 67.4291999833155 + 0.122648897109028Interm[t] + 0.385701507941996Invest[t] -2.80599540639002M1[t] -4.9439283673191M2[t] -3.49422237447485M3[t] -9.19073435716852M4[t] -13.0473047507421M5[t] -8.0801824801478M6[t] -13.8614976182497M7[t] -14.3092940010561M8[t] -10.4005745029851M9[t] -8.9084955604395M10[t] -3.15171024531287M11[t] + e[t]


Multiple Linear Regression - Ordinary Least Squares
VariableParameterS.D.T-STATH0: parameter = 02-tail p-value1-tail p-value
(Intercept)67.429199983315517.6396233.82260.0003950.000198
Interm0.1226488971090280.1692610.72460.4723580.236179
Invest0.3857015079419960.0644475.984800
M1-2.805995406390022.980254-0.94150.3513520.175676
M2-4.94392836731913.129014-1.580.1209530.060477
M3-3.494222374474853.690169-0.94690.3486370.174319
M4-9.190734357168523.444965-2.66790.0105050.005253
M5-13.04730475074213.460835-3.770.0004640.000232
M6-8.08018248014783.075852-2.6270.0116640.005832
M7-13.86149761824973.125226-4.43545.7e-052.8e-05
M8-14.30929400105613.245562-4.40896.2e-053.1e-05
M9-10.40057450298513.12451-3.32870.0017240.000862
M10-8.90849556043954.10489-2.17020.035190.017595
M11-3.151710245312874.112482-0.76640.4473670.223684

\begin{tabular}{lllllllll}
\hline
Multiple Linear Regression - Ordinary Least Squares \tabularnewline
Variable & Parameter & S.D. & T-STATH0: parameter = 0 & 2-tail p-value & 1-tail p-value \tabularnewline
(Intercept) & 67.4291999833155 & 17.639623 & 3.8226 & 0.000395 & 0.000198 \tabularnewline
Interm & 0.122648897109028 & 0.169261 & 0.7246 & 0.472358 & 0.236179 \tabularnewline
Invest & 0.385701507941996 & 0.064447 & 5.9848 & 0 & 0 \tabularnewline
M1 & -2.80599540639002 & 2.980254 & -0.9415 & 0.351352 & 0.175676 \tabularnewline
M2 & -4.9439283673191 & 3.129014 & -1.58 & 0.120953 & 0.060477 \tabularnewline
M3 & -3.49422237447485 & 3.690169 & -0.9469 & 0.348637 & 0.174319 \tabularnewline
M4 & -9.19073435716852 & 3.444965 & -2.6679 & 0.010505 & 0.005253 \tabularnewline
M5 & -13.0473047507421 & 3.460835 & -3.77 & 0.000464 & 0.000232 \tabularnewline
M6 & -8.0801824801478 & 3.075852 & -2.627 & 0.011664 & 0.005832 \tabularnewline
M7 & -13.8614976182497 & 3.125226 & -4.4354 & 5.7e-05 & 2.8e-05 \tabularnewline
M8 & -14.3092940010561 & 3.245562 & -4.4089 & 6.2e-05 & 3.1e-05 \tabularnewline
M9 & -10.4005745029851 & 3.12451 & -3.3287 & 0.001724 & 0.000862 \tabularnewline
M10 & -8.9084955604395 & 4.10489 & -2.1702 & 0.03519 & 0.017595 \tabularnewline
M11 & -3.15171024531287 & 4.112482 & -0.7664 & 0.447367 & 0.223684 \tabularnewline
\hline
\end{tabular}
%Source: https://freestatistics.org/blog/index.php?pk=4759&T=2

[TABLE]
[ROW][C]Multiple Linear Regression - Ordinary Least Squares[/C][/ROW]
[ROW][C]Variable[/C][C]Parameter[/C][C]S.D.[/C][C]T-STATH0: parameter = 0[/C][C]2-tail p-value[/C][C]1-tail p-value[/C][/ROW]
[ROW][C](Intercept)[/C][C]67.4291999833155[/C][C]17.639623[/C][C]3.8226[/C][C]0.000395[/C][C]0.000198[/C][/ROW]
[ROW][C]Interm[/C][C]0.122648897109028[/C][C]0.169261[/C][C]0.7246[/C][C]0.472358[/C][C]0.236179[/C][/ROW]
[ROW][C]Invest[/C][C]0.385701507941996[/C][C]0.064447[/C][C]5.9848[/C][C]0[/C][C]0[/C][/ROW]
[ROW][C]M1[/C][C]-2.80599540639002[/C][C]2.980254[/C][C]-0.9415[/C][C]0.351352[/C][C]0.175676[/C][/ROW]
[ROW][C]M2[/C][C]-4.9439283673191[/C][C]3.129014[/C][C]-1.58[/C][C]0.120953[/C][C]0.060477[/C][/ROW]
[ROW][C]M3[/C][C]-3.49422237447485[/C][C]3.690169[/C][C]-0.9469[/C][C]0.348637[/C][C]0.174319[/C][/ROW]
[ROW][C]M4[/C][C]-9.19073435716852[/C][C]3.444965[/C][C]-2.6679[/C][C]0.010505[/C][C]0.005253[/C][/ROW]
[ROW][C]M5[/C][C]-13.0473047507421[/C][C]3.460835[/C][C]-3.77[/C][C]0.000464[/C][C]0.000232[/C][/ROW]
[ROW][C]M6[/C][C]-8.0801824801478[/C][C]3.075852[/C][C]-2.627[/C][C]0.011664[/C][C]0.005832[/C][/ROW]
[ROW][C]M7[/C][C]-13.8614976182497[/C][C]3.125226[/C][C]-4.4354[/C][C]5.7e-05[/C][C]2.8e-05[/C][/ROW]
[ROW][C]M8[/C][C]-14.3092940010561[/C][C]3.245562[/C][C]-4.4089[/C][C]6.2e-05[/C][C]3.1e-05[/C][/ROW]
[ROW][C]M9[/C][C]-10.4005745029851[/C][C]3.12451[/C][C]-3.3287[/C][C]0.001724[/C][C]0.000862[/C][/ROW]
[ROW][C]M10[/C][C]-8.9084955604395[/C][C]4.10489[/C][C]-2.1702[/C][C]0.03519[/C][C]0.017595[/C][/ROW]
[ROW][C]M11[/C][C]-3.15171024531287[/C][C]4.112482[/C][C]-0.7664[/C][C]0.447367[/C][C]0.223684[/C][/ROW]
[/TABLE]
Source: https://freestatistics.org/blog/index.php?pk=4759&T=2

Globally Unique Identifier (entire table): ba.freestatistics.org/blog/index.php?pk=4759&T=2

As an alternative you can also use a QR Code:  

The GUIDs for individual cells are displayed in the table below:

Multiple Linear Regression - Ordinary Least Squares
VariableParameterS.D.T-STATH0: parameter = 02-tail p-value1-tail p-value
(Intercept)67.429199983315517.6396233.82260.0003950.000198
Interm0.1226488971090280.1692610.72460.4723580.236179
Invest0.3857015079419960.0644475.984800
M1-2.805995406390022.980254-0.94150.3513520.175676
M2-4.94392836731913.129014-1.580.1209530.060477
M3-3.494222374474853.690169-0.94690.3486370.174319
M4-9.190734357168523.444965-2.66790.0105050.005253
M5-13.04730475074213.460835-3.770.0004640.000232
M6-8.08018248014783.075852-2.6270.0116640.005832
M7-13.86149761824973.125226-4.43545.7e-052.8e-05
M8-14.30929400105613.245562-4.40896.2e-053.1e-05
M9-10.40057450298513.12451-3.32870.0017240.000862
M10-8.90849556043954.10489-2.17020.035190.017595
M11-3.151710245312874.112482-0.76640.4473670.223684


Multiple Linear Regression - Regression Statistics
Multiple R0.88712723237959
R-squared0.786994726429472
Adjusted R-squared0.726797583898671
F-TEST (value)13.0736226562048
F-TEST (DF numerator)13
F-TEST (DF denominator)46
p-value2.23867591131466e-11
Multiple Linear Regression - Residual Statistics
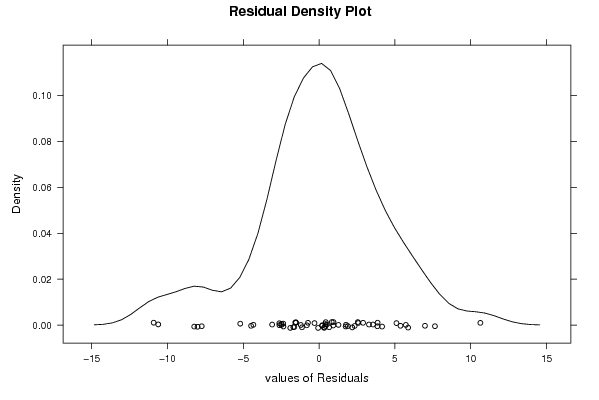
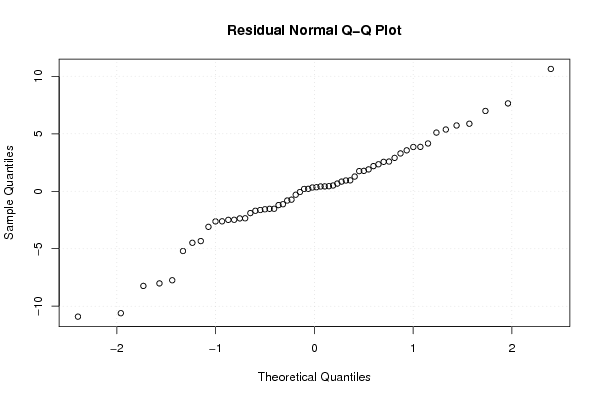
Residual Standard Deviation4.70140091754964
Sum Squared Residuals1016.74584702668

\begin{tabular}{lllllllll}
\hline
Multiple Linear Regression - Regression Statistics \tabularnewline
Multiple R & 0.88712723237959 \tabularnewline
R-squared & 0.786994726429472 \tabularnewline
Adjusted R-squared & 0.726797583898671 \tabularnewline
F-TEST (value) & 13.0736226562048 \tabularnewline
F-TEST (DF numerator) & 13 \tabularnewline
F-TEST (DF denominator) & 46 \tabularnewline
p-value & 2.23867591131466e-11 \tabularnewline
Multiple Linear Regression - Residual Statistics \tabularnewline
Residual Standard Deviation & 4.70140091754964 \tabularnewline
Sum Squared Residuals & 1016.74584702668 \tabularnewline
\hline
\end{tabular}
%Source: https://freestatistics.org/blog/index.php?pk=4759&T=3

[TABLE]
[ROW][C]Multiple Linear Regression - Regression Statistics[/C][/ROW]
[ROW][C]Multiple R[/C][C]0.88712723237959[/C][/ROW]
[ROW][C]R-squared[/C][C]0.786994726429472[/C][/ROW]
[ROW][C]Adjusted R-squared[/C][C]0.726797583898671[/C][/ROW]
[ROW][C]F-TEST (value)[/C][C]13.0736226562048[/C][/ROW]
[ROW][C]F-TEST (DF numerator)[/C][C]13[/C][/ROW]
[ROW][C]F-TEST (DF denominator)[/C][C]46[/C][/ROW]
[ROW][C]p-value[/C][C]2.23867591131466e-11[/C][/ROW]
[ROW][C]Multiple Linear Regression - Residual Statistics[/C][/ROW]
[ROW][C]Residual Standard Deviation[/C][C]4.70140091754964[/C][/ROW]
[ROW][C]Sum Squared Residuals[/C][C]1016.74584702668[/C][/ROW]
[/TABLE]
Source: https://freestatistics.org/blog/index.php?pk=4759&T=3

Globally Unique Identifier (entire table): ba.freestatistics.org/blog/index.php?pk=4759&T=3

As an alternative you can also use a QR Code:  

The GUIDs for individual cells are displayed in the table below:

Multiple Linear Regression - Regression Statistics
Multiple R0.88712723237959
R-squared0.786994726429472
Adjusted R-squared0.726797583898671
F-TEST (value)13.0736226562048
F-TEST (DF numerator)13
F-TEST (DF denominator)46
p-value2.23867591131466e-11
Multiple Linear Regression - Residual Statistics
Residual Standard Deviation4.70140091754964
Sum Squared Residuals1016.74584702668


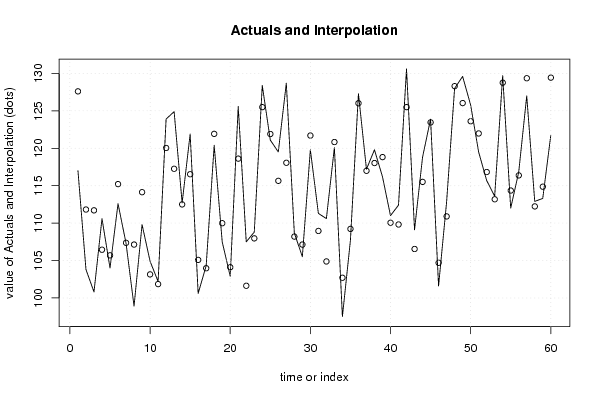
Multiple Linear Regression - Actuals, Interpolation, and Residuals
Time or IndexActualsInterpolationForecastResidualsPrediction Error
1117127.606698208764-10.6066982087641
2103.8111.813810312705-8.01381031270496
3100.8111.706669902409-10.9066699024088
4110.6106.4420219508564.15797804914406
5104105.697368881902-1.69736888190163
6112.6115.213339536872-2.61333953687184
7107.3107.365215590837-0.0652155908365513
898.9107.13351470552-8.23351470552006
9109.8114.132518784433-4.33251878443343
10104.9103.1482165775321.75178342246762
11102.2101.8505422244830.349457775517443
12123.9120.0394254970153.86057450298507
13124.9117.2577963881277.64220361187282
14112.7112.4998495463710.200150453628760
15121.9116.5306951248625.36930487513753
16100.6105.083352746671-4.48335274667102
17104.3103.9722015042120.327798495787935
18120.4121.927606292627-1.52760629262693
19107.5109.987822362923-2.48782236292258
20102.9104.102125163893-1.20212516389264
21125.6118.6150432391096.98495676089057
22107.5101.6258989161055.87410108389537
23108.8107.9617269389030.83827306109712
24128.4125.4966931295952.90330687040466
25121.1121.905581299788-0.80558129978801
26119.5115.6480710943653.85192890563539
27128.7118.06107278510.6389272150000
28108.7108.1972090348710.50279096512869
29105.5107.131729869853-1.63172986985251
30119.8121.698778279121-1.89877827912091
31111.3108.9538571819642.34614281803577
32110.6104.8772426250195.72275737498083
33120.1120.832908650736-0.732908650735681
3497.5102.698130103472-5.19813010347151
35107.7109.224215988982-1.52421598898158
36127.3126.0215133153581.27848668464161
37117.2116.9903982238270.209601776173045
38119.8118.0255435541521.77445644584787
39116.2118.820374393093-2.62037439309265
40111110.0500247908150.949975209184688
41112.4109.8156610904932.58433890950694
42130.6125.4972024637125.10279753628834
43109.1106.5415290166252.55847098337497
44118.8115.5096854268293.2903145731708
45123.9123.4592298680640.440770131935777
46101.6104.694737054543-3.09473705454291
47112.8110.8964458806651.90355411933451
48128128.302151693362-0.302151693361571
49129.6126.0395258794943.56047412050621
50125.8123.6127254924072.18727450759294
51119.5121.981187794636-2.48118779463599
52115.7116.827391476786-1.12739147678642
53113.6113.1830386535410.416961346459269
54129.7128.7630734276690.936926572331345
55112114.351575847652-2.35157584765161
56116.8116.3774320787390.422567921261072
57127129.360299457657-2.36029945765723
58112.9112.2330173483490.666982651651417
59113.3114.867068966967-1.56706896696749
60121.7129.440216364670-7.74021636466976

\begin{tabular}{lllllllll}
\hline
Multiple Linear Regression - Actuals, Interpolation, and Residuals \tabularnewline
Time or Index & Actuals & InterpolationForecast & ResidualsPrediction Error \tabularnewline
1 & 117 & 127.606698208764 & -10.6066982087641 \tabularnewline
2 & 103.8 & 111.813810312705 & -8.01381031270496 \tabularnewline
3 & 100.8 & 111.706669902409 & -10.9066699024088 \tabularnewline
4 & 110.6 & 106.442021950856 & 4.15797804914406 \tabularnewline
5 & 104 & 105.697368881902 & -1.69736888190163 \tabularnewline
6 & 112.6 & 115.213339536872 & -2.61333953687184 \tabularnewline
7 & 107.3 & 107.365215590837 & -0.0652155908365513 \tabularnewline
8 & 98.9 & 107.13351470552 & -8.23351470552006 \tabularnewline
9 & 109.8 & 114.132518784433 & -4.33251878443343 \tabularnewline
10 & 104.9 & 103.148216577532 & 1.75178342246762 \tabularnewline
11 & 102.2 & 101.850542224483 & 0.349457775517443 \tabularnewline
12 & 123.9 & 120.039425497015 & 3.86057450298507 \tabularnewline
13 & 124.9 & 117.257796388127 & 7.64220361187282 \tabularnewline
14 & 112.7 & 112.499849546371 & 0.200150453628760 \tabularnewline
15 & 121.9 & 116.530695124862 & 5.36930487513753 \tabularnewline
16 & 100.6 & 105.083352746671 & -4.48335274667102 \tabularnewline
17 & 104.3 & 103.972201504212 & 0.327798495787935 \tabularnewline
18 & 120.4 & 121.927606292627 & -1.52760629262693 \tabularnewline
19 & 107.5 & 109.987822362923 & -2.48782236292258 \tabularnewline
20 & 102.9 & 104.102125163893 & -1.20212516389264 \tabularnewline
21 & 125.6 & 118.615043239109 & 6.98495676089057 \tabularnewline
22 & 107.5 & 101.625898916105 & 5.87410108389537 \tabularnewline
23 & 108.8 & 107.961726938903 & 0.83827306109712 \tabularnewline
24 & 128.4 & 125.496693129595 & 2.90330687040466 \tabularnewline
25 & 121.1 & 121.905581299788 & -0.80558129978801 \tabularnewline
26 & 119.5 & 115.648071094365 & 3.85192890563539 \tabularnewline
27 & 128.7 & 118.061072785 & 10.6389272150000 \tabularnewline
28 & 108.7 & 108.197209034871 & 0.50279096512869 \tabularnewline
29 & 105.5 & 107.131729869853 & -1.63172986985251 \tabularnewline
30 & 119.8 & 121.698778279121 & -1.89877827912091 \tabularnewline
31 & 111.3 & 108.953857181964 & 2.34614281803577 \tabularnewline
32 & 110.6 & 104.877242625019 & 5.72275737498083 \tabularnewline
33 & 120.1 & 120.832908650736 & -0.732908650735681 \tabularnewline
34 & 97.5 & 102.698130103472 & -5.19813010347151 \tabularnewline
35 & 107.7 & 109.224215988982 & -1.52421598898158 \tabularnewline
36 & 127.3 & 126.021513315358 & 1.27848668464161 \tabularnewline
37 & 117.2 & 116.990398223827 & 0.209601776173045 \tabularnewline
38 & 119.8 & 118.025543554152 & 1.77445644584787 \tabularnewline
39 & 116.2 & 118.820374393093 & -2.62037439309265 \tabularnewline
40 & 111 & 110.050024790815 & 0.949975209184688 \tabularnewline
41 & 112.4 & 109.815661090493 & 2.58433890950694 \tabularnewline
42 & 130.6 & 125.497202463712 & 5.10279753628834 \tabularnewline
43 & 109.1 & 106.541529016625 & 2.55847098337497 \tabularnewline
44 & 118.8 & 115.509685426829 & 3.2903145731708 \tabularnewline
45 & 123.9 & 123.459229868064 & 0.440770131935777 \tabularnewline
46 & 101.6 & 104.694737054543 & -3.09473705454291 \tabularnewline
47 & 112.8 & 110.896445880665 & 1.90355411933451 \tabularnewline
48 & 128 & 128.302151693362 & -0.302151693361571 \tabularnewline
49 & 129.6 & 126.039525879494 & 3.56047412050621 \tabularnewline
50 & 125.8 & 123.612725492407 & 2.18727450759294 \tabularnewline
51 & 119.5 & 121.981187794636 & -2.48118779463599 \tabularnewline
52 & 115.7 & 116.827391476786 & -1.12739147678642 \tabularnewline
53 & 113.6 & 113.183038653541 & 0.416961346459269 \tabularnewline
54 & 129.7 & 128.763073427669 & 0.936926572331345 \tabularnewline
55 & 112 & 114.351575847652 & -2.35157584765161 \tabularnewline
56 & 116.8 & 116.377432078739 & 0.422567921261072 \tabularnewline
57 & 127 & 129.360299457657 & -2.36029945765723 \tabularnewline
58 & 112.9 & 112.233017348349 & 0.666982651651417 \tabularnewline
59 & 113.3 & 114.867068966967 & -1.56706896696749 \tabularnewline
60 & 121.7 & 129.440216364670 & -7.74021636466976 \tabularnewline
\hline
\end{tabular}
%Source: https://freestatistics.org/blog/index.php?pk=4759&T=4

[TABLE]
[ROW][C]Multiple Linear Regression - Actuals, Interpolation, and Residuals[/C][/ROW]
[ROW][C]Time or Index[/C][C]Actuals[/C][C]InterpolationForecast[/C][C]ResidualsPrediction Error[/C][/ROW]
[ROW][C]1[/C][C]117[/C][C]127.606698208764[/C][C]-10.6066982087641[/C][/ROW]
[ROW][C]2[/C][C]103.8[/C][C]111.813810312705[/C][C]-8.01381031270496[/C][/ROW]
[ROW][C]3[/C][C]100.8[/C][C]111.706669902409[/C][C]-10.9066699024088[/C][/ROW]
[ROW][C]4[/C][C]110.6[/C][C]106.442021950856[/C][C]4.15797804914406[/C][/ROW]
[ROW][C]5[/C][C]104[/C][C]105.697368881902[/C][C]-1.69736888190163[/C][/ROW]
[ROW][C]6[/C][C]112.6[/C][C]115.213339536872[/C][C]-2.61333953687184[/C][/ROW]
[ROW][C]7[/C][C]107.3[/C][C]107.365215590837[/C][C]-0.0652155908365513[/C][/ROW]
[ROW][C]8[/C][C]98.9[/C][C]107.13351470552[/C][C]-8.23351470552006[/C][/ROW]
[ROW][C]9[/C][C]109.8[/C][C]114.132518784433[/C][C]-4.33251878443343[/C][/ROW]
[ROW][C]10[/C][C]104.9[/C][C]103.148216577532[/C][C]1.75178342246762[/C][/ROW]
[ROW][C]11[/C][C]102.2[/C][C]101.850542224483[/C][C]0.349457775517443[/C][/ROW]
[ROW][C]12[/C][C]123.9[/C][C]120.039425497015[/C][C]3.86057450298507[/C][/ROW]
[ROW][C]13[/C][C]124.9[/C][C]117.257796388127[/C][C]7.64220361187282[/C][/ROW]
[ROW][C]14[/C][C]112.7[/C][C]112.499849546371[/C][C]0.200150453628760[/C][/ROW]
[ROW][C]15[/C][C]121.9[/C][C]116.530695124862[/C][C]5.36930487513753[/C][/ROW]
[ROW][C]16[/C][C]100.6[/C][C]105.083352746671[/C][C]-4.48335274667102[/C][/ROW]
[ROW][C]17[/C][C]104.3[/C][C]103.972201504212[/C][C]0.327798495787935[/C][/ROW]
[ROW][C]18[/C][C]120.4[/C][C]121.927606292627[/C][C]-1.52760629262693[/C][/ROW]
[ROW][C]19[/C][C]107.5[/C][C]109.987822362923[/C][C]-2.48782236292258[/C][/ROW]
[ROW][C]20[/C][C]102.9[/C][C]104.102125163893[/C][C]-1.20212516389264[/C][/ROW]
[ROW][C]21[/C][C]125.6[/C][C]118.615043239109[/C][C]6.98495676089057[/C][/ROW]
[ROW][C]22[/C][C]107.5[/C][C]101.625898916105[/C][C]5.87410108389537[/C][/ROW]
[ROW][C]23[/C][C]108.8[/C][C]107.961726938903[/C][C]0.83827306109712[/C][/ROW]
[ROW][C]24[/C][C]128.4[/C][C]125.496693129595[/C][C]2.90330687040466[/C][/ROW]
[ROW][C]25[/C][C]121.1[/C][C]121.905581299788[/C][C]-0.80558129978801[/C][/ROW]
[ROW][C]26[/C][C]119.5[/C][C]115.648071094365[/C][C]3.85192890563539[/C][/ROW]
[ROW][C]27[/C][C]128.7[/C][C]118.061072785[/C][C]10.6389272150000[/C][/ROW]
[ROW][C]28[/C][C]108.7[/C][C]108.197209034871[/C][C]0.50279096512869[/C][/ROW]
[ROW][C]29[/C][C]105.5[/C][C]107.131729869853[/C][C]-1.63172986985251[/C][/ROW]
[ROW][C]30[/C][C]119.8[/C][C]121.698778279121[/C][C]-1.89877827912091[/C][/ROW]
[ROW][C]31[/C][C]111.3[/C][C]108.953857181964[/C][C]2.34614281803577[/C][/ROW]
[ROW][C]32[/C][C]110.6[/C][C]104.877242625019[/C][C]5.72275737498083[/C][/ROW]
[ROW][C]33[/C][C]120.1[/C][C]120.832908650736[/C][C]-0.732908650735681[/C][/ROW]
[ROW][C]34[/C][C]97.5[/C][C]102.698130103472[/C][C]-5.19813010347151[/C][/ROW]
[ROW][C]35[/C][C]107.7[/C][C]109.224215988982[/C][C]-1.52421598898158[/C][/ROW]
[ROW][C]36[/C][C]127.3[/C][C]126.021513315358[/C][C]1.27848668464161[/C][/ROW]
[ROW][C]37[/C][C]117.2[/C][C]116.990398223827[/C][C]0.209601776173045[/C][/ROW]
[ROW][C]38[/C][C]119.8[/C][C]118.025543554152[/C][C]1.77445644584787[/C][/ROW]
[ROW][C]39[/C][C]116.2[/C][C]118.820374393093[/C][C]-2.62037439309265[/C][/ROW]
[ROW][C]40[/C][C]111[/C][C]110.050024790815[/C][C]0.949975209184688[/C][/ROW]
[ROW][C]41[/C][C]112.4[/C][C]109.815661090493[/C][C]2.58433890950694[/C][/ROW]
[ROW][C]42[/C][C]130.6[/C][C]125.497202463712[/C][C]5.10279753628834[/C][/ROW]
[ROW][C]43[/C][C]109.1[/C][C]106.541529016625[/C][C]2.55847098337497[/C][/ROW]
[ROW][C]44[/C][C]118.8[/C][C]115.509685426829[/C][C]3.2903145731708[/C][/ROW]
[ROW][C]45[/C][C]123.9[/C][C]123.459229868064[/C][C]0.440770131935777[/C][/ROW]
[ROW][C]46[/C][C]101.6[/C][C]104.694737054543[/C][C]-3.09473705454291[/C][/ROW]
[ROW][C]47[/C][C]112.8[/C][C]110.896445880665[/C][C]1.90355411933451[/C][/ROW]
[ROW][C]48[/C][C]128[/C][C]128.302151693362[/C][C]-0.302151693361571[/C][/ROW]
[ROW][C]49[/C][C]129.6[/C][C]126.039525879494[/C][C]3.56047412050621[/C][/ROW]
[ROW][C]50[/C][C]125.8[/C][C]123.612725492407[/C][C]2.18727450759294[/C][/ROW]
[ROW][C]51[/C][C]119.5[/C][C]121.981187794636[/C][C]-2.48118779463599[/C][/ROW]
[ROW][C]52[/C][C]115.7[/C][C]116.827391476786[/C][C]-1.12739147678642[/C][/ROW]
[ROW][C]53[/C][C]113.6[/C][C]113.183038653541[/C][C]0.416961346459269[/C][/ROW]
[ROW][C]54[/C][C]129.7[/C][C]128.763073427669[/C][C]0.936926572331345[/C][/ROW]
[ROW][C]55[/C][C]112[/C][C]114.351575847652[/C][C]-2.35157584765161[/C][/ROW]
[ROW][C]56[/C][C]116.8[/C][C]116.377432078739[/C][C]0.422567921261072[/C][/ROW]
[ROW][C]57[/C][C]127[/C][C]129.360299457657[/C][C]-2.36029945765723[/C][/ROW]
[ROW][C]58[/C][C]112.9[/C][C]112.233017348349[/C][C]0.666982651651417[/C][/ROW]
[ROW][C]59[/C][C]113.3[/C][C]114.867068966967[/C][C]-1.56706896696749[/C][/ROW]
[ROW][C]60[/C][C]121.7[/C][C]129.440216364670[/C][C]-7.74021636466976[/C][/ROW]
[/TABLE]
Source: https://freestatistics.org/blog/index.php?pk=4759&T=4

Globally Unique Identifier (entire table): ba.freestatistics.org/blog/index.php?pk=4759&T=4

As an alternative you can also use a QR Code:  

The GUIDs for individual cells are displayed in the table below:

Multiple Linear Regression - Actuals, Interpolation, and Residuals
Time or IndexActualsInterpolationForecastResidualsPrediction Error
1117127.606698208764-10.6066982087641
2103.8111.813810312705-8.01381031270496
3100.8111.706669902409-10.9066699024088
4110.6106.4420219508564.15797804914406
5104105.697368881902-1.69736888190163
6112.6115.213339536872-2.61333953687184
7107.3107.365215590837-0.0652155908365513
898.9107.13351470552-8.23351470552006
9109.8114.132518784433-4.33251878443343
10104.9103.1482165775321.75178342246762
11102.2101.8505422244830.349457775517443
12123.9120.0394254970153.86057450298507
13124.9117.2577963881277.64220361187282
14112.7112.4998495463710.200150453628760
15121.9116.5306951248625.36930487513753
16100.6105.083352746671-4.48335274667102
17104.3103.9722015042120.327798495787935
18120.4121.927606292627-1.52760629262693
19107.5109.987822362923-2.48782236292258
20102.9104.102125163893-1.20212516389264
21125.6118.6150432391096.98495676089057
22107.5101.6258989161055.87410108389537
23108.8107.9617269389030.83827306109712
24128.4125.4966931295952.90330687040466
25121.1121.905581299788-0.80558129978801
26119.5115.6480710943653.85192890563539
27128.7118.06107278510.6389272150000
28108.7108.1972090348710.50279096512869
29105.5107.131729869853-1.63172986985251
30119.8121.698778279121-1.89877827912091
31111.3108.9538571819642.34614281803577
32110.6104.8772426250195.72275737498083
33120.1120.832908650736-0.732908650735681
3497.5102.698130103472-5.19813010347151
35107.7109.224215988982-1.52421598898158
36127.3126.0215133153581.27848668464161
37117.2116.9903982238270.209601776173045
38119.8118.0255435541521.77445644584787
39116.2118.820374393093-2.62037439309265
40111110.0500247908150.949975209184688
41112.4109.8156610904932.58433890950694
42130.6125.4972024637125.10279753628834
43109.1106.5415290166252.55847098337497
44118.8115.5096854268293.2903145731708
45123.9123.4592298680640.440770131935777
46101.6104.694737054543-3.09473705454291
47112.8110.8964458806651.90355411933451
48128128.302151693362-0.302151693361571
49129.6126.0395258794943.56047412050621
50125.8123.6127254924072.18727450759294
51119.5121.981187794636-2.48118779463599
52115.7116.827391476786-1.12739147678642
53113.6113.1830386535410.416961346459269
54129.7128.7630734276690.936926572331345
55112114.351575847652-2.35157584765161
56116.8116.3774320787390.422567921261072
57127129.360299457657-2.36029945765723
58112.9112.2330173483490.666982651651417
59113.3114.867068966967-1.56706896696749
60121.7129.440216364670-7.74021636466976


Parameters (Session):
par1 = 3 ; par2 = Include Monthly Dummies ; par3 = No Linear Trend ;
Parameters (R input):
par1 = 3 ; par2 = Include Monthly Dummies ; par3 = No Linear Trend ;
R code (references can be found in the software module):
library(lattice)
par1 <- as.numeric(par1)
x <- t(y)
k <- length(x[1,])
n <- length(x[,1])
x1 <- cbind(x[,par1], x[,1:k!=par1])
mycolnames <- c(colnames(x)[par1], colnames(x)[1:k!=par1])
colnames(x1) <- mycolnames #colnames(x)[par1]
x <- x1
if (par3 == 'First Differences'){
x2 <- array(0, dim=c(n-1,k), dimnames=list(1:(n-1), paste('(1-B)',colnames(x),sep='')))
for (i in 1:n-1) {
for (j in 1:k) {
x2[i,j] <- x[i+1,j] - x[i,j]
}
}
x <- x2
}
if (par2 == 'Include Monthly Dummies'){
x2 <- array(0, dim=c(n,11), dimnames=list(1:n, paste('M', seq(1:11), sep ='')))
for (i in 1:11){
x2[seq(i,n,12),i] <- 1
}
x <- cbind(x, x2)
}
if (par2 == 'Include Quarterly Dummies'){
x2 <- array(0, dim=c(n,3), dimnames=list(1:n, paste('Q', seq(1:3), sep ='')))
for (i in 1:3){
x2[seq(i,n,4),i] <- 1
}
x <- cbind(x, x2)
}
k <- length(x[1,])
if (par3 == 'Linear Trend'){
x <- cbind(x, c(1:n))
colnames(x)[k+1] <- 't'
}
x
k <- length(x[1,])
df <- as.data.frame(x)
(mylm <- lm(df))
(mysum <- summary(mylm))
bitmap(file='test0.png')
plot(x[,1], type='l', main='Actuals and Interpolation', ylab='value of Actuals and Interpolation (dots)', xlab='time or index')
points(x[,1]-mysum$resid)
grid()
dev.off()
bitmap(file='test1.png')
plot(mysum$resid, type='b', pch=19, main='Residuals', ylab='value of Residuals', xlab='time or index')
grid()
dev.off()
bitmap(file='test2.png')
hist(mysum$resid, main='Residual Histogram', xlab='values of Residuals')
grid()
dev.off()
bitmap(file='test3.png')
densityplot(~mysum$resid,col='black',main='Residual Density Plot', xlab='values of Residuals')
dev.off()
bitmap(file='test4.png')
qqnorm(mysum$resid, main='Residual Normal Q-Q Plot')
grid()
dev.off()
(myerror <- as.ts(mysum$resid))
bitmap(file='test5.png')
dum <- cbind(lag(myerror,k=1),myerror)
dum
dum1 <- dum[2:length(myerror),]
dum1
z <- as.data.frame(dum1)
z
plot(z,main=paste('Residual Lag plot, lowess, and regression line'), ylab='values of Residuals', xlab='lagged values of Residuals')
lines(lowess(z))
abline(lm(z))
grid()
dev.off()
bitmap(file='test6.png')
acf(mysum$resid, lag.max=length(mysum$resid)/2, main='Residual Autocorrelation Function')
grid()
dev.off()
bitmap(file='test7.png')
pacf(mysum$resid, lag.max=length(mysum$resid)/2, main='Residual Partial Autocorrelation Function')
grid()
dev.off()
bitmap(file='test8.png')
opar <- par(mfrow = c(2,2), oma = c(0, 0, 1.1, 0))
plot(mylm, las = 1, sub='Residual Diagnostics')
par(opar)
dev.off()
load(file='createtable')
a<-table.start()
a<-table.row.start(a)
a<-table.element(a, 'Multiple Linear Regression - Estimated Regression Equation', 1, TRUE)
a<-table.row.end(a)
myeq <- colnames(x)[1]
myeq <- paste(myeq, '[t] = ', sep='')
for (i in 1:k){
if (mysum$coefficients[i,1] > 0) myeq <- paste(myeq, '+', '')
myeq <- paste(myeq, mysum$coefficients[i,1], sep=' ')
if (rownames(mysum$coefficients)[i] != '(Intercept)') {
myeq <- paste(myeq, rownames(mysum$coefficients)[i], sep='')
if (rownames(mysum$coefficients)[i] != 't') myeq <- paste(myeq, '[t]', sep='')
}
}
myeq <- paste(myeq, ' + e[t]')
a<-table.row.start(a)
a<-table.element(a, myeq)
a<-table.row.end(a)
a<-table.end(a)
table.save(a,file='mytable1.tab')
a<-table.start()
a<-table.row.start(a)
a<-table.element(a,hyperlink('ols1.htm','Multiple Linear Regression - Ordinary Least Squares',''), 6, TRUE)
a<-table.row.end(a)
a<-table.row.start(a)
a<-table.element(a,'Variable',header=TRUE)
a<-table.element(a,'Parameter',header=TRUE)
a<-table.element(a,'S.D.',header=TRUE)
a<-table.element(a,'T-STAT
H0: parameter = 0',header=TRUE)
a<-table.element(a,'2-tail p-value',header=TRUE)
a<-table.element(a,'1-tail p-value',header=TRUE)
a<-table.row.end(a)
for (i in 1:k){
a<-table.row.start(a)
a<-table.element(a,rownames(mysum$coefficients)[i],header=TRUE)
a<-table.element(a,mysum$coefficients[i,1])
a<-table.element(a, round(mysum$coefficients[i,2],6))
a<-table.element(a, round(mysum$coefficients[i,3],4))
a<-table.element(a, round(mysum$coefficients[i,4],6))
a<-table.element(a, round(mysum$coefficients[i,4]/2,6))
a<-table.row.end(a)
}
a<-table.end(a)
table.save(a,file='mytable2.tab')
a<-table.start()
a<-table.row.start(a)
a<-table.element(a, 'Multiple Linear Regression - Regression Statistics', 2, TRUE)
a<-table.row.end(a)
a<-table.row.start(a)
a<-table.element(a, 'Multiple R',1,TRUE)
a<-table.element(a, sqrt(mysum$r.squared))
a<-table.row.end(a)
a<-table.row.start(a)
a<-table.element(a, 'R-squared',1,TRUE)
a<-table.element(a, mysum$r.squared)
a<-table.row.end(a)
a<-table.row.start(a)
a<-table.element(a, 'Adjusted R-squared',1,TRUE)
a<-table.element(a, mysum$adj.r.squared)
a<-table.row.end(a)
a<-table.row.start(a)
a<-table.element(a, 'F-TEST (value)',1,TRUE)
a<-table.element(a, mysum$fstatistic[1])
a<-table.row.end(a)
a<-table.row.start(a)
a<-table.element(a, 'F-TEST (DF numerator)',1,TRUE)
a<-table.element(a, mysum$fstatistic[2])
a<-table.row.end(a)
a<-table.row.start(a)
a<-table.element(a, 'F-TEST (DF denominator)',1,TRUE)
a<-table.element(a, mysum$fstatistic[3])
a<-table.row.end(a)
a<-table.row.start(a)
a<-table.element(a, 'p-value',1,TRUE)
a<-table.element(a, 1-pf(mysum$fstatistic[1],mysum$fstatistic[2],mysum$fstatistic[3]))
a<-table.row.end(a)
a<-table.row.start(a)
a<-table.element(a, 'Multiple Linear Regression - Residual Statistics', 2, TRUE)
a<-table.row.end(a)
a<-table.row.start(a)
a<-table.element(a, 'Residual Standard Deviation',1,TRUE)
a<-table.element(a, mysum$sigma)
a<-table.row.end(a)
a<-table.row.start(a)
a<-table.element(a, 'Sum Squared Residuals',1,TRUE)
a<-table.element(a, sum(myerror*myerror))
a<-table.row.end(a)
a<-table.end(a)
table.save(a,file='mytable3.tab')
a<-table.start()
a<-table.row.start(a)
a<-table.element(a, 'Multiple Linear Regression - Actuals, Interpolation, and Residuals', 4, TRUE)
a<-table.row.end(a)
a<-table.row.start(a)
a<-table.element(a, 'Time or Index', 1, TRUE)
a<-table.element(a, 'Actuals', 1, TRUE)
a<-table.element(a, 'Interpolation
Forecast', 1, TRUE)
a<-table.element(a, 'Residuals
Prediction Error', 1, TRUE)
a<-table.row.end(a)
for (i in 1:n) {
a<-table.row.start(a)
a<-table.element(a,i, 1, TRUE)
a<-table.element(a,x[i])
a<-table.element(a,x[i]-mysum$resid[i])
a<-table.element(a,mysum$resid[i])
a<-table.row.end(a)
}
a<-table.end(a)
table.save(a,file='mytable4.tab')