Free Statistics

of Irreproducible Research!

Author's title

Author*Unverified author*
R Software Modulerwasp_autocorrelation.wasp
Title produced by software(Partial) Autocorrelation Function
Date of computationThu, 20 Dec 2007 10:12:17 -0700
Cite this page as followsStatistical Computations at FreeStatistics.org, Office for Research Development and Education, URL https://freestatistics.org/blog/index.php?v=date/2007/Dec/20/t1198169684shh2xdqliath372.htm/, Retrieved Mon, 29 Apr 2024 09:30:36 +0000
Statistical Computations at FreeStatistics.org, Office for Research Development and Education, URL https://freestatistics.org/blog/index.php?pk=4750, Retrieved Mon, 29 Apr 2024 09:30:36 +0000
QR Codes:

Original text written by user:
IsPrivate?No (this computation is public)
User-defined keywords
Estimated Impact218
Family? (F = Feedback message, R = changed R code, M = changed R Module, P = changed Parameters, D = changed Data)
-     [(Partial) Autocorrelation Function] [autocorrelatie la...] [2007-12-15 11:59:18] [ac43070f252ecb0e957ff7a950840d09]
-   PD    [(Partial) Autocorrelation Function] [aanpassing lambda...] [2007-12-20 17:12:17] [d41d8cd98f00b204e9800998ecf8427e] [Current]
Feedback Forum

Post a new message
Dataseries X:
36845
35338
35022
34777
26887
23970
22780
17351
21382
24561
17409
11514
31514
27071
29462
26105
22397
23843
21705
18089
20764
25316
17704
15548
28029
29383
36438
32034
22679
24319
18004
17537
20366
22782
19169
13807
29743
25591
29096
26482
22405
27044
17970
18730
19684
19785
18479
10698
31956
29506
34506
27165
26736
23691
18157
17328
18205
20995
17382
9367


Summary of compuational transaction
Raw Inputview raw input (R code)
Raw Outputview raw output of R engine
Computing time5 seconds
R Server'Gwilym Jenkins' @ 72.249.127.135

\begin{tabular}{lllllllll}
\hline
Summary of compuational transaction \tabularnewline
Raw Input & view raw input (R code)  \tabularnewline
Raw Output & view raw output of R engine  \tabularnewline
Computing time & 5 seconds \tabularnewline
R Server & 'Gwilym Jenkins' @ 72.249.127.135 \tabularnewline
\hline
\end{tabular}
%Source: https://freestatistics.org/blog/index.php?pk=4750&T=0

[TABLE]
[ROW][C]Summary of compuational transaction[/C][/ROW]
[ROW][C]Raw Input[/C][C]view raw input (R code) [/C][/ROW]
[ROW][C]Raw Output[/C][C]view raw output of R engine [/C][/ROW]
[ROW][C]Computing time[/C][C]5 seconds[/C][/ROW]
[ROW][C]R Server[/C][C]'Gwilym Jenkins' @ 72.249.127.135[/C][/ROW]
[/TABLE]
Source: https://freestatistics.org/blog/index.php?pk=4750&T=0

Globally Unique Identifier (entire table): ba.freestatistics.org/blog/index.php?pk=4750&T=0

As an alternative you can also use a QR Code:  

The GUIDs for individual cells are displayed in the table below:

Summary of compuational transaction
Raw Inputview raw input (R code)
Raw Outputview raw output of R engine
Computing time5 seconds
R Server'Gwilym Jenkins' @ 72.249.127.135


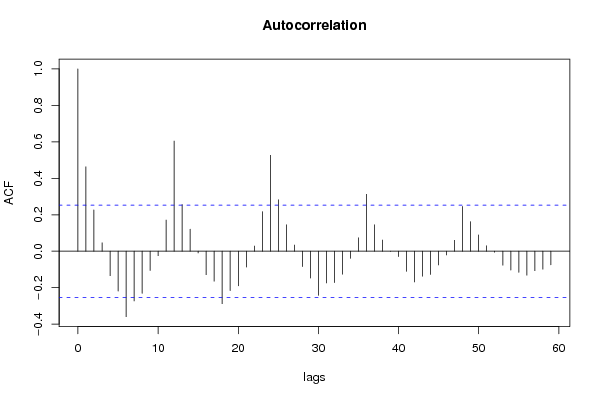
Autocorrelation Function
Time lag kACF(k)T-STATP-value
017.7460
10.4630853.5870.000337
20.226181.7520.042443
30.0463380.35890.360452
4-0.134537-1.04210.849232
5-0.21879-1.69470.952346
6-0.359085-2.78150.996389
7-0.272818-2.11320.980626
8-0.231103-1.79010.960759
9-0.105638-0.81830.791779
10-0.024923-0.19310.576216
110.170721.32240.095529
120.6046314.68358e-06
130.2560431.98330.025958
140.1211190.93820.175955
15-0.009193-0.07120.528264
16-0.129202-1.00080.839527
17-0.164386-1.27330.896093
18-0.288273-2.2330.985353
19-0.215717-1.67090.950028
20-0.190206-1.47330.927055
21-0.087181-0.67530.74896
220.0281490.2180.414069
230.2168861.680.049079
240.5263344.0776.8e-05
250.2816842.18190.016522
260.1449151.12250.133059
270.0337340.26130.397378
28-0.084036-0.65090.741214
29-0.147593-1.14330.871262
30-0.242206-1.87610.967247
31-0.173811-1.34630.908371
32-0.172378-1.33520.906578
33-0.126297-0.97830.83407
34-0.038699-0.29980.617302
350.0738490.5720.28472
360.3124722.42040.009274
370.1447281.12110.133364
380.061240.47440.318481
39-0.000785-0.00610.502417
40-0.029273-0.22670.589304
41-0.110453-0.85560.802179
42-0.168568-1.30570.901685
43-0.136948-1.06080.853483
44-0.127593-0.98830.836521
45-0.075408-0.58410.719331
46-0.020191-0.15640.561879
470.0600980.46550.321623
480.2458191.90410.030847
490.162031.25510.107158
500.0892720.69150.245961
510.0296460.22960.409578
52-0.005512-0.04270.516958
53-0.076682-0.5940.72262
54-0.103791-0.8040.787703
55-0.115696-0.89620.81313
56-0.131388-1.01770.843553
57-0.10688-0.82790.794494
58-0.09889-0.7660.77666
59-0.074841-0.57970.717863

\begin{tabular}{lllllllll}
\hline
Autocorrelation Function \tabularnewline
Time lag k & ACF(k) & T-STAT & P-value \tabularnewline
0 & 1 & 7.746 & 0 \tabularnewline
1 & 0.463085 & 3.587 & 0.000337 \tabularnewline
2 & 0.22618 & 1.752 & 0.042443 \tabularnewline
3 & 0.046338 & 0.3589 & 0.360452 \tabularnewline
4 & -0.134537 & -1.0421 & 0.849232 \tabularnewline
5 & -0.21879 & -1.6947 & 0.952346 \tabularnewline
6 & -0.359085 & -2.7815 & 0.996389 \tabularnewline
7 & -0.272818 & -2.1132 & 0.980626 \tabularnewline
8 & -0.231103 & -1.7901 & 0.960759 \tabularnewline
9 & -0.105638 & -0.8183 & 0.791779 \tabularnewline
10 & -0.024923 & -0.1931 & 0.576216 \tabularnewline
11 & 0.17072 & 1.3224 & 0.095529 \tabularnewline
12 & 0.604631 & 4.6835 & 8e-06 \tabularnewline
13 & 0.256043 & 1.9833 & 0.025958 \tabularnewline
14 & 0.121119 & 0.9382 & 0.175955 \tabularnewline
15 & -0.009193 & -0.0712 & 0.528264 \tabularnewline
16 & -0.129202 & -1.0008 & 0.839527 \tabularnewline
17 & -0.164386 & -1.2733 & 0.896093 \tabularnewline
18 & -0.288273 & -2.233 & 0.985353 \tabularnewline
19 & -0.215717 & -1.6709 & 0.950028 \tabularnewline
20 & -0.190206 & -1.4733 & 0.927055 \tabularnewline
21 & -0.087181 & -0.6753 & 0.74896 \tabularnewline
22 & 0.028149 & 0.218 & 0.414069 \tabularnewline
23 & 0.216886 & 1.68 & 0.049079 \tabularnewline
24 & 0.526334 & 4.077 & 6.8e-05 \tabularnewline
25 & 0.281684 & 2.1819 & 0.016522 \tabularnewline
26 & 0.144915 & 1.1225 & 0.133059 \tabularnewline
27 & 0.033734 & 0.2613 & 0.397378 \tabularnewline
28 & -0.084036 & -0.6509 & 0.741214 \tabularnewline
29 & -0.147593 & -1.1433 & 0.871262 \tabularnewline
30 & -0.242206 & -1.8761 & 0.967247 \tabularnewline
31 & -0.173811 & -1.3463 & 0.908371 \tabularnewline
32 & -0.172378 & -1.3352 & 0.906578 \tabularnewline
33 & -0.126297 & -0.9783 & 0.83407 \tabularnewline
34 & -0.038699 & -0.2998 & 0.617302 \tabularnewline
35 & 0.073849 & 0.572 & 0.28472 \tabularnewline
36 & 0.312472 & 2.4204 & 0.009274 \tabularnewline
37 & 0.144728 & 1.1211 & 0.133364 \tabularnewline
38 & 0.06124 & 0.4744 & 0.318481 \tabularnewline
39 & -0.000785 & -0.0061 & 0.502417 \tabularnewline
40 & -0.029273 & -0.2267 & 0.589304 \tabularnewline
41 & -0.110453 & -0.8556 & 0.802179 \tabularnewline
42 & -0.168568 & -1.3057 & 0.901685 \tabularnewline
43 & -0.136948 & -1.0608 & 0.853483 \tabularnewline
44 & -0.127593 & -0.9883 & 0.836521 \tabularnewline
45 & -0.075408 & -0.5841 & 0.719331 \tabularnewline
46 & -0.020191 & -0.1564 & 0.561879 \tabularnewline
47 & 0.060098 & 0.4655 & 0.321623 \tabularnewline
48 & 0.245819 & 1.9041 & 0.030847 \tabularnewline
49 & 0.16203 & 1.2551 & 0.107158 \tabularnewline
50 & 0.089272 & 0.6915 & 0.245961 \tabularnewline
51 & 0.029646 & 0.2296 & 0.409578 \tabularnewline
52 & -0.005512 & -0.0427 & 0.516958 \tabularnewline
53 & -0.076682 & -0.594 & 0.72262 \tabularnewline
54 & -0.103791 & -0.804 & 0.787703 \tabularnewline
55 & -0.115696 & -0.8962 & 0.81313 \tabularnewline
56 & -0.131388 & -1.0177 & 0.843553 \tabularnewline
57 & -0.10688 & -0.8279 & 0.794494 \tabularnewline
58 & -0.09889 & -0.766 & 0.77666 \tabularnewline
59 & -0.074841 & -0.5797 & 0.717863 \tabularnewline
\hline
\end{tabular}
%Source: https://freestatistics.org/blog/index.php?pk=4750&T=1

[TABLE]
[ROW][C]Autocorrelation Function[/C][/ROW]
[ROW][C]Time lag k[/C][C]ACF(k)[/C][C]T-STAT[/C][C]P-value[/C][/ROW]
[ROW][C]0[/C][C]1[/C][C]7.746[/C][C]0[/C][/ROW]
[ROW][C]1[/C][C]0.463085[/C][C]3.587[/C][C]0.000337[/C][/ROW]
[ROW][C]2[/C][C]0.22618[/C][C]1.752[/C][C]0.042443[/C][/ROW]
[ROW][C]3[/C][C]0.046338[/C][C]0.3589[/C][C]0.360452[/C][/ROW]
[ROW][C]4[/C][C]-0.134537[/C][C]-1.0421[/C][C]0.849232[/C][/ROW]
[ROW][C]5[/C][C]-0.21879[/C][C]-1.6947[/C][C]0.952346[/C][/ROW]
[ROW][C]6[/C][C]-0.359085[/C][C]-2.7815[/C][C]0.996389[/C][/ROW]
[ROW][C]7[/C][C]-0.272818[/C][C]-2.1132[/C][C]0.980626[/C][/ROW]
[ROW][C]8[/C][C]-0.231103[/C][C]-1.7901[/C][C]0.960759[/C][/ROW]
[ROW][C]9[/C][C]-0.105638[/C][C]-0.8183[/C][C]0.791779[/C][/ROW]
[ROW][C]10[/C][C]-0.024923[/C][C]-0.1931[/C][C]0.576216[/C][/ROW]
[ROW][C]11[/C][C]0.17072[/C][C]1.3224[/C][C]0.095529[/C][/ROW]
[ROW][C]12[/C][C]0.604631[/C][C]4.6835[/C][C]8e-06[/C][/ROW]
[ROW][C]13[/C][C]0.256043[/C][C]1.9833[/C][C]0.025958[/C][/ROW]
[ROW][C]14[/C][C]0.121119[/C][C]0.9382[/C][C]0.175955[/C][/ROW]
[ROW][C]15[/C][C]-0.009193[/C][C]-0.0712[/C][C]0.528264[/C][/ROW]
[ROW][C]16[/C][C]-0.129202[/C][C]-1.0008[/C][C]0.839527[/C][/ROW]
[ROW][C]17[/C][C]-0.164386[/C][C]-1.2733[/C][C]0.896093[/C][/ROW]
[ROW][C]18[/C][C]-0.288273[/C][C]-2.233[/C][C]0.985353[/C][/ROW]
[ROW][C]19[/C][C]-0.215717[/C][C]-1.6709[/C][C]0.950028[/C][/ROW]
[ROW][C]20[/C][C]-0.190206[/C][C]-1.4733[/C][C]0.927055[/C][/ROW]
[ROW][C]21[/C][C]-0.087181[/C][C]-0.6753[/C][C]0.74896[/C][/ROW]
[ROW][C]22[/C][C]0.028149[/C][C]0.218[/C][C]0.414069[/C][/ROW]
[ROW][C]23[/C][C]0.216886[/C][C]1.68[/C][C]0.049079[/C][/ROW]
[ROW][C]24[/C][C]0.526334[/C][C]4.077[/C][C]6.8e-05[/C][/ROW]
[ROW][C]25[/C][C]0.281684[/C][C]2.1819[/C][C]0.016522[/C][/ROW]
[ROW][C]26[/C][C]0.144915[/C][C]1.1225[/C][C]0.133059[/C][/ROW]
[ROW][C]27[/C][C]0.033734[/C][C]0.2613[/C][C]0.397378[/C][/ROW]
[ROW][C]28[/C][C]-0.084036[/C][C]-0.6509[/C][C]0.741214[/C][/ROW]
[ROW][C]29[/C][C]-0.147593[/C][C]-1.1433[/C][C]0.871262[/C][/ROW]
[ROW][C]30[/C][C]-0.242206[/C][C]-1.8761[/C][C]0.967247[/C][/ROW]
[ROW][C]31[/C][C]-0.173811[/C][C]-1.3463[/C][C]0.908371[/C][/ROW]
[ROW][C]32[/C][C]-0.172378[/C][C]-1.3352[/C][C]0.906578[/C][/ROW]
[ROW][C]33[/C][C]-0.126297[/C][C]-0.9783[/C][C]0.83407[/C][/ROW]
[ROW][C]34[/C][C]-0.038699[/C][C]-0.2998[/C][C]0.617302[/C][/ROW]
[ROW][C]35[/C][C]0.073849[/C][C]0.572[/C][C]0.28472[/C][/ROW]
[ROW][C]36[/C][C]0.312472[/C][C]2.4204[/C][C]0.009274[/C][/ROW]
[ROW][C]37[/C][C]0.144728[/C][C]1.1211[/C][C]0.133364[/C][/ROW]
[ROW][C]38[/C][C]0.06124[/C][C]0.4744[/C][C]0.318481[/C][/ROW]
[ROW][C]39[/C][C]-0.000785[/C][C]-0.0061[/C][C]0.502417[/C][/ROW]
[ROW][C]40[/C][C]-0.029273[/C][C]-0.2267[/C][C]0.589304[/C][/ROW]
[ROW][C]41[/C][C]-0.110453[/C][C]-0.8556[/C][C]0.802179[/C][/ROW]
[ROW][C]42[/C][C]-0.168568[/C][C]-1.3057[/C][C]0.901685[/C][/ROW]
[ROW][C]43[/C][C]-0.136948[/C][C]-1.0608[/C][C]0.853483[/C][/ROW]
[ROW][C]44[/C][C]-0.127593[/C][C]-0.9883[/C][C]0.836521[/C][/ROW]
[ROW][C]45[/C][C]-0.075408[/C][C]-0.5841[/C][C]0.719331[/C][/ROW]
[ROW][C]46[/C][C]-0.020191[/C][C]-0.1564[/C][C]0.561879[/C][/ROW]
[ROW][C]47[/C][C]0.060098[/C][C]0.4655[/C][C]0.321623[/C][/ROW]
[ROW][C]48[/C][C]0.245819[/C][C]1.9041[/C][C]0.030847[/C][/ROW]
[ROW][C]49[/C][C]0.16203[/C][C]1.2551[/C][C]0.107158[/C][/ROW]
[ROW][C]50[/C][C]0.089272[/C][C]0.6915[/C][C]0.245961[/C][/ROW]
[ROW][C]51[/C][C]0.029646[/C][C]0.2296[/C][C]0.409578[/C][/ROW]
[ROW][C]52[/C][C]-0.005512[/C][C]-0.0427[/C][C]0.516958[/C][/ROW]
[ROW][C]53[/C][C]-0.076682[/C][C]-0.594[/C][C]0.72262[/C][/ROW]
[ROW][C]54[/C][C]-0.103791[/C][C]-0.804[/C][C]0.787703[/C][/ROW]
[ROW][C]55[/C][C]-0.115696[/C][C]-0.8962[/C][C]0.81313[/C][/ROW]
[ROW][C]56[/C][C]-0.131388[/C][C]-1.0177[/C][C]0.843553[/C][/ROW]
[ROW][C]57[/C][C]-0.10688[/C][C]-0.8279[/C][C]0.794494[/C][/ROW]
[ROW][C]58[/C][C]-0.09889[/C][C]-0.766[/C][C]0.77666[/C][/ROW]
[ROW][C]59[/C][C]-0.074841[/C][C]-0.5797[/C][C]0.717863[/C][/ROW]
[/TABLE]
Source: https://freestatistics.org/blog/index.php?pk=4750&T=1

Globally Unique Identifier (entire table): ba.freestatistics.org/blog/index.php?pk=4750&T=1

As an alternative you can also use a QR Code:  

The GUIDs for individual cells are displayed in the table below:

Autocorrelation Function
Time lag kACF(k)T-STATP-value
017.7460
10.4630853.5870.000337
20.226181.7520.042443
30.0463380.35890.360452
4-0.134537-1.04210.849232
5-0.21879-1.69470.952346
6-0.359085-2.78150.996389
7-0.272818-2.11320.980626
8-0.231103-1.79010.960759
9-0.105638-0.81830.791779
10-0.024923-0.19310.576216
110.170721.32240.095529
120.6046314.68358e-06
130.2560431.98330.025958
140.1211190.93820.175955
15-0.009193-0.07120.528264
16-0.129202-1.00080.839527
17-0.164386-1.27330.896093
18-0.288273-2.2330.985353
19-0.215717-1.67090.950028
20-0.190206-1.47330.927055
21-0.087181-0.67530.74896
220.0281490.2180.414069
230.2168861.680.049079
240.5263344.0776.8e-05
250.2816842.18190.016522
260.1449151.12250.133059
270.0337340.26130.397378
28-0.084036-0.65090.741214
29-0.147593-1.14330.871262
30-0.242206-1.87610.967247
31-0.173811-1.34630.908371
32-0.172378-1.33520.906578
33-0.126297-0.97830.83407
34-0.038699-0.29980.617302
350.0738490.5720.28472
360.3124722.42040.009274
370.1447281.12110.133364
380.061240.47440.318481
39-0.000785-0.00610.502417
40-0.029273-0.22670.589304
41-0.110453-0.85560.802179
42-0.168568-1.30570.901685
43-0.136948-1.06080.853483
44-0.127593-0.98830.836521
45-0.075408-0.58410.719331
46-0.020191-0.15640.561879
470.0600980.46550.321623
480.2458191.90410.030847
490.162031.25510.107158
500.0892720.69150.245961
510.0296460.22960.409578
52-0.005512-0.04270.516958
53-0.076682-0.5940.72262
54-0.103791-0.8040.787703
55-0.115696-0.89620.81313
56-0.131388-1.01770.843553
57-0.10688-0.82790.794494
58-0.09889-0.7660.77666
59-0.074841-0.57970.717863


Partial Autocorrelation Function
Time lag kPACF(k)T-STATP-value
00.4630853.5870.000337
10.0149350.11570.454144
2-0.081176-0.62880.734063
3-0.166487-1.28960.898931
4-0.110269-0.85410.801788
5-0.240654-1.86410.966399
6-0.006126-0.04750.518846
7-0.095975-0.74340.769935
80.0159010.12320.451192
9-0.055515-0.430.665639
100.1709761.32440.0952
110.5543454.29393.3e-05
12-0.448308-3.47260.999519
13-0.112264-0.86960.806005
14-0.022801-0.17660.569798
15-0.009103-0.07050.527989
160.0244380.18930.42525
17-0.021081-0.16330.564582
18-0.017953-0.13910.555066
19-0.028981-0.22450.588429
200.0147960.11460.454568
210.242021.87470.032854
220.0935540.72470.235737
23-0.089047-0.68980.753495
240.0072270.0560.477771
25-0.077648-0.60150.725099
260.0848830.65750.256687
270.0182420.14130.444053
28-0.079512-0.61590.729855
290.0680770.52730.299957
300.0323030.25020.401636
310.0192550.14920.440967
32-0.003525-0.02730.510845
33-0.09092-0.70430.758004
34-0.155646-1.20560.883653
350.0032740.02540.489926
36-0.016495-0.12780.550622
370.0876940.67930.249787
38-0.086157-0.66740.746451
390.1065510.82530.206225
40-0.086713-0.67170.747816
410.0081120.06280.475053
42-0.06621-0.51290.695034
430.0245950.19050.424774
440.0006670.00520.497947
45-0.080191-0.62120.731575
46-0.014812-0.11470.545481
470.0312780.24230.404694
480.1065010.8250.206333
49-0.010307-0.07980.531685
50-0.012766-0.09890.53922
51-0.125449-0.97170.832456
520.0683880.52970.299127
530.0131030.10150.459749
540.0040990.03170.487388
55-0.105109-0.81420.790617
56-0.113294-0.87760.808161
57-0.032007-0.24790.597482
58-0.040156-0.3110.621578
59NANANA

\begin{tabular}{lllllllll}
\hline
Partial Autocorrelation Function \tabularnewline
Time lag k & PACF(k) & T-STAT & P-value \tabularnewline
0 & 0.463085 & 3.587 & 0.000337 \tabularnewline
1 & 0.014935 & 0.1157 & 0.454144 \tabularnewline
2 & -0.081176 & -0.6288 & 0.734063 \tabularnewline
3 & -0.166487 & -1.2896 & 0.898931 \tabularnewline
4 & -0.110269 & -0.8541 & 0.801788 \tabularnewline
5 & -0.240654 & -1.8641 & 0.966399 \tabularnewline
6 & -0.006126 & -0.0475 & 0.518846 \tabularnewline
7 & -0.095975 & -0.7434 & 0.769935 \tabularnewline
8 & 0.015901 & 0.1232 & 0.451192 \tabularnewline
9 & -0.055515 & -0.43 & 0.665639 \tabularnewline
10 & 0.170976 & 1.3244 & 0.0952 \tabularnewline
11 & 0.554345 & 4.2939 & 3.3e-05 \tabularnewline
12 & -0.448308 & -3.4726 & 0.999519 \tabularnewline
13 & -0.112264 & -0.8696 & 0.806005 \tabularnewline
14 & -0.022801 & -0.1766 & 0.569798 \tabularnewline
15 & -0.009103 & -0.0705 & 0.527989 \tabularnewline
16 & 0.024438 & 0.1893 & 0.42525 \tabularnewline
17 & -0.021081 & -0.1633 & 0.564582 \tabularnewline
18 & -0.017953 & -0.1391 & 0.555066 \tabularnewline
19 & -0.028981 & -0.2245 & 0.588429 \tabularnewline
20 & 0.014796 & 0.1146 & 0.454568 \tabularnewline
21 & 0.24202 & 1.8747 & 0.032854 \tabularnewline
22 & 0.093554 & 0.7247 & 0.235737 \tabularnewline
23 & -0.089047 & -0.6898 & 0.753495 \tabularnewline
24 & 0.007227 & 0.056 & 0.477771 \tabularnewline
25 & -0.077648 & -0.6015 & 0.725099 \tabularnewline
26 & 0.084883 & 0.6575 & 0.256687 \tabularnewline
27 & 0.018242 & 0.1413 & 0.444053 \tabularnewline
28 & -0.079512 & -0.6159 & 0.729855 \tabularnewline
29 & 0.068077 & 0.5273 & 0.299957 \tabularnewline
30 & 0.032303 & 0.2502 & 0.401636 \tabularnewline
31 & 0.019255 & 0.1492 & 0.440967 \tabularnewline
32 & -0.003525 & -0.0273 & 0.510845 \tabularnewline
33 & -0.09092 & -0.7043 & 0.758004 \tabularnewline
34 & -0.155646 & -1.2056 & 0.883653 \tabularnewline
35 & 0.003274 & 0.0254 & 0.489926 \tabularnewline
36 & -0.016495 & -0.1278 & 0.550622 \tabularnewline
37 & 0.087694 & 0.6793 & 0.249787 \tabularnewline
38 & -0.086157 & -0.6674 & 0.746451 \tabularnewline
39 & 0.106551 & 0.8253 & 0.206225 \tabularnewline
40 & -0.086713 & -0.6717 & 0.747816 \tabularnewline
41 & 0.008112 & 0.0628 & 0.475053 \tabularnewline
42 & -0.06621 & -0.5129 & 0.695034 \tabularnewline
43 & 0.024595 & 0.1905 & 0.424774 \tabularnewline
44 & 0.000667 & 0.0052 & 0.497947 \tabularnewline
45 & -0.080191 & -0.6212 & 0.731575 \tabularnewline
46 & -0.014812 & -0.1147 & 0.545481 \tabularnewline
47 & 0.031278 & 0.2423 & 0.404694 \tabularnewline
48 & 0.106501 & 0.825 & 0.206333 \tabularnewline
49 & -0.010307 & -0.0798 & 0.531685 \tabularnewline
50 & -0.012766 & -0.0989 & 0.53922 \tabularnewline
51 & -0.125449 & -0.9717 & 0.832456 \tabularnewline
52 & 0.068388 & 0.5297 & 0.299127 \tabularnewline
53 & 0.013103 & 0.1015 & 0.459749 \tabularnewline
54 & 0.004099 & 0.0317 & 0.487388 \tabularnewline
55 & -0.105109 & -0.8142 & 0.790617 \tabularnewline
56 & -0.113294 & -0.8776 & 0.808161 \tabularnewline
57 & -0.032007 & -0.2479 & 0.597482 \tabularnewline
58 & -0.040156 & -0.311 & 0.621578 \tabularnewline
59 & NA & NA & NA \tabularnewline
\hline
\end{tabular}
%Source: https://freestatistics.org/blog/index.php?pk=4750&T=2

[TABLE]
[ROW][C]Partial Autocorrelation Function[/C][/ROW]
[ROW][C]Time lag k[/C][C]PACF(k)[/C][C]T-STAT[/C][C]P-value[/C][/ROW]
[ROW][C]0[/C][C]0.463085[/C][C]3.587[/C][C]0.000337[/C][/ROW]
[ROW][C]1[/C][C]0.014935[/C][C]0.1157[/C][C]0.454144[/C][/ROW]
[ROW][C]2[/C][C]-0.081176[/C][C]-0.6288[/C][C]0.734063[/C][/ROW]
[ROW][C]3[/C][C]-0.166487[/C][C]-1.2896[/C][C]0.898931[/C][/ROW]
[ROW][C]4[/C][C]-0.110269[/C][C]-0.8541[/C][C]0.801788[/C][/ROW]
[ROW][C]5[/C][C]-0.240654[/C][C]-1.8641[/C][C]0.966399[/C][/ROW]
[ROW][C]6[/C][C]-0.006126[/C][C]-0.0475[/C][C]0.518846[/C][/ROW]
[ROW][C]7[/C][C]-0.095975[/C][C]-0.7434[/C][C]0.769935[/C][/ROW]
[ROW][C]8[/C][C]0.015901[/C][C]0.1232[/C][C]0.451192[/C][/ROW]
[ROW][C]9[/C][C]-0.055515[/C][C]-0.43[/C][C]0.665639[/C][/ROW]
[ROW][C]10[/C][C]0.170976[/C][C]1.3244[/C][C]0.0952[/C][/ROW]
[ROW][C]11[/C][C]0.554345[/C][C]4.2939[/C][C]3.3e-05[/C][/ROW]
[ROW][C]12[/C][C]-0.448308[/C][C]-3.4726[/C][C]0.999519[/C][/ROW]
[ROW][C]13[/C][C]-0.112264[/C][C]-0.8696[/C][C]0.806005[/C][/ROW]
[ROW][C]14[/C][C]-0.022801[/C][C]-0.1766[/C][C]0.569798[/C][/ROW]
[ROW][C]15[/C][C]-0.009103[/C][C]-0.0705[/C][C]0.527989[/C][/ROW]
[ROW][C]16[/C][C]0.024438[/C][C]0.1893[/C][C]0.42525[/C][/ROW]
[ROW][C]17[/C][C]-0.021081[/C][C]-0.1633[/C][C]0.564582[/C][/ROW]
[ROW][C]18[/C][C]-0.017953[/C][C]-0.1391[/C][C]0.555066[/C][/ROW]
[ROW][C]19[/C][C]-0.028981[/C][C]-0.2245[/C][C]0.588429[/C][/ROW]
[ROW][C]20[/C][C]0.014796[/C][C]0.1146[/C][C]0.454568[/C][/ROW]
[ROW][C]21[/C][C]0.24202[/C][C]1.8747[/C][C]0.032854[/C][/ROW]
[ROW][C]22[/C][C]0.093554[/C][C]0.7247[/C][C]0.235737[/C][/ROW]
[ROW][C]23[/C][C]-0.089047[/C][C]-0.6898[/C][C]0.753495[/C][/ROW]
[ROW][C]24[/C][C]0.007227[/C][C]0.056[/C][C]0.477771[/C][/ROW]
[ROW][C]25[/C][C]-0.077648[/C][C]-0.6015[/C][C]0.725099[/C][/ROW]
[ROW][C]26[/C][C]0.084883[/C][C]0.6575[/C][C]0.256687[/C][/ROW]
[ROW][C]27[/C][C]0.018242[/C][C]0.1413[/C][C]0.444053[/C][/ROW]
[ROW][C]28[/C][C]-0.079512[/C][C]-0.6159[/C][C]0.729855[/C][/ROW]
[ROW][C]29[/C][C]0.068077[/C][C]0.5273[/C][C]0.299957[/C][/ROW]
[ROW][C]30[/C][C]0.032303[/C][C]0.2502[/C][C]0.401636[/C][/ROW]
[ROW][C]31[/C][C]0.019255[/C][C]0.1492[/C][C]0.440967[/C][/ROW]
[ROW][C]32[/C][C]-0.003525[/C][C]-0.0273[/C][C]0.510845[/C][/ROW]
[ROW][C]33[/C][C]-0.09092[/C][C]-0.7043[/C][C]0.758004[/C][/ROW]
[ROW][C]34[/C][C]-0.155646[/C][C]-1.2056[/C][C]0.883653[/C][/ROW]
[ROW][C]35[/C][C]0.003274[/C][C]0.0254[/C][C]0.489926[/C][/ROW]
[ROW][C]36[/C][C]-0.016495[/C][C]-0.1278[/C][C]0.550622[/C][/ROW]
[ROW][C]37[/C][C]0.087694[/C][C]0.6793[/C][C]0.249787[/C][/ROW]
[ROW][C]38[/C][C]-0.086157[/C][C]-0.6674[/C][C]0.746451[/C][/ROW]
[ROW][C]39[/C][C]0.106551[/C][C]0.8253[/C][C]0.206225[/C][/ROW]
[ROW][C]40[/C][C]-0.086713[/C][C]-0.6717[/C][C]0.747816[/C][/ROW]
[ROW][C]41[/C][C]0.008112[/C][C]0.0628[/C][C]0.475053[/C][/ROW]
[ROW][C]42[/C][C]-0.06621[/C][C]-0.5129[/C][C]0.695034[/C][/ROW]
[ROW][C]43[/C][C]0.024595[/C][C]0.1905[/C][C]0.424774[/C][/ROW]
[ROW][C]44[/C][C]0.000667[/C][C]0.0052[/C][C]0.497947[/C][/ROW]
[ROW][C]45[/C][C]-0.080191[/C][C]-0.6212[/C][C]0.731575[/C][/ROW]
[ROW][C]46[/C][C]-0.014812[/C][C]-0.1147[/C][C]0.545481[/C][/ROW]
[ROW][C]47[/C][C]0.031278[/C][C]0.2423[/C][C]0.404694[/C][/ROW]
[ROW][C]48[/C][C]0.106501[/C][C]0.825[/C][C]0.206333[/C][/ROW]
[ROW][C]49[/C][C]-0.010307[/C][C]-0.0798[/C][C]0.531685[/C][/ROW]
[ROW][C]50[/C][C]-0.012766[/C][C]-0.0989[/C][C]0.53922[/C][/ROW]
[ROW][C]51[/C][C]-0.125449[/C][C]-0.9717[/C][C]0.832456[/C][/ROW]
[ROW][C]52[/C][C]0.068388[/C][C]0.5297[/C][C]0.299127[/C][/ROW]
[ROW][C]53[/C][C]0.013103[/C][C]0.1015[/C][C]0.459749[/C][/ROW]
[ROW][C]54[/C][C]0.004099[/C][C]0.0317[/C][C]0.487388[/C][/ROW]
[ROW][C]55[/C][C]-0.105109[/C][C]-0.8142[/C][C]0.790617[/C][/ROW]
[ROW][C]56[/C][C]-0.113294[/C][C]-0.8776[/C][C]0.808161[/C][/ROW]
[ROW][C]57[/C][C]-0.032007[/C][C]-0.2479[/C][C]0.597482[/C][/ROW]
[ROW][C]58[/C][C]-0.040156[/C][C]-0.311[/C][C]0.621578[/C][/ROW]
[ROW][C]59[/C][C]NA[/C][C]NA[/C][C]NA[/C][/ROW]
[/TABLE]
Source: https://freestatistics.org/blog/index.php?pk=4750&T=2

Globally Unique Identifier (entire table): ba.freestatistics.org/blog/index.php?pk=4750&T=2

As an alternative you can also use a QR Code:  

The GUIDs for individual cells are displayed in the table below:

Partial Autocorrelation Function
Time lag kPACF(k)T-STATP-value
00.4630853.5870.000337
10.0149350.11570.454144
2-0.081176-0.62880.734063
3-0.166487-1.28960.898931
4-0.110269-0.85410.801788
5-0.240654-1.86410.966399
6-0.006126-0.04750.518846
7-0.095975-0.74340.769935
80.0159010.12320.451192
9-0.055515-0.430.665639
100.1709761.32440.0952
110.5543454.29393.3e-05
12-0.448308-3.47260.999519
13-0.112264-0.86960.806005
14-0.022801-0.17660.569798
15-0.009103-0.07050.527989
160.0244380.18930.42525
17-0.021081-0.16330.564582
18-0.017953-0.13910.555066
19-0.028981-0.22450.588429
200.0147960.11460.454568
210.242021.87470.032854
220.0935540.72470.235737
23-0.089047-0.68980.753495
240.0072270.0560.477771
25-0.077648-0.60150.725099
260.0848830.65750.256687
270.0182420.14130.444053
28-0.079512-0.61590.729855
290.0680770.52730.299957
300.0323030.25020.401636
310.0192550.14920.440967
32-0.003525-0.02730.510845
33-0.09092-0.70430.758004
34-0.155646-1.20560.883653
350.0032740.02540.489926
36-0.016495-0.12780.550622
370.0876940.67930.249787
38-0.086157-0.66740.746451
390.1065510.82530.206225
40-0.086713-0.67170.747816
410.0081120.06280.475053
42-0.06621-0.51290.695034
430.0245950.19050.424774
440.0006670.00520.497947
45-0.080191-0.62120.731575
46-0.014812-0.11470.545481
470.0312780.24230.404694
480.1065010.8250.206333
49-0.010307-0.07980.531685
50-0.012766-0.09890.53922
51-0.125449-0.97170.832456
520.0683880.52970.299127
530.0131030.10150.459749
540.0040990.03170.487388
55-0.105109-0.81420.790617
56-0.113294-0.87760.808161
57-0.032007-0.24790.597482
58-0.040156-0.3110.621578
59NANANA


Parameters (Session):
par1 = 60 ; par2 = 1 ; par3 = 0 ; par4 = 0 ; par5 = 12 ;
Parameters (R input):
par1 = 60 ; par2 = 1 ; par3 = 0 ; par4 = 0 ; par5 = 12 ;
R code (references can be found in the software module):
if (par1 == 'Default') {
par1 = 10*log10(length(x))
} else {
par1 <- as.numeric(par1)
}
par2 <- as.numeric(par2)
par3 <- as.numeric(par3)
par4 <- as.numeric(par4)
par5 <- as.numeric(par5)
if (par2 == 0) {
x <- log(x)
} else {
x <- (x ^ par2 - 1) / par2
}
if (par3 > 0) x <- diff(x,lag=1,difference=par3)
if (par4 > 0) x <- diff(x,lag=par5,difference=par4)
bitmap(file='pic1.png')
racf <- acf(x,par1,main='Autocorrelation',xlab='lags',ylab='ACF')
dev.off()
bitmap(file='pic2.png')
rpacf <- pacf(x,par1,main='Partial Autocorrelation',xlab='lags',ylab='PACF')
dev.off()
(myacf <- c(racf$acf))
(mypacf <- c(rpacf$acf))
lengthx <- length(x)
sqrtn <- sqrt(lengthx)
load(file='createtable')
a<-table.start()
a<-table.row.start(a)
a<-table.element(a,'Autocorrelation Function',4,TRUE)
a<-table.row.end(a)
a<-table.row.start(a)
a<-table.element(a,'Time lag k',header=TRUE)
a<-table.element(a,hyperlink('basics.htm','ACF(k)','click here for more information about the Autocorrelation Function'),header=TRUE)
a<-table.element(a,'T-STAT',header=TRUE)
a<-table.element(a,'P-value',header=TRUE)
a<-table.row.end(a)
for (i in 1:par1) {
a<-table.row.start(a)
a<-table.element(a,i-1,header=TRUE)
a<-table.element(a,round(myacf[i],6))
mytstat <- myacf[i]*sqrtn
a<-table.element(a,round(mytstat,4))
a<-table.element(a,round(1-pt(mytstat,lengthx),6))
a<-table.row.end(a)
}
a<-table.end(a)
table.save(a,file='mytable.tab')
a<-table.start()
a<-table.row.start(a)
a<-table.element(a,'Partial Autocorrelation Function',4,TRUE)
a<-table.row.end(a)
a<-table.row.start(a)
a<-table.element(a,'Time lag k',header=TRUE)
a<-table.element(a,hyperlink('basics.htm','PACF(k)','click here for more information about the Partial Autocorrelation Function'),header=TRUE)
a<-table.element(a,'T-STAT',header=TRUE)
a<-table.element(a,'P-value',header=TRUE)
a<-table.row.end(a)
for (i in 1:par1) {
a<-table.row.start(a)
a<-table.element(a,i-1,header=TRUE)
a<-table.element(a,round(mypacf[i],6))
mytstat <- mypacf[i]*sqrtn
a<-table.element(a,round(mytstat,4))
a<-table.element(a,round(1-pt(mytstat,lengthx),6))
a<-table.row.end(a)
}
a<-table.end(a)
table.save(a,file='mytable1.tab')